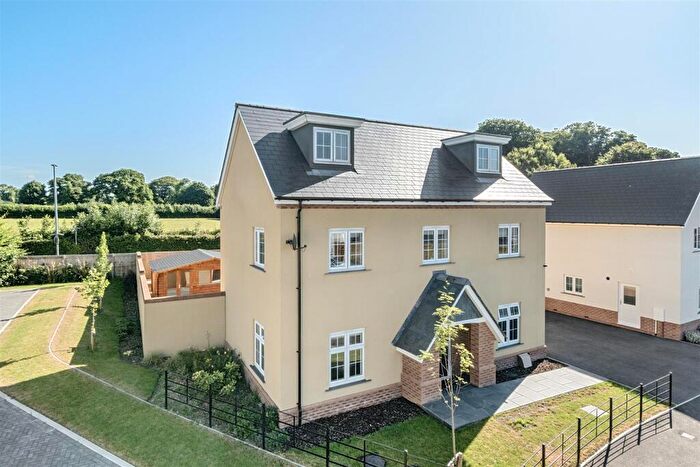
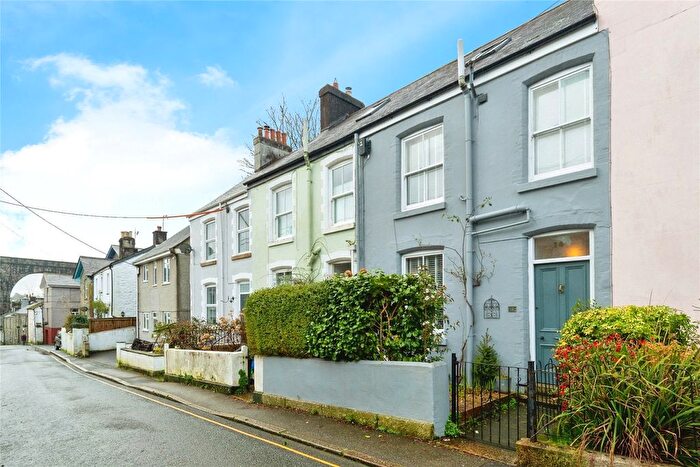
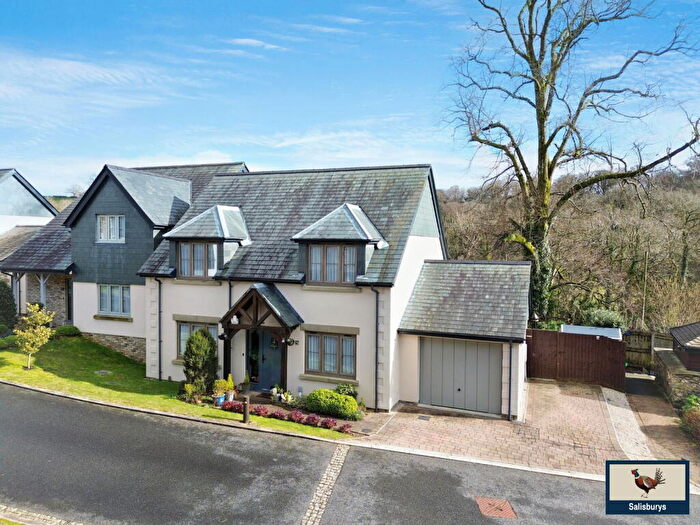
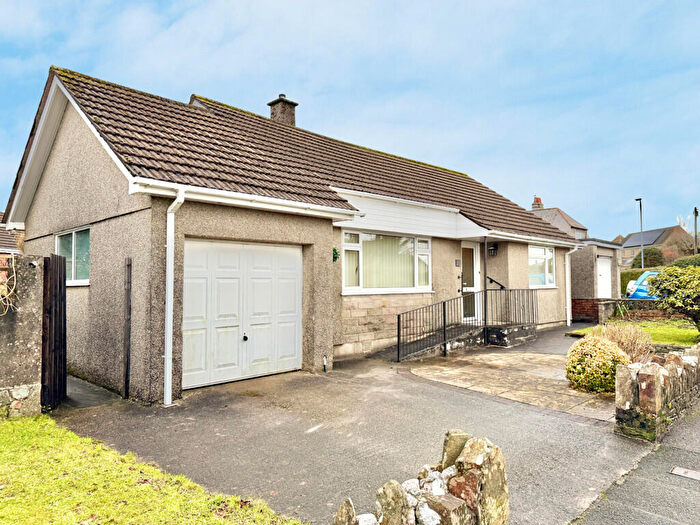
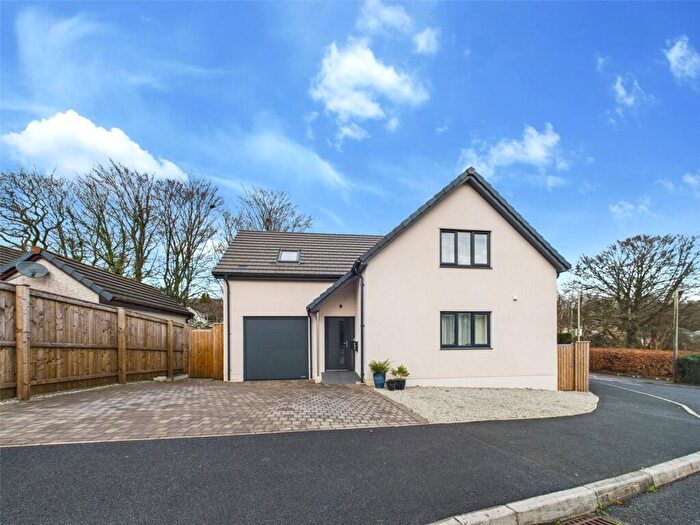
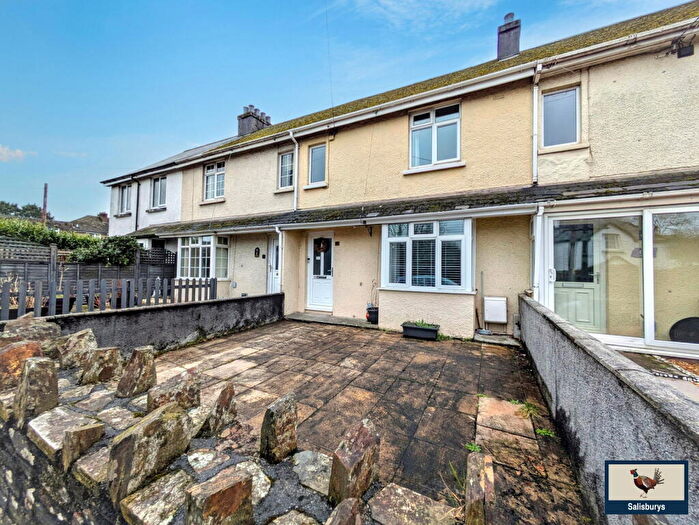
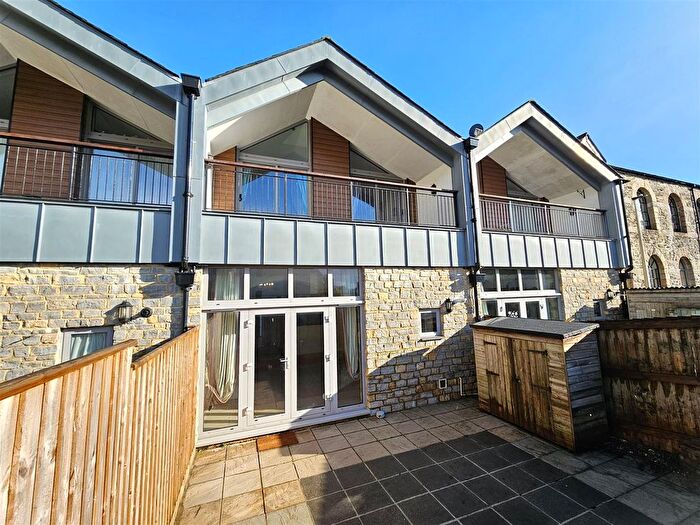
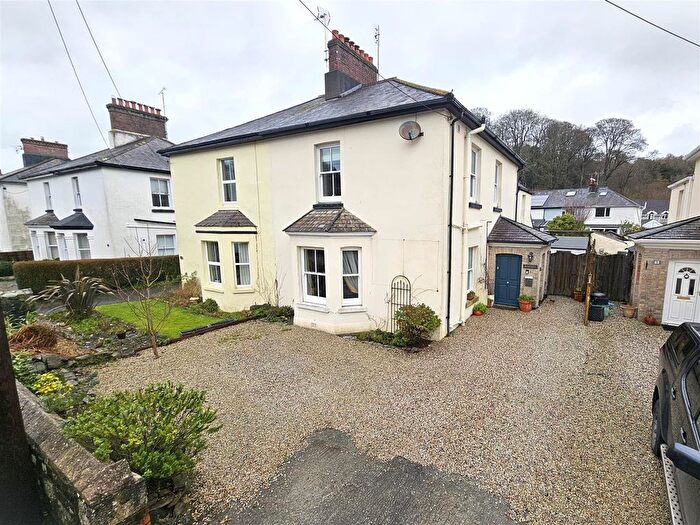
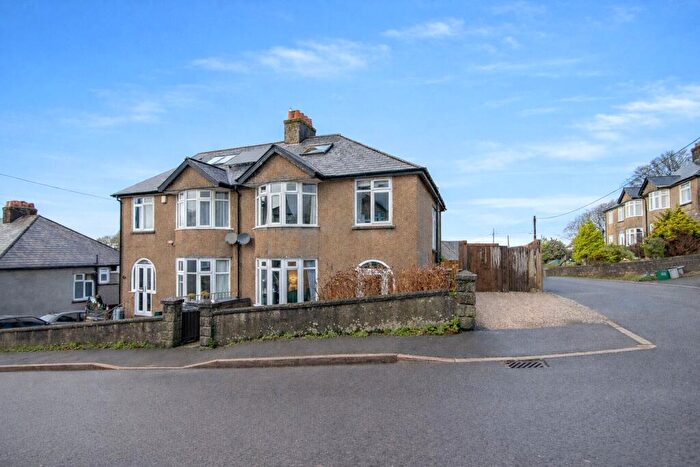
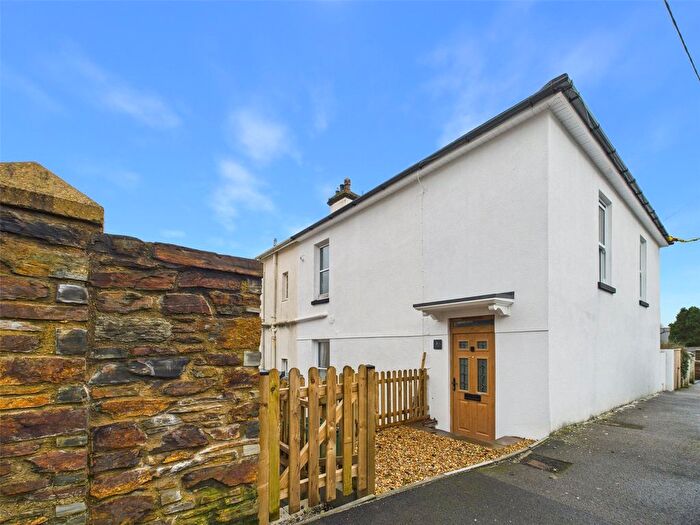
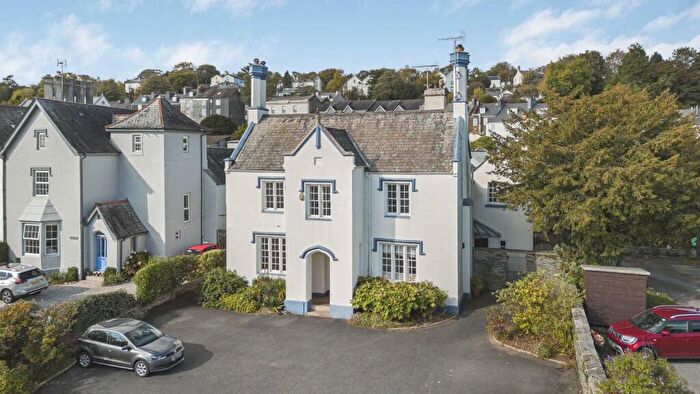
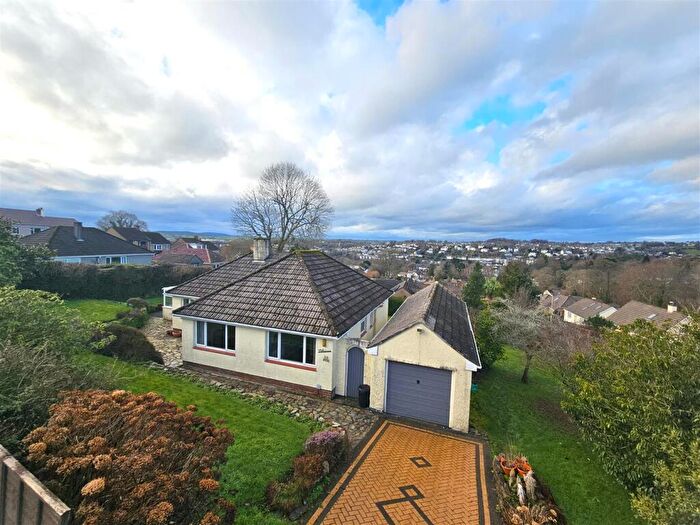
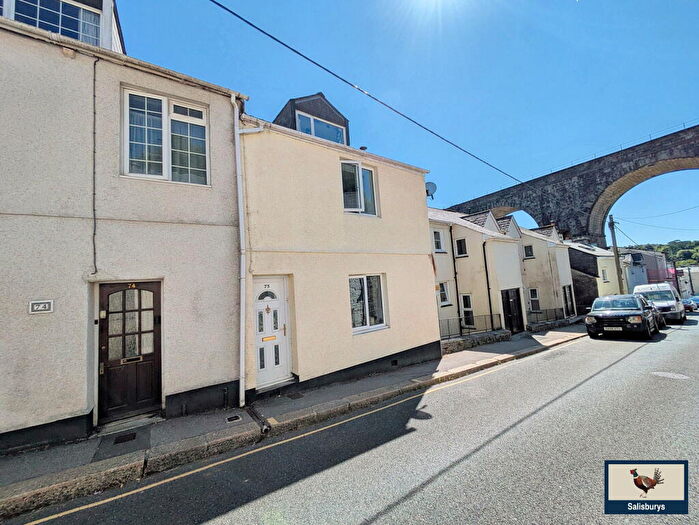
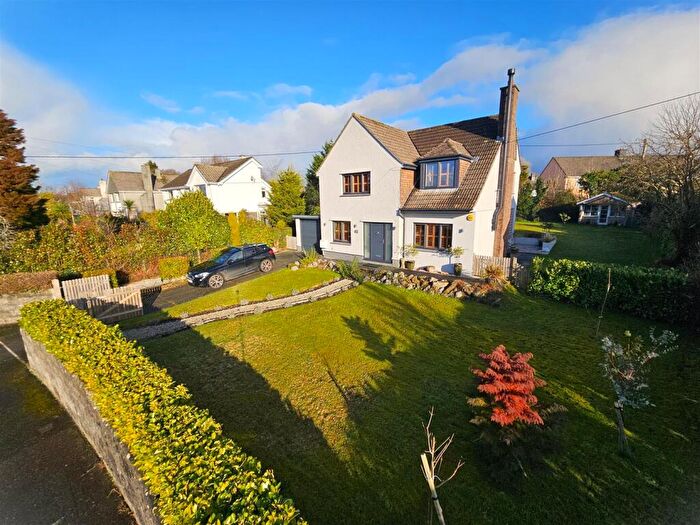
Houses for sale & to rent in Tavistock South, Tavistock
House Prices in Tavistock South
Properties in Tavistock South have an average house price of £372,721.00 and had 204 Property Transactions within the last 3 years¹.
Tavistock South is an area in Tavistock, Devon with 1,793 households², where the most expensive property was sold for £1,387,500.00.
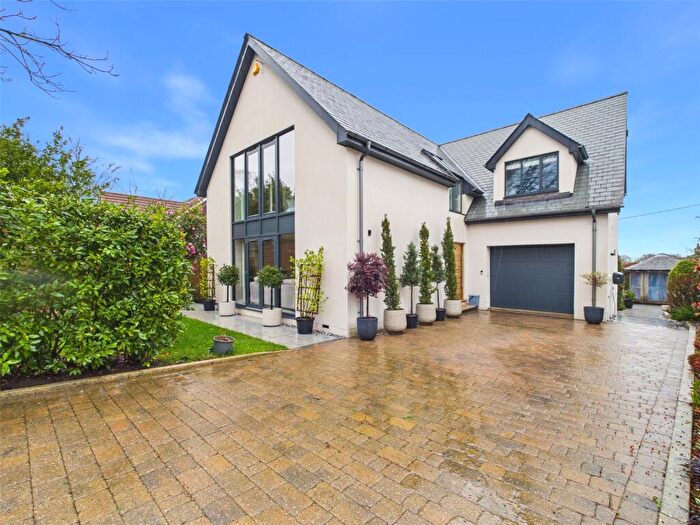
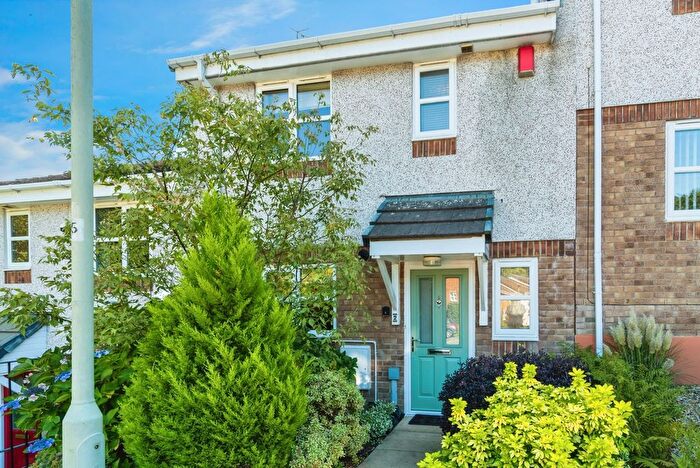
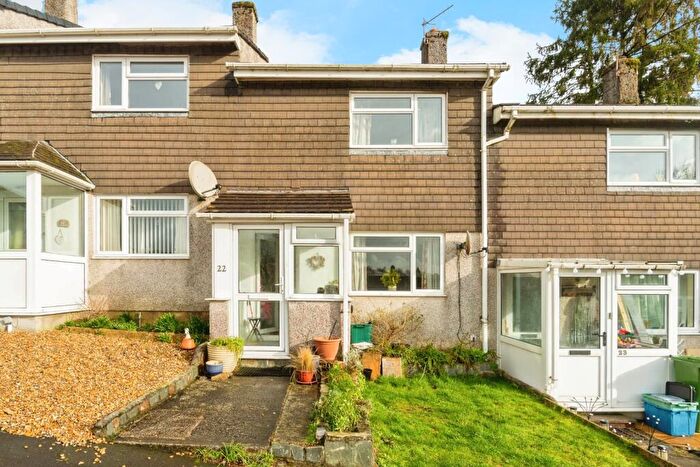
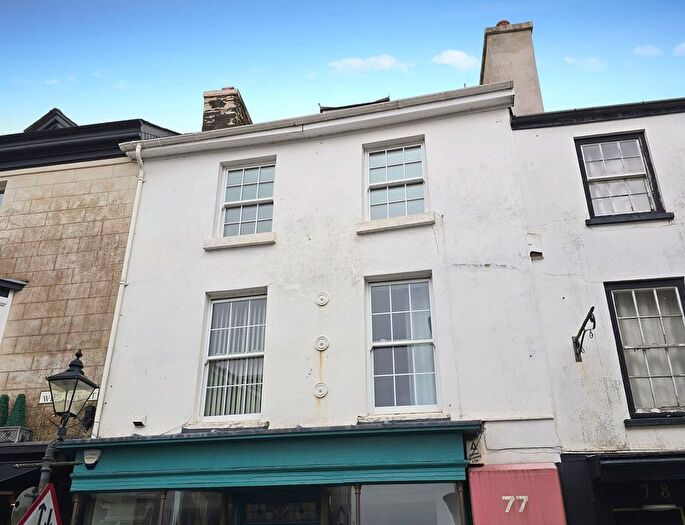
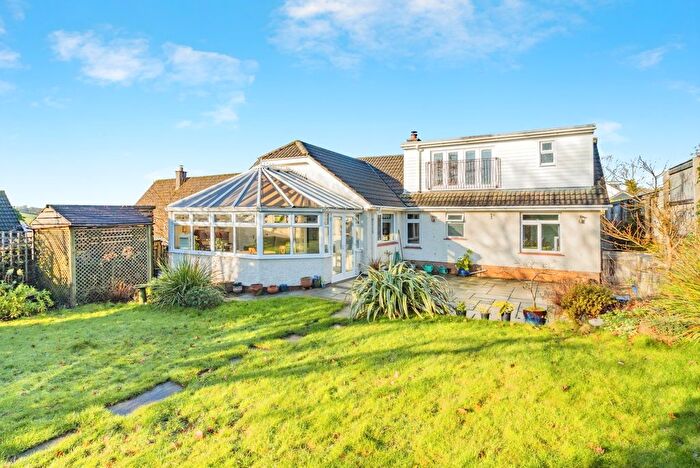
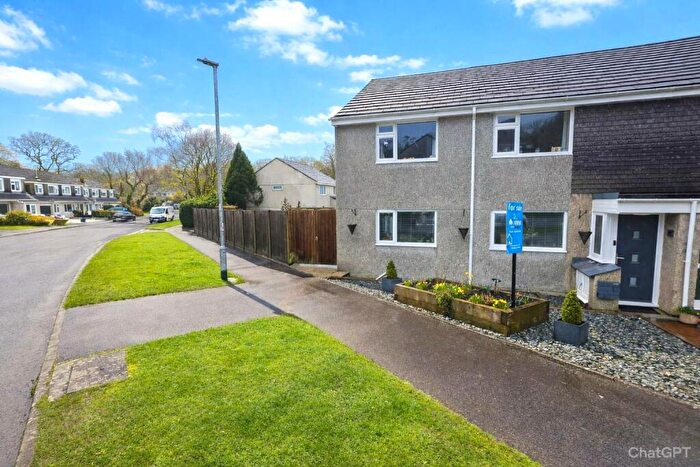
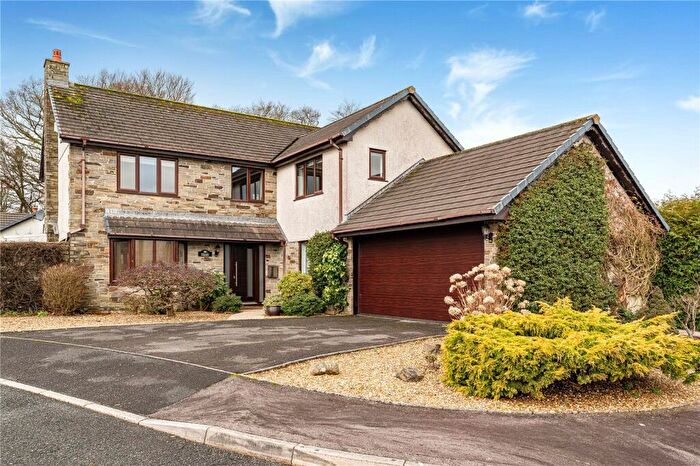
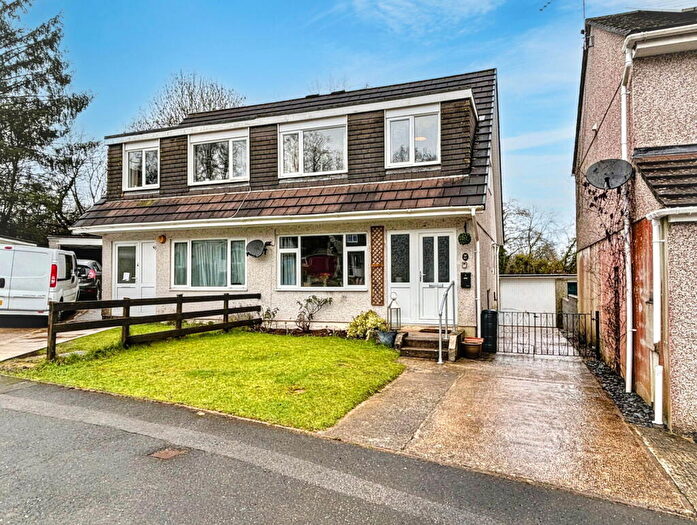
Properties for sale in Tavistock South
Roads and Postcodes in Tavistock South
Navigate through our locations to find the location of your next house in Tavistock South, Tavistock for sale or to rent.
| Streets | Postcodes |
|---|---|
| Abbey Rise | PL19 9FD |
| Arimoor Gardens | PL19 9HN |
| Battery Lane | PL19 9BH |
| Bluebell Way | PL19 9SA |
| Campion Rise | PL19 9PU |
| Chaucer Road | PL19 9AJ |
| Chollacott Close | PL19 9BW |
| Chollacott Lane | PL19 9DD |
| Church Hill | PL19 9ED |
| Church Lea | PL19 9PS |
| Churchill Road | PL19 9BU |
| College Avenue | PL19 0HU |
| Cox Tor Road | PL19 9JG |
| Crelake Park | PL19 9AY |
| Crelake Villas | PL19 9AU |
| Deer Leap | PL19 9RD |
| Deer Park Close | PL19 9HE |
| Deer Park Crescent | PL19 9HH PL19 9HQ |
| Deer Park Lane | PL19 9HA PL19 9HB PL19 9HD |
| Deer Park Road | PL19 9HF PL19 9HG |
| Dolvin Road | PL19 9EA |
| Down Road | PL19 9AD PL19 9AE PL19 9AF PL19 9AG PL19 9AQ |
| Downlea | PL19 9AW |
| Drake Gardens | PL19 9AT |
| Fern Meadow | PL19 9PX |
| Friars Walk | PL19 9PT |
| Green Hill | PL19 9HL |
| Green Lane | PL19 9AN PL19 9FA PL19 9HP |
| Grove Park | PL19 9HJ |
| Heather Close | PL19 9QS |
| Lang Grove | PL19 9AH |
| Lyd Gardens | PL19 9HU |
| Marshall Close | PL19 9RB |
| Meavy Way | PL19 9HY |
| Milton Crescent | PL19 9AL |
| Mohuns Close | PL19 9BJ |
| Mohuns Park | PL19 9BL PL19 9BN |
| Mount Tavy Road | PL19 9JB PL19 9JE PL19 9JF PL19 9JL |
| Newtake Road | PL19 9BX |
| Oak Tree Lane | PL19 9DA |
| Parkwood Road | PL19 0HJ PL19 0RH |
| Pew Tor Close | PL19 9JQ |
| Pixon Lane | PL19 8DH |
| Plym Crescent | PL19 9HX |
| Primrose Gardens | PL19 9SB |
| Priory Close | PL19 9DG PL19 9DH PL19 9DJ |
| Priory Gardens | PL19 9NZ |
| River Court | PL19 0HL |
| Shelley Avenue | PL19 9AR |
| St Andrews Road | PL19 9BY |
| St Davids Road | PL19 9BT |
| St Johns | PL19 9RF |
| Stannary Bridge Road | PL19 0SB |
| Sunshine Terrace | PL19 0HT |
| Tamar Avenue | PL19 9HZ PL19 9JA |
| Tavy Road | PL19 9HR PL19 9HS |
| Tiddy Brook Road | PL19 9BZ |
| Violet Lane | PL19 9JD |
| Walkham Close | PL19 9HT |
| Warran Lane | PL19 9DB |
| Westbridge Industrial Estate | PL19 8DE |
| Westmoor Park | PL19 9AA PL19 9AB |
| Whitchurch Road | PL19 9BB PL19 9BD PL19 9BE PL19 9BG PL19 9BQ PL19 9DE PL19 9DF PL19 9DQ PL19 9EF PL19 9EG |
| Whitham Park | PL19 9BP |
| Yelverton Terrace | PL19 0HS |
| PL19 9DY PL19 9EL |
Transport near Tavistock South
- FAQ
- Price Paid By Year
- Property Type Price
Frequently asked questions about Tavistock South
What is the average price for a property for sale in Tavistock South?
The average price for a property for sale in Tavistock South is £372,721. This amount is 11% higher than the average price in Tavistock. There are 1,420 property listings for sale in Tavistock South.
What streets have the most expensive properties for sale in Tavistock South?
The streets with the most expensive properties for sale in Tavistock South are Chollacott Lane at an average of £853,750, Downlea at an average of £820,000 and Down Road at an average of £777,500.
What streets have the most affordable properties for sale in Tavistock South?
The streets with the most affordable properties for sale in Tavistock South are Meavy Way at an average of £83,250, River Court at an average of £149,750 and Parkwood Road at an average of £150,750.
Which train stations are available in or near Tavistock South?
Some of the train stations available in or near Tavistock South are Gunnislake, Calstock and Bere Alston.
Property Price Paid in Tavistock South by Year
The average sold property price by year was:
| Year | Average Sold Price | Price Change |
Sold Properties
|
|---|---|---|---|
| 2025 | £361,318 | 1% |
61 Properties |
| 2024 | £356,236 | -13% |
75 Properties |
| 2023 | £401,133 | 1% |
68 Properties |
| 2022 | £397,376 | 9% |
79 Properties |
| 2021 | £360,633 | 5% |
75 Properties |
| 2020 | £342,122 | 11% |
67 Properties |
| 2019 | £305,912 | -6% |
85 Properties |
| 2018 | £323,253 | 12% |
81 Properties |
| 2017 | £283,231 | -4% |
81 Properties |
| 2016 | £294,055 | 9% |
90 Properties |
| 2015 | £268,124 | 5% |
99 Properties |
| 2014 | £253,677 | -5% |
76 Properties |
| 2013 | £266,462 | 4% |
70 Properties |
| 2012 | £255,569 | 9% |
84 Properties |
| 2011 | £231,922 | -16% |
79 Properties |
| 2010 | £268,209 | -2% |
80 Properties |
| 2009 | £274,454 | 11% |
81 Properties |
| 2008 | £243,776 | -12% |
105 Properties |
| 2007 | £274,239 | 1% |
78 Properties |
| 2006 | £271,670 | -1% |
100 Properties |
| 2005 | £273,621 | 12% |
68 Properties |
| 2004 | £240,358 | 14% |
77 Properties |
| 2003 | £206,442 | 22% |
84 Properties |
| 2002 | £160,663 | 13% |
88 Properties |
| 2001 | £139,718 | 17% |
95 Properties |
| 2000 | £116,596 | 13% |
93 Properties |
| 1999 | £101,427 | 10% |
140 Properties |
| 1998 | £91,717 | 3% |
79 Properties |
| 1997 | £89,356 | 8% |
88 Properties |
| 1996 | £81,818 | 10% |
85 Properties |
| 1995 | £73,447 | - |
60 Properties |
Property Price per Property Type in Tavistock South
Here you can find historic sold price data in order to help with your property search.
The average Property Paid Price for specific property types in the last three years are:
| Property Type | Average Sold Price | Sold Properties |
|---|---|---|
| Semi Detached House | £367,316.00 | 30 Semi Detached Houses |
| Detached House | £497,218.00 | 99 Detached Houses |
| Terraced House | £266,419.00 | 41 Terraced Houses |
| Flat | £143,175.00 | 34 Flats |

