
Houses for sale & to rent in TQ14 8EJ, Mulberry Street, Teignmouth East, Teignmouth
House Prices in TQ14 8EJ, Mulberry Street, Teignmouth East
Properties in TQ14 8EJ have an average house price of £218k and had 2 Property Transactions within the last 3 years.¹ TQ14 8EJ is a postcode in Mulberry Street located in Teignmouth East, an area in Teignmouth, Devon, with 5 households², where the most expensive property was sold for £245k.
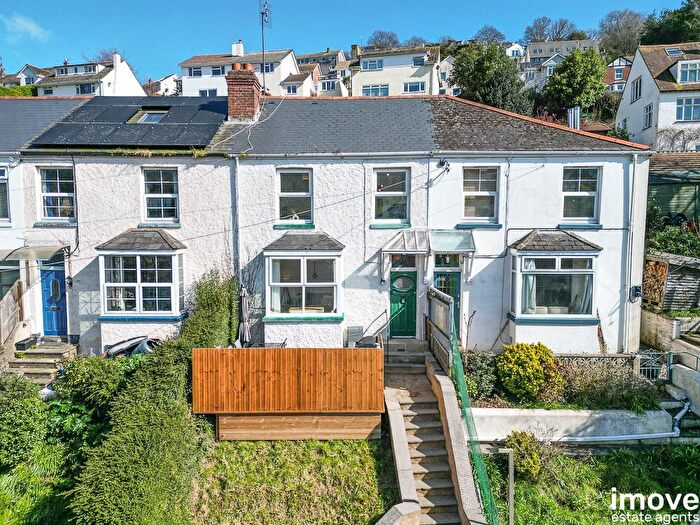
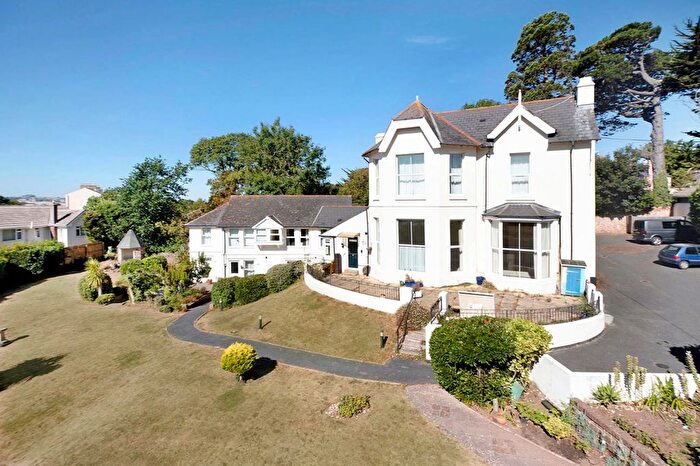
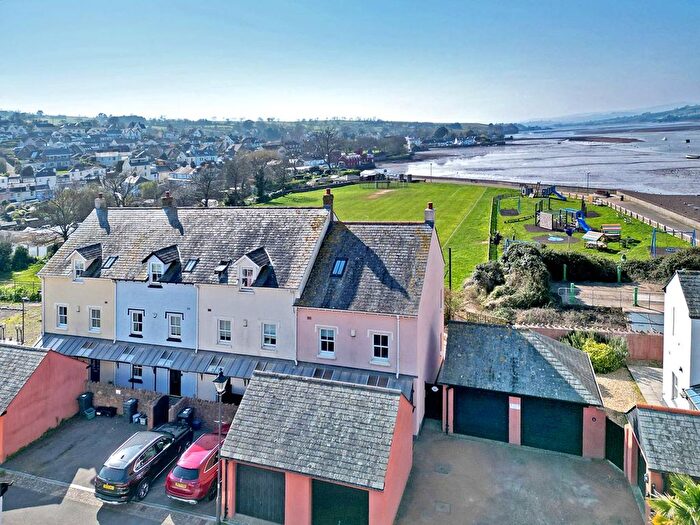
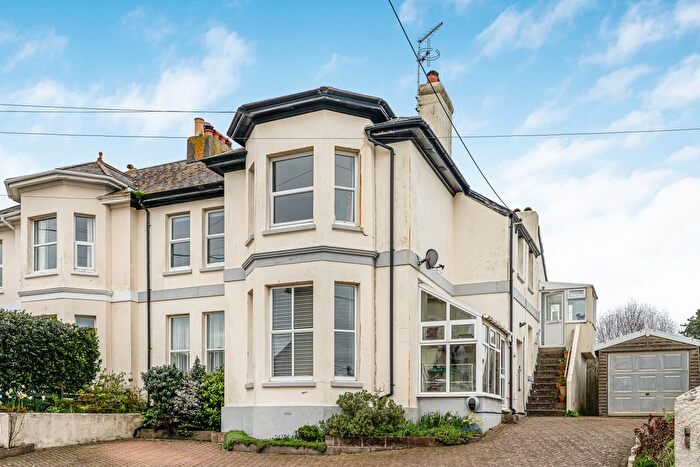
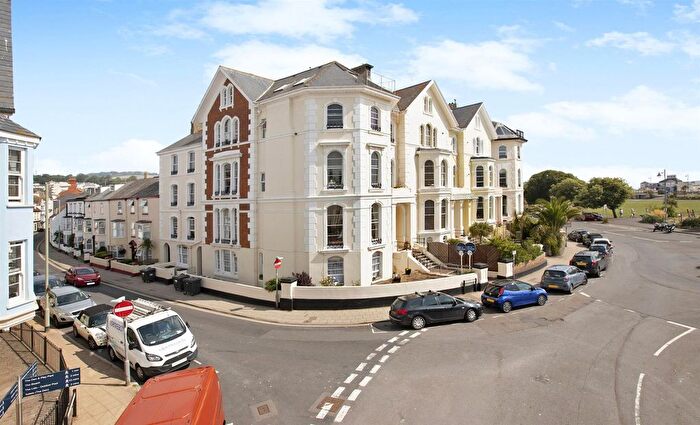
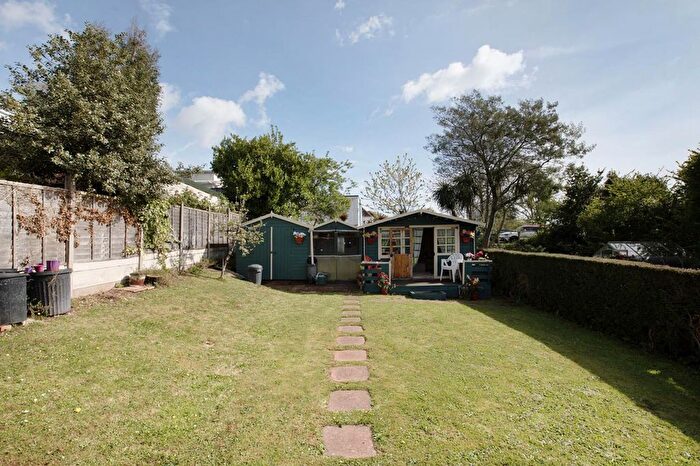
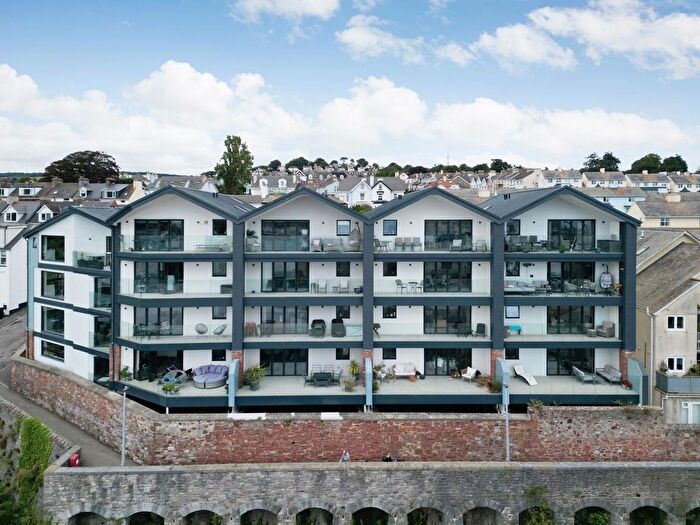
Properties for sale near TQ14 8EJ, Mulberry Street
![]()
If you are looking to sell your house, let it out, or receive a property valuation, an expert can help you.
Click the button below to get started.
Price Paid in Mulberry Street, TQ14 8EJ, Teignmouth East
6 Mulberry Street, TQ14 8EJ, Teignmouth East Teignmouth
Property 6 has been sold 2 times. The last time it was sold was in 01/12/2023 and the sold price was £190,000.00.
This semi detached house, sold as a freehold on 01/12/2023, is a 65 sqm mid-terrace house with an EPC rating of D.
| Date | Price | Property Type | Tenure | Classification |
|---|---|---|---|---|
| 01/12/2023 | £190,000.00 | Semi Detached House | freehold | Established Building |
| 04/03/2016 | £120,000.00 | Semi Detached House | freehold | Established Building |
7 Mulberry Street, TQ14 8EJ, Teignmouth East Teignmouth
Property 7 has been sold 1 time. The last time it was sold was in 02/11/2023 and the sold price was £245,000.00.
This semi detached house, sold as a freehold on 02/11/2023, is a 84 sqm mid-terrace house with an EPC rating of B.
| Date | Price | Property Type | Tenure | Classification |
|---|---|---|---|---|
| 02/11/2023 | £245,000.00 | Semi Detached House | freehold | Established Building |
5 Mulberry Street, TQ14 8EJ, Teignmouth East Teignmouth
Property 5 has been sold 2 times. The last time it was sold was in 19/08/2022 and the sold price was £225,000.00.
This semi detached house, sold as a freehold on 19/08/2022, is a 62 sqm end-terrace house with an EPC rating of D.
| Date | Price | Property Type | Tenure | Classification |
|---|---|---|---|---|
| 19/08/2022 | £225,000.00 | Semi Detached House | freehold | Established Building |
| 23/12/2015 | £125,000.00 | Semi Detached House | freehold | Established Building |
CUSTOMS COTTAGE Mulberry Street, TQ14 8EJ, Teignmouth East Teignmouth
Property CUSTOMS COTTAGE has been sold 6 times. The last time it was sold was in 07/07/2022 and the sold price was £165,000.00.
This terraced house, sold as a freehold on 07/07/2022, is a 46 sqm semi-detached house with an EPC rating of E.
| Date | Price | Property Type | Tenure | Classification |
|---|---|---|---|---|
| 07/07/2022 | £165,000.00 | Terraced House | freehold | Established Building |
| 19/09/2014 | £124,950.00 | Terraced House | freehold | Established Building |
| 09/02/2007 | £122,000.00 | Terraced House | freehold | Established Building |
| 14/12/2001 | £58,000.00 | Terraced House | freehold | Established Building |
| 23/10/2000 | £45,000.00 | Terraced House | freehold | Established Building |
| 25/11/1998 | £29,750.00 | Terraced House | freehold | Established Building |
11 Mulberry Street, TQ14 8EJ, Teignmouth East Teignmouth
Property 11 has been sold 4 times. The last time it was sold was in 15/12/2021 and the sold price was £270,000.00.
This terraced house, sold as a freehold on 15/12/2021, is a 98 sqm semi-detached house with an EPC rating of D.
| Date | Price | Property Type | Tenure | Classification |
|---|---|---|---|---|
| 15/12/2021 | £270,000.00 | Terraced House | freehold | Established Building |
| 31/03/2015 | £199,500.00 | Terraced House | freehold | Established Building |
| 30/10/2009 | £140,000.00 | Terraced House | freehold | Established Building |
| 08/12/2006 | £145,000.00 | Terraced House | freehold | Established Building |
1A Mulberry Street, TQ14 8EJ, Teignmouth East Teignmouth
Property 1A has been sold 1 time. The last time it was sold was in 28/10/2021 and the sold price was £135,000.00.
This semi detached house, sold as a freehold on 28/10/2021, is a 77 sqm semi-detached house with an EPC rating of D.
| Date | Price | Property Type | Tenure | Classification |
|---|---|---|---|---|
| 28/10/2021 | £135,000.00 | Semi Detached House | freehold | Established Building |
8 Mulberry Street, TQ14 8EJ, Teignmouth East Teignmouth
Property 8 has been sold 2 times. The last time it was sold was in 20/10/2021 and the sold price was £110,000.00.
This other property, sold as a freehold on 20/10/2021, is a 78 sqm end-terrace house with an EPC rating of B.
| Date | Price | Property Type | Tenure | Classification |
|---|---|---|---|---|
| 20/10/2021 | £110,000.00 | Other Property | freehold | Established Building |
| 04/10/2017 | £27,000.00 | Other Property | freehold | Established Building |
1B Mulberry Street, TQ14 8EJ, Teignmouth East Teignmouth
Property 1B has been sold 1 time. The last time it was sold was in 13/08/2021 and the sold price was £130,000.00.
This semi detached house, sold as a freehold on 13/08/2021, is a 76 sqm semi-detached house with an EPC rating of D.
| Date | Price | Property Type | Tenure | Classification |
|---|---|---|---|---|
| 13/08/2021 | £130,000.00 | Semi Detached House | freehold | Established Building |
Transport near TQ14 8EJ, Mulberry Street

House price paid reports for TQ14 8EJ, Mulberry Street
Click on the buttons below to see price paid reports by year or property price:
- Price Paid By Year
- Property Type Price
Property Price Paid in TQ14 8EJ, Mulberry Street by Year
The average sold property price by year was:
| Year | Average Sold Price | Price Change |
Sold Properties
|
|---|---|---|---|
| 2023 | £217,500 | 10% |
2 Properties |
| 2022 | £195,000 | 9% |
2 Properties |
| 2021 | £178,333 | 33% |
3 Properties |
| 2016 | £120,000 | -35% |
1 Property |
| 2015 | £162,250 | 23% |
2 Properties |
| 2014 | £124,950 | -12% |
1 Property |
| 2009 | £140,000 | 13% |
1 Property |
| 2007 | £122,000 | -19% |
1 Property |
| 2006 | £145,000 | 60% |
1 Property |
| 2001 | £58,000 | 22% |
1 Property |
| 2000 | £45,000 | 34% |
1 Property |
| 1998 | £29,750 | - |
1 Property |
Property Price per Property Type in TQ14 8EJ, Mulberry Street
Here you can find historic sold price data in order to help with your property search.
The average Property Paid Price for specific property types in the last three years are:
| Property Type | Average Sold Price | Sold Properties |
|---|---|---|
| Semi Detached House | £217,500.00 | 2 Semi Detached Houses |