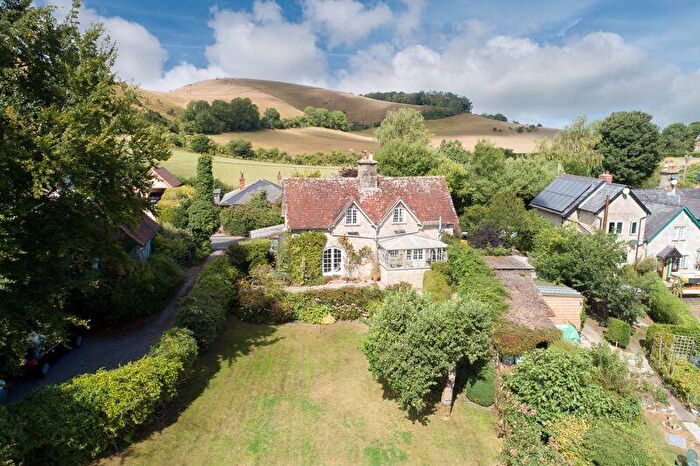
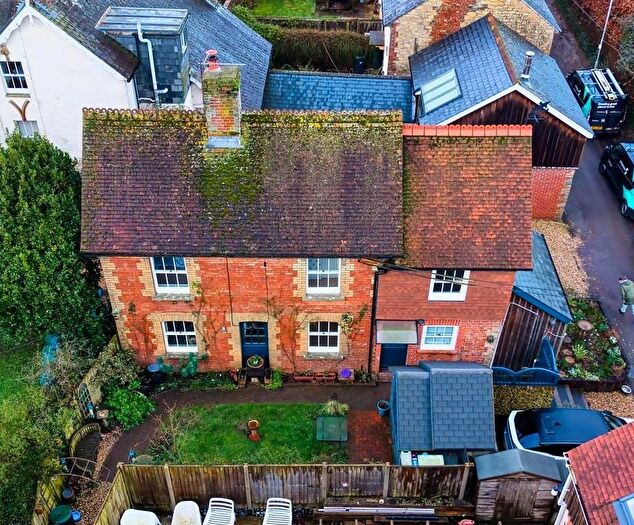
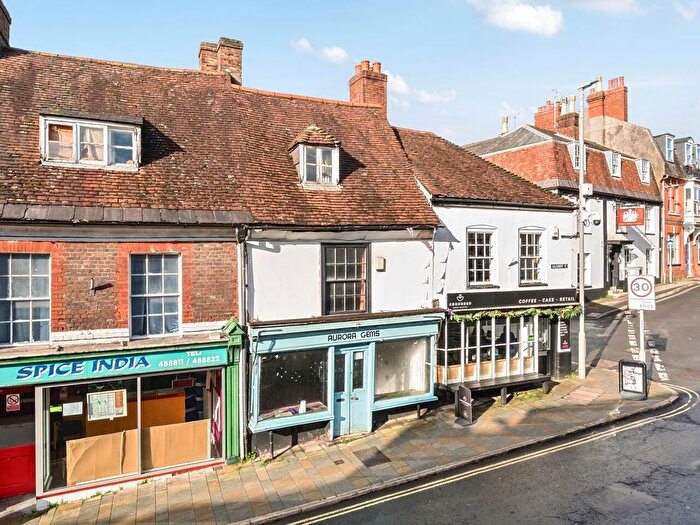
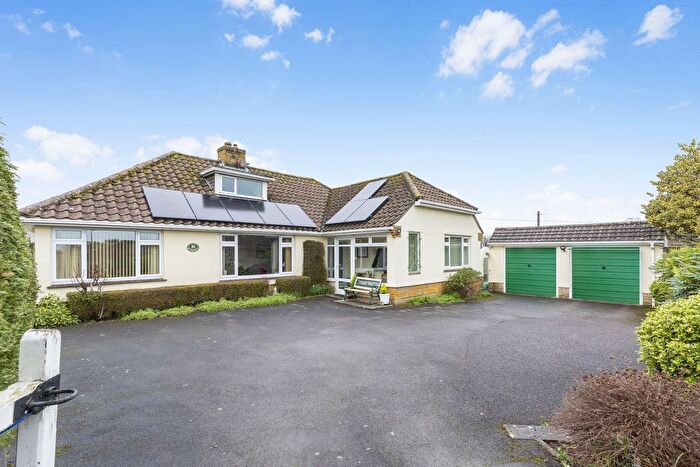
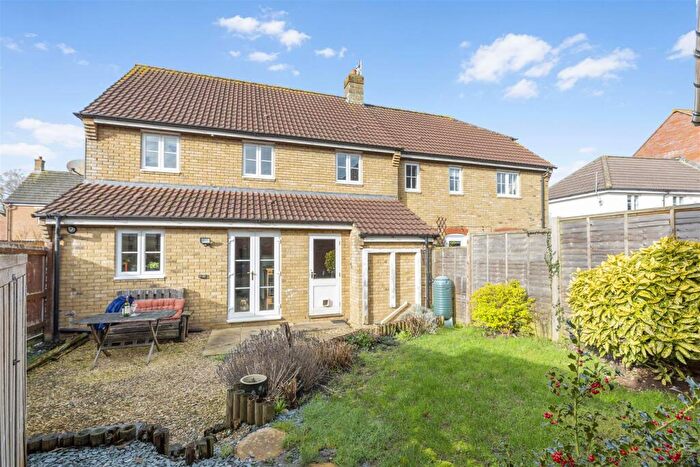
Houses for sale & to rent in Beacon, Blandford Forum
House Prices in Beacon
Properties in Beacon have an average house price of £751,072.00 and had 10 Property Transactions within the last 3 years¹.
Beacon is an area in Blandford Forum, Dorset with 146 households², where the most expensive property was sold for £1,310,000.00.
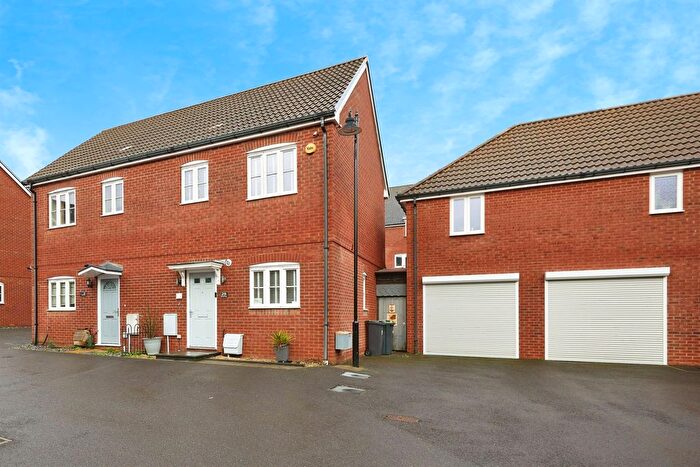
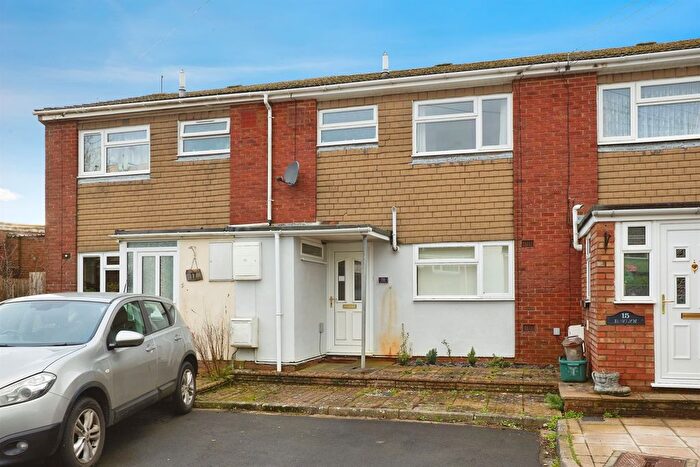
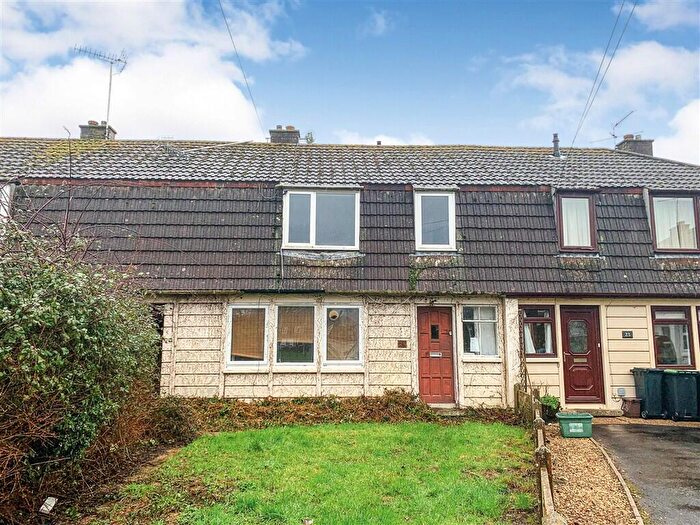
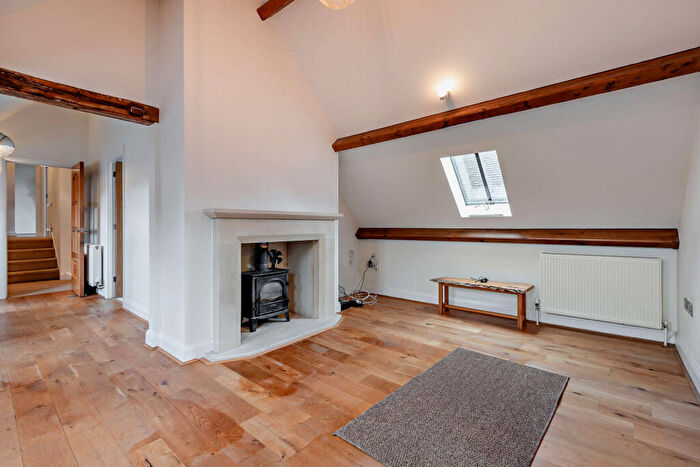
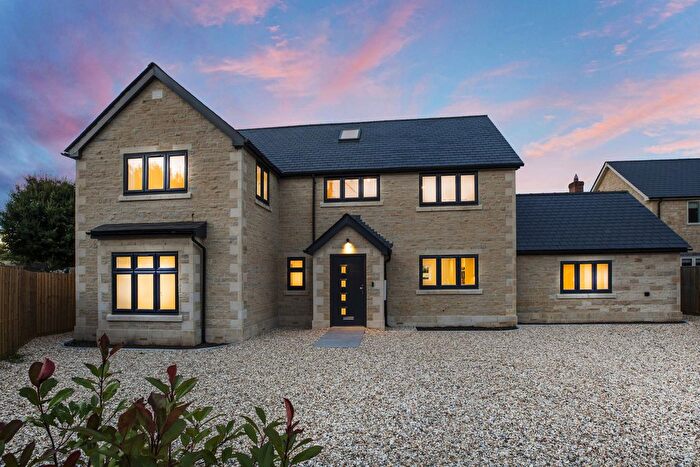
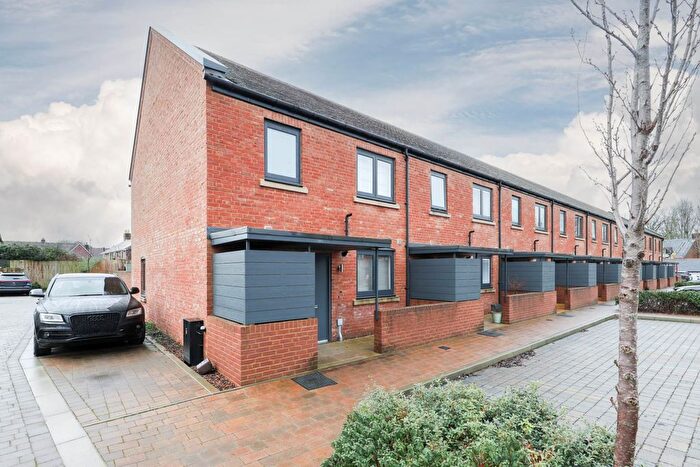
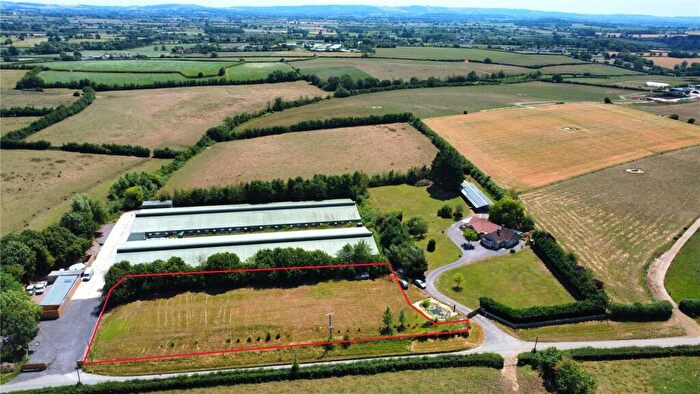
Properties for sale in Beacon
Roads and Postcodes in Beacon
Navigate through our locations to find the location of your next house in Beacon, Blandford Forum for sale or to rent.
| Streets | Postcodes |
|---|---|
| Green Lane | SP5 5AH SP7 0AE |
| Angel Lane | SP8 5LU |
| Blandford Road | DT11 8FP |
| Cann Common | SP7 0DG SP7 0DQ SP7 0EB SP7 0ED |
| Cherry Orchard | SP7 0AB |
| Church Hill | DT11 8LR |
| Church Lane | SP7 0LP |
| Church Walk | DT11 8LU |
| East Park | DT11 8LA |
| Elbury View | SP7 0QZ |
| Glebe Court | DT11 8PQ |
| Guys Marsh | SP7 0AH SP7 0BB |
| Hartgrove | SP7 0AT SP7 0AX |
| Hawkers Lane | SP8 5LZ |
| High Glebe | DT11 8ND |
| Higher Street | DT11 8LY |
| Margaret Marsh | SP7 0QA |
| Miles Field | DT11 8NT |
| North Street | SP7 0NP |
| Old School Lane | DT11 8WE |
| Pitts Lane | SP7 0BE SP7 0BX |
| Salisbury Road | SP7 8QB |
| Stour Row | SP7 0QB SP7 0QQ |
| The Street | DT11 8NU |
| West Lane | SP7 0EG |
| West Orchard | SP7 0LN |
| Woodbridge Lane | SP7 0BF |
| DT10 2BZ DT11 8FZ DT11 8LF DT11 8LG DT11 8LJ DT11 8LL DT11 8NL DT11 8NR DT11 8PG DT11 8PH DT11 8PT DT11 8PU DT11 8PZ DT11 8QR DT11 8RB DT11 8RF DT11 8TP SP5 5AB SP5 5AG SP5 5AL SP5 5AP SP5 5AR SP5 5AX SP7 0AF SP7 0BY SP7 0EE SP7 0JD SP7 0JN SP7 0NR SP7 0NX SP7 0PY SP8 5RS DT11 8FL |
Transport near Beacon
- FAQ
- Price Paid By Year
- Property Type Price
Frequently asked questions about Beacon
What is the average price for a property for sale in Beacon?
The average price for a property for sale in Beacon is £751,072. This amount is 99% higher than the average price in Blandford Forum. There are 5,164 property listings for sale in Beacon.
Which train stations are available in or near Beacon?
Some of the train stations available in or near Beacon are Gillingham (Dorset), Tisbury and Templecombe.
Property Price Paid in Beacon by Year
The average sold property price by year was:
| Year | Average Sold Price | Price Change |
Sold Properties
|
|---|---|---|---|
| 2025 | £537,623 | 9% |
3 Properties |
| 2024 | £489,069 | -126% |
3 Properties |
| 2023 | £1,107,661 | 74% |
4 Properties |
| 2022 | £291,666 | -81% |
3 Properties |
| 2021 | £528,100 | 2% |
5 Properties |
| 2020 | £520,000 | 60% |
2 Properties |
| 2018 | £208,000 | -429% |
1 Property |
| 2017 | £1,101,000 | 75% |
1 Property |
| 2016 | £280,500 | -21% |
2 Properties |
| 2015 | £340,000 | 6% |
3 Properties |
| 2014 | £318,000 | -1% |
1 Property |
| 2013 | £320,000 | -95% |
1 Property |
| 2005 | £625,000 | - |
1 Property |
Property Price per Property Type in Beacon
Here you can find historic sold price data in order to help with your property search.
The average Property Paid Price for specific property types in the last three years are:
| Property Type | Average Sold Price | Sold Properties |
|---|---|---|
| Detached House | £798,413.00 | 9 Detached Houses |
| Semi Detached House | £325,000.00 | 1 Semi Detached House |

