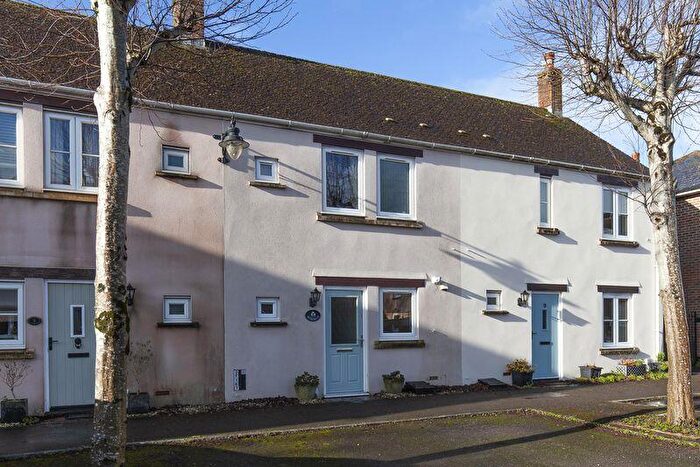
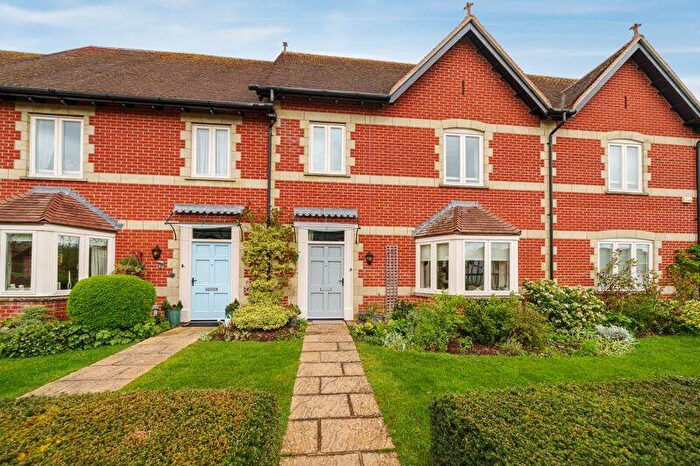
Houses for sale & to rent in The Beacon, Shaftesbury
House Prices in The Beacon
Properties in The Beacon have an average house price of £532,297.00 and had 59 Property Transactions within the last 3 years¹.
The Beacon is an area in Shaftesbury, Dorset with 694 households², where the most expensive property was sold for £1,655,337.00.
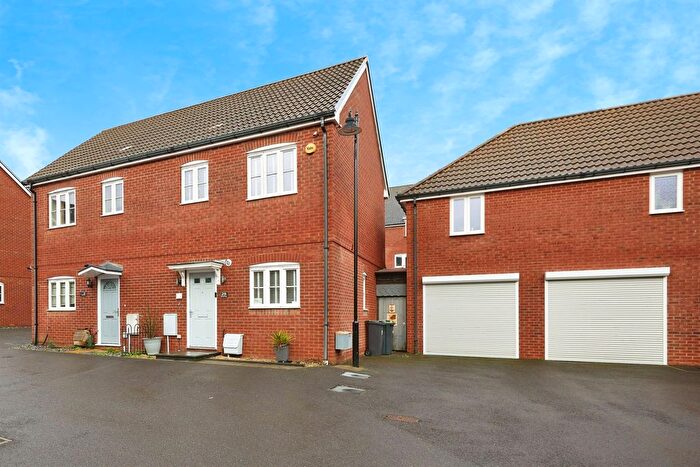
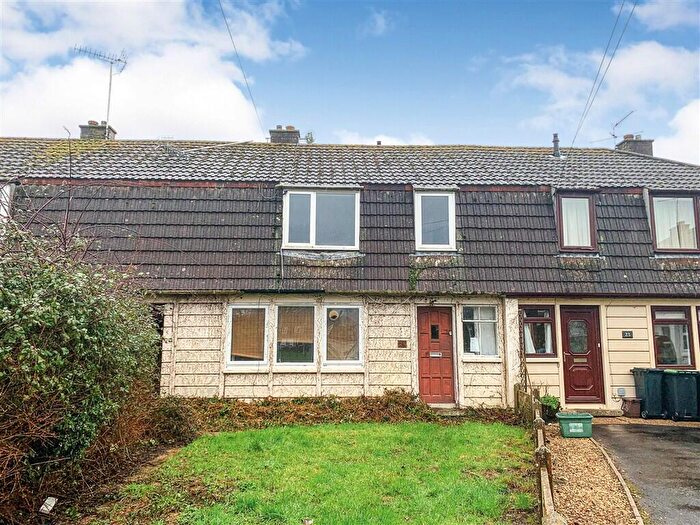
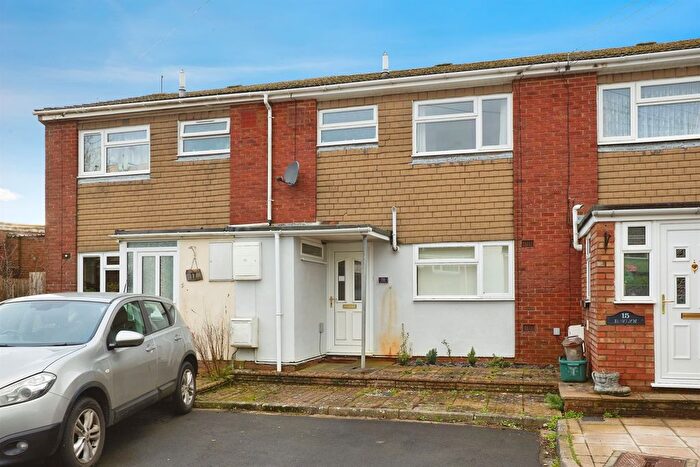
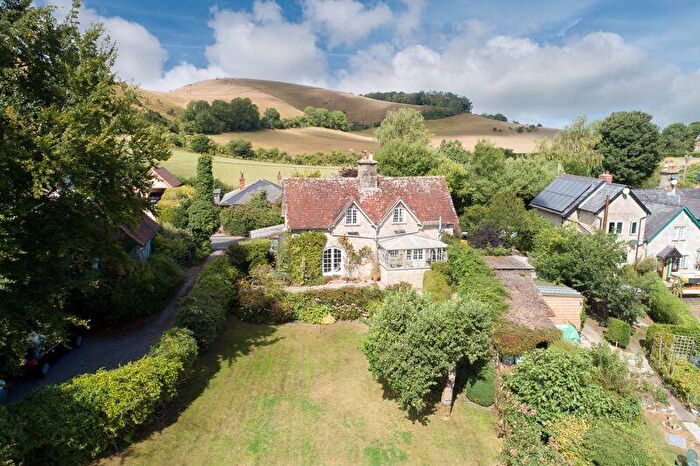
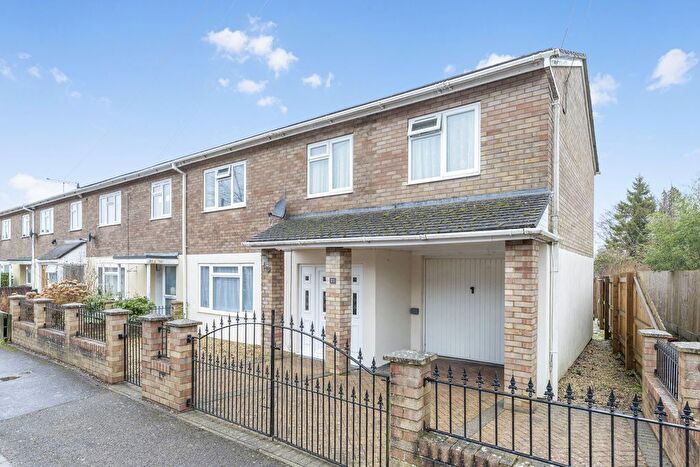
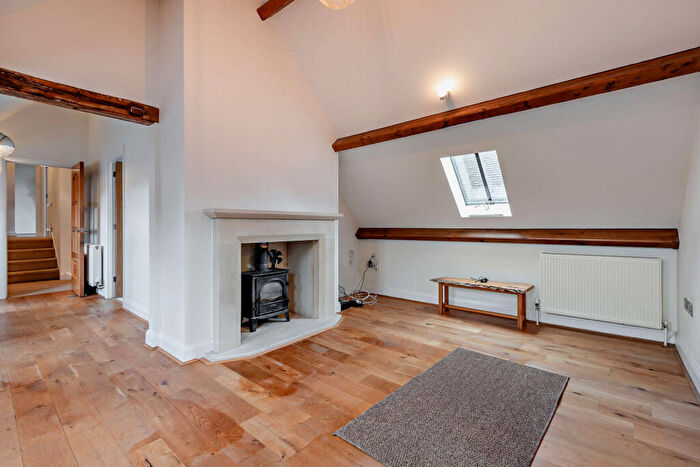
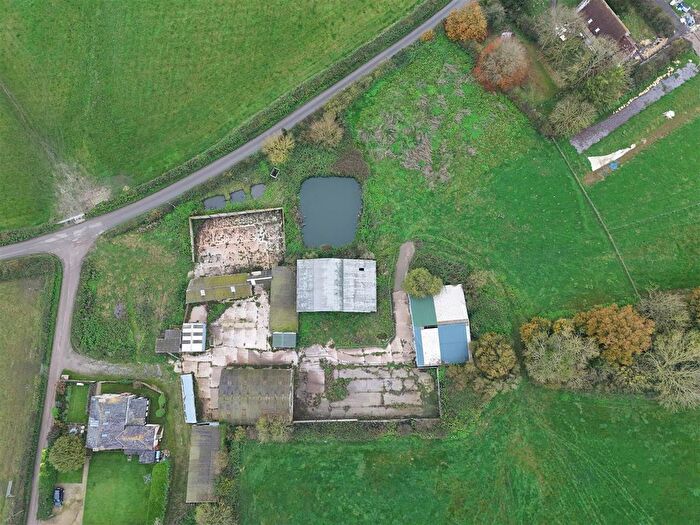
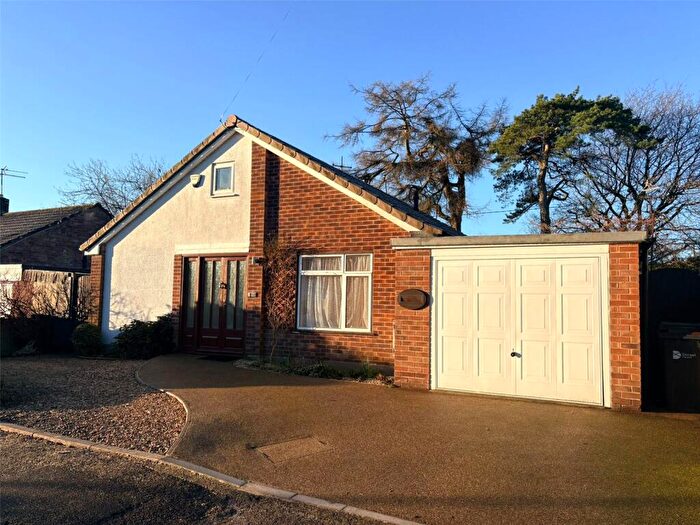
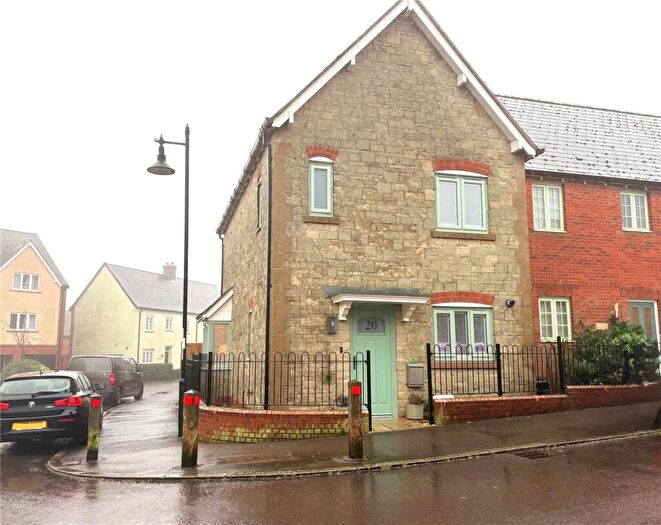
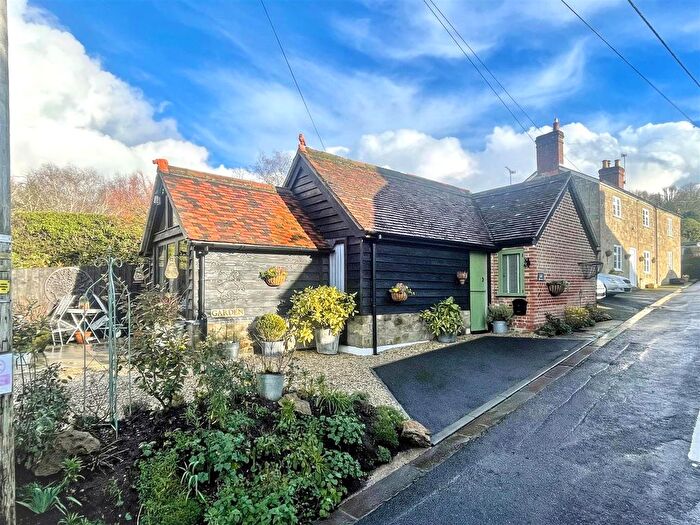
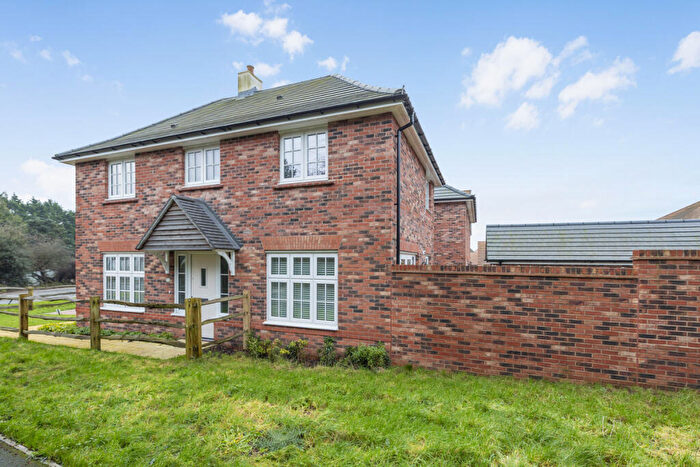
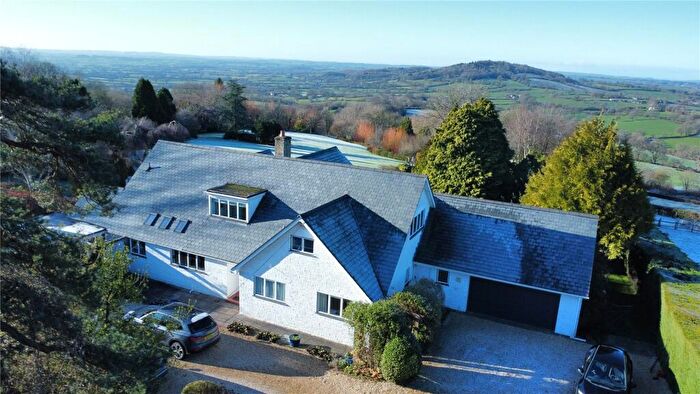
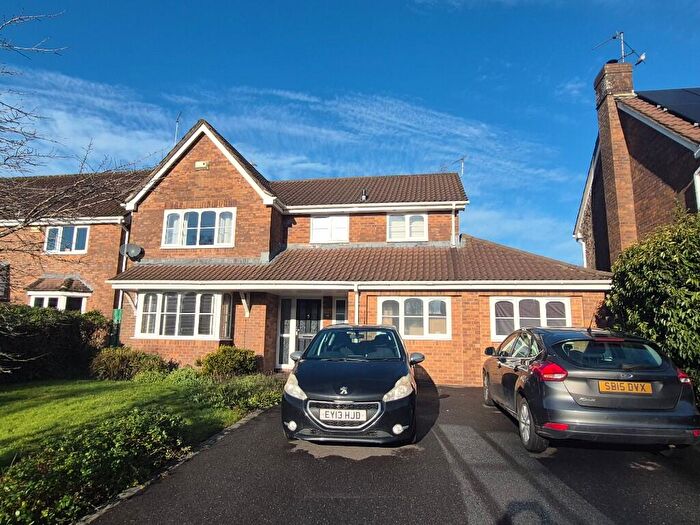
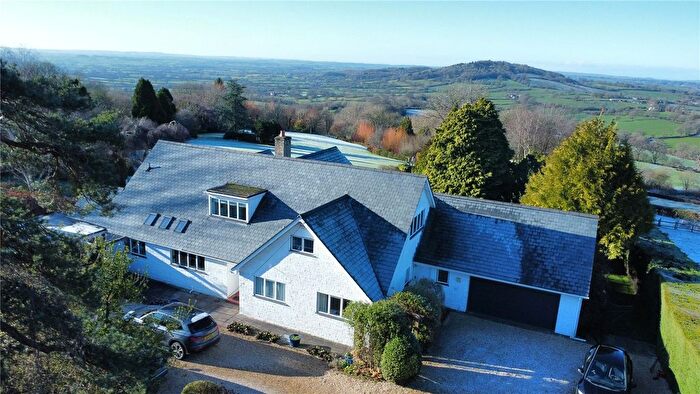
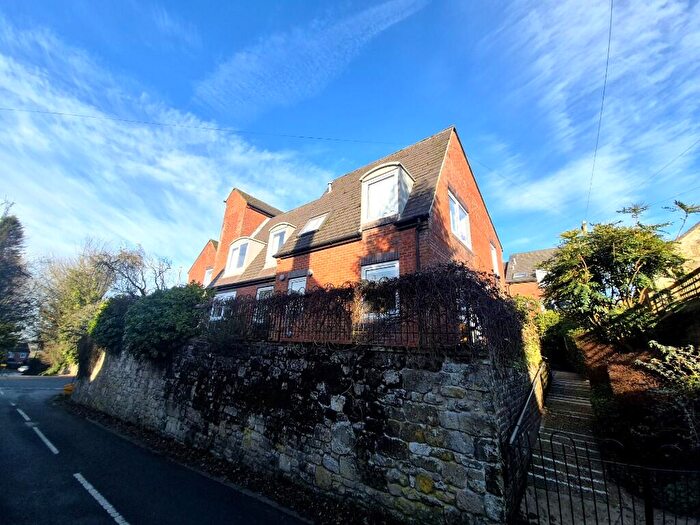
Properties for sale in The Beacon
Roads and Postcodes in The Beacon
Navigate through our locations to find the location of your next house in The Beacon, Shaftesbury for sale or to rent.
| Streets | Postcodes |
|---|---|
| Ash Tree Lane | SP7 0DN |
| Barnfield | SP7 0DH |
| Black Ven Cottages | SP7 0AR |
| Bleax Close | SP7 0AU |
| Bozley Hill | SP7 0BL SP7 0BN |
| Buddens Lane | SP7 0LY |
| Cann Bridge Cottages | SP7 0BP |
| Cann Common | SP7 0DF SP7 0DL |
| Cann Hill | SP7 0BS SP7 0BT |
| Cherry Orchard | SP7 0PX |
| Church Street | SP7 0NY |
| Collyers Rise | SP7 0PJ |
| Denham Drive | SP7 0AJ |
| Dinahs Hollow | SP7 0DE |
| Foots Hill | SP7 0BW |
| Foyle Hill | SP7 0AG SP7 0PT |
| French Mill Lane | SP7 0LU |
| Glyn Place | SP7 0DP |
| Gore Common | SP7 0PZ |
| Guys Marsh | SP7 0AQ |
| Hartgrove | SP7 0AS SP7 0JY SP7 0LA |
| Hawkcombe Lane | SP7 0JH SP7 0NN |
| Higher Barn Close | SP7 0DJ |
| Hillside | SP7 0BZ |
| Kit Hill | SP7 0AP |
| Little Frys | SP7 0AA |
| Long Lane | SP7 0BJ |
| Lower Blandford Road | SP7 0BG SP7 0BQ |
| Lurmer Street | SP7 0NT |
| Marshlands | SP7 0JS |
| Mill Street | SP7 0NU |
| Mowbray Cottages | SP7 0PU |
| North Street | SP7 0NS |
| Orchard Close | SP7 0PG |
| Parsonage Street | SP7 0PB |
| Penn Hill | SP7 0JR SP7 0JT |
| Pitts Lane | SP7 0BU |
| Prystock Cottages | SP7 0JL |
| Redmans Lane | SP7 0DB |
| Sandpit Lane | SP7 0NJ |
| School Lane | SP7 0DZ |
| South Street | SP7 0PD |
| St Andrews View | SP7 0QY |
| St Annes Close | SP7 0AN |
| St James | SP7 0JA |
| The Mead | SP7 0PH |
| Twin Town | SP7 0NG |
| West Street | SP7 0PF SP7 0PS |
| West View | SP7 0PQ |
| White Pit Lane | SP7 0DS SP7 0DT |
| Willow Cottages | SP7 0NF |
| SP7 0BH SP7 0DA SP7 0DR SP7 0DU SP7 0DW SP7 0DX SP7 0EA SP7 0EF SP7 0JE SP7 0JF SP7 0JG SP7 0JJ SP7 0JP SP7 0JQ SP7 0JU SP7 0JW SP7 0JX SP7 0LX SP7 0LZ SP7 0NB SP7 0ND SP7 0NH SP7 0NL SP7 0NQ SP7 0NW SP7 0PA |
Transport near The Beacon
- FAQ
- Price Paid By Year
- Property Type Price
Frequently asked questions about The Beacon
What is the average price for a property for sale in The Beacon?
The average price for a property for sale in The Beacon is £532,297. This amount is 54% higher than the average price in Shaftesbury. There are 1,755 property listings for sale in The Beacon.
What streets have the most expensive properties for sale in The Beacon?
The streets with the most expensive properties for sale in The Beacon are Penn Hill at an average of £872,500, Hartgrove at an average of £860,000 and White Pit Lane at an average of £840,000.
What streets have the most affordable properties for sale in The Beacon?
The streets with the most affordable properties for sale in The Beacon are Denham Drive at an average of £168,750, Foyle Hill at an average of £190,000 and Church Street at an average of £293,333.
Which train stations are available in or near The Beacon?
Some of the train stations available in or near The Beacon are Gillingham (Dorset), Tisbury and Templecombe.
Property Price Paid in The Beacon by Year
The average sold property price by year was:
| Year | Average Sold Price | Price Change |
Sold Properties
|
|---|---|---|---|
| 2025 | £434,186 | -44% |
20 Properties |
| 2024 | £625,017 | 13% |
19 Properties |
| 2023 | £542,325 | -37% |
20 Properties |
| 2022 | £743,593 | 46% |
31 Properties |
| 2021 | £399,332 | -13% |
24 Properties |
| 2020 | £451,298 | -3% |
26 Properties |
| 2019 | £463,615 | 6% |
13 Properties |
| 2018 | £435,195 | 5% |
23 Properties |
| 2017 | £412,440 | 1% |
21 Properties |
| 2016 | £408,875 | 16% |
32 Properties |
| 2015 | £344,727 | -16% |
24 Properties |
| 2014 | £399,598 | 10% |
28 Properties |
| 2013 | £357,964 | -2% |
14 Properties |
| 2012 | £364,125 | -36% |
16 Properties |
| 2011 | £496,870 | 35% |
12 Properties |
| 2010 | £323,900 | 9% |
30 Properties |
| 2009 | £293,239 | -28% |
23 Properties |
| 2008 | £374,281 | -1% |
16 Properties |
| 2007 | £377,038 | 21% |
36 Properties |
| 2006 | £297,050 | -19% |
29 Properties |
| 2005 | £353,333 | -1% |
27 Properties |
| 2004 | £356,250 | 39% |
22 Properties |
| 2003 | £216,872 | -17% |
24 Properties |
| 2002 | £253,383 | 21% |
34 Properties |
| 2001 | £201,320 | -3% |
39 Properties |
| 2000 | £206,591 | -3% |
38 Properties |
| 1999 | £211,989 | 24% |
46 Properties |
| 1998 | £161,688 | 22% |
39 Properties |
| 1997 | £125,534 | 16% |
39 Properties |
| 1996 | £106,014 | 1% |
31 Properties |
| 1995 | £104,804 | - |
23 Properties |
Property Price per Property Type in The Beacon
Here you can find historic sold price data in order to help with your property search.
The average Property Paid Price for specific property types in the last three years are:
| Property Type | Average Sold Price | Sold Properties |
|---|---|---|
| Semi Detached House | £370,343.00 | 16 Semi Detached Houses |
| Detached House | £634,475.00 | 38 Detached Houses |
| Terraced House | £274,000.00 | 5 Terraced Houses |

