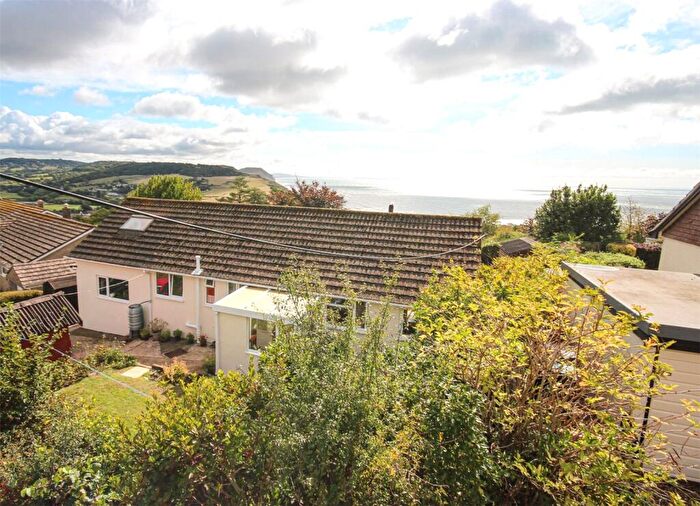
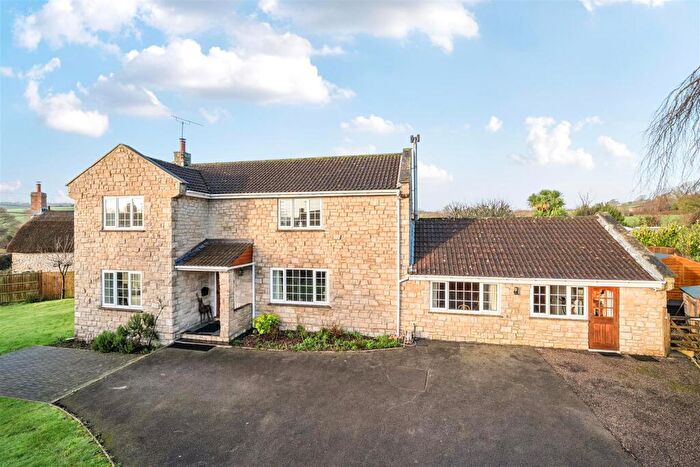
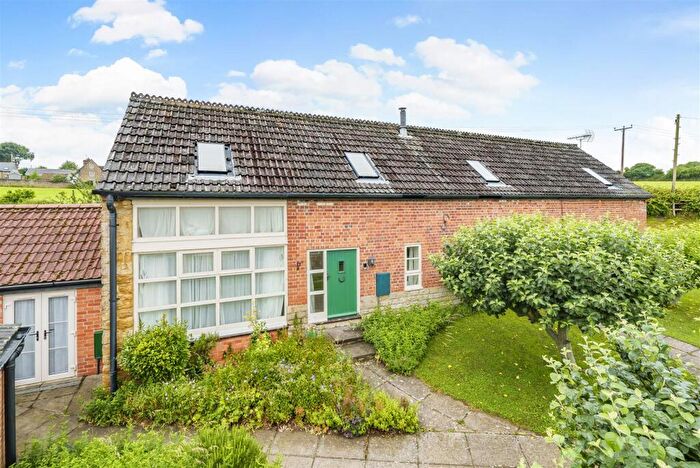
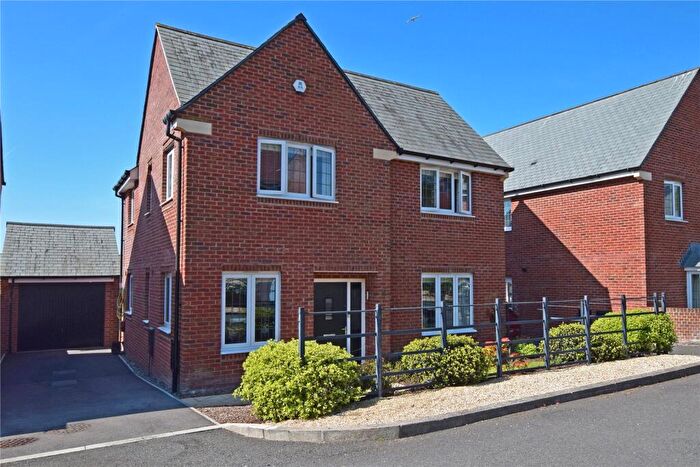
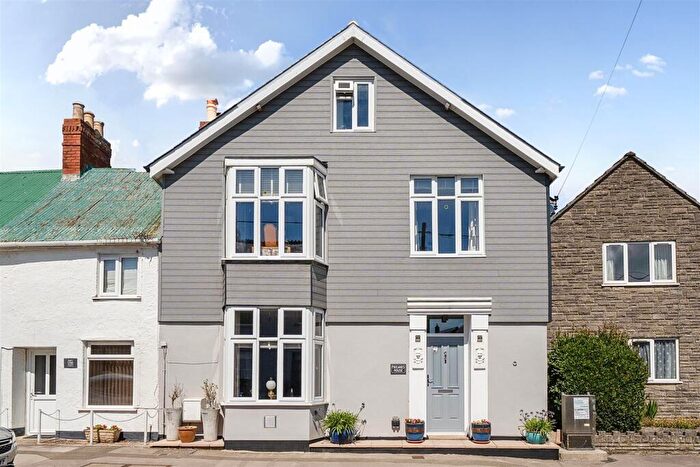
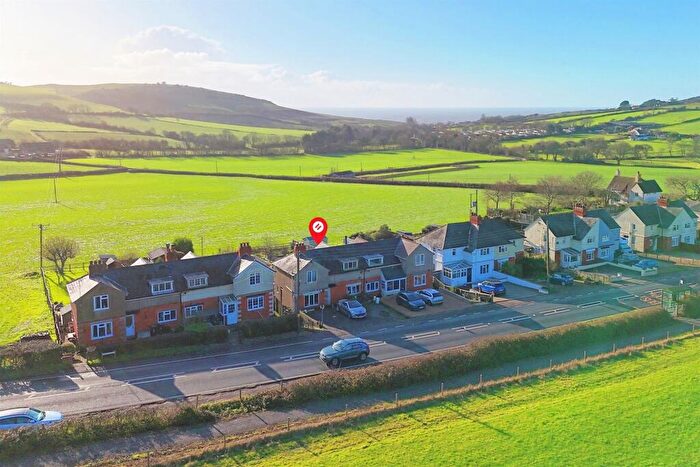
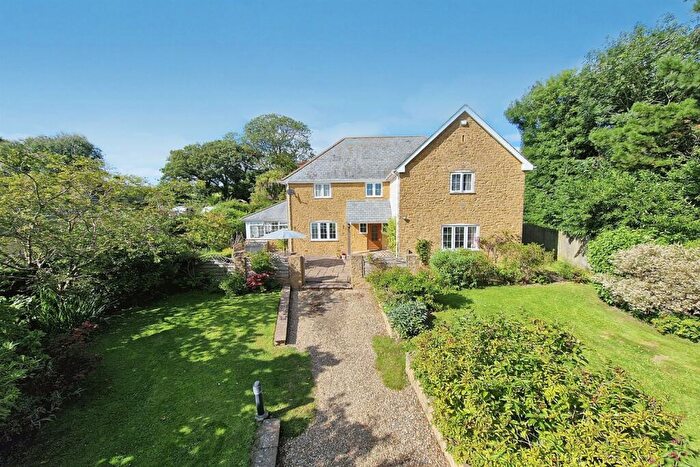
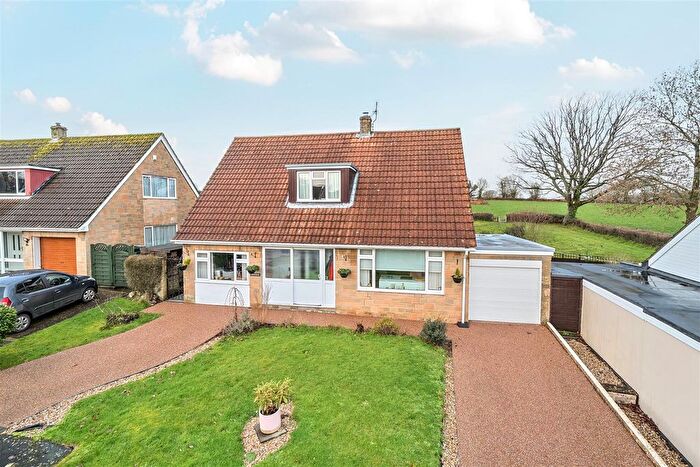
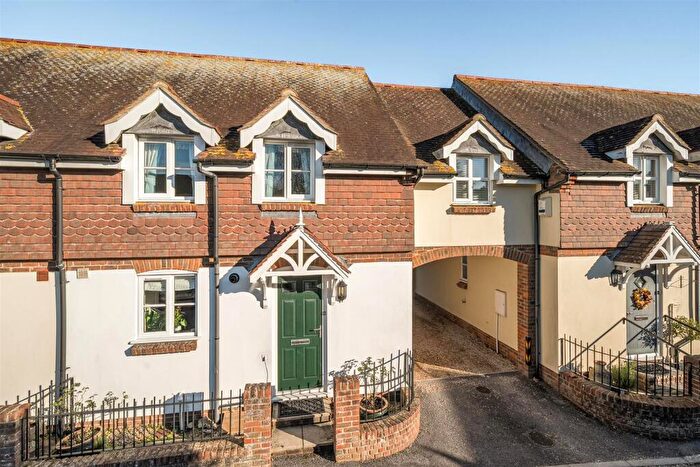
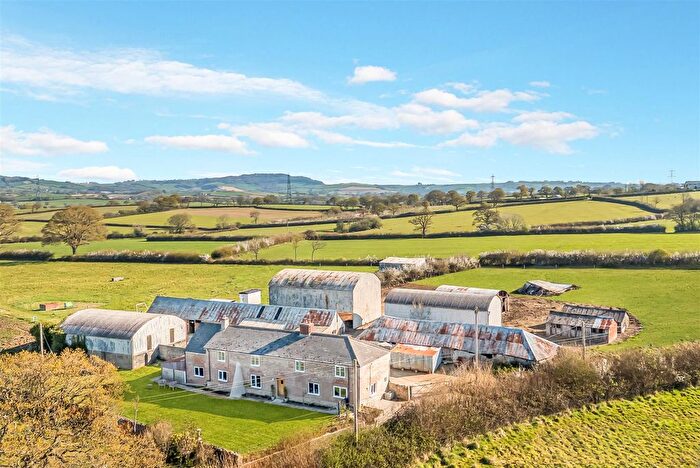
Houses for sale & to rent in Marshwood Vale, Bridport
House Prices in Marshwood Vale
Properties in Marshwood Vale have an average house price of £616,887.00 and had 31 Property Transactions within the last 3 years¹.
Marshwood Vale is an area in Bridport, Dorset with 494 households², where the most expensive property was sold for £1,150,000.00.
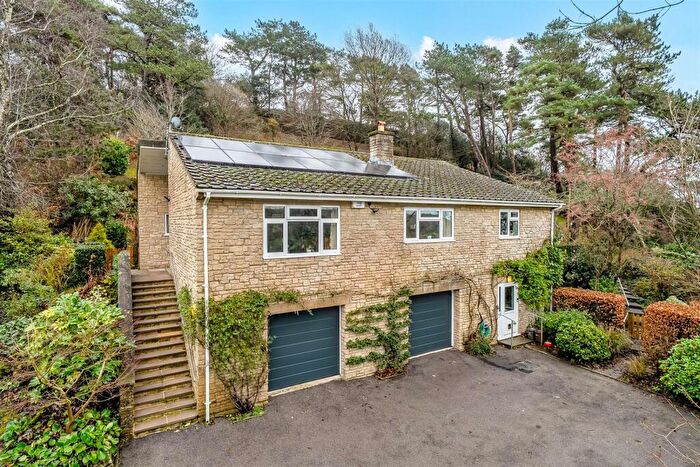
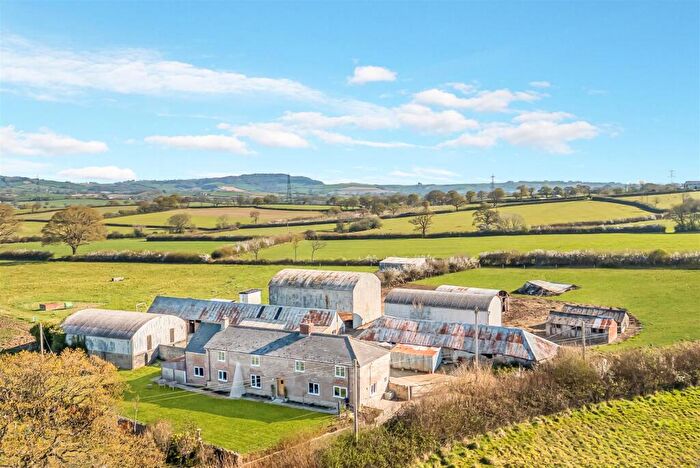
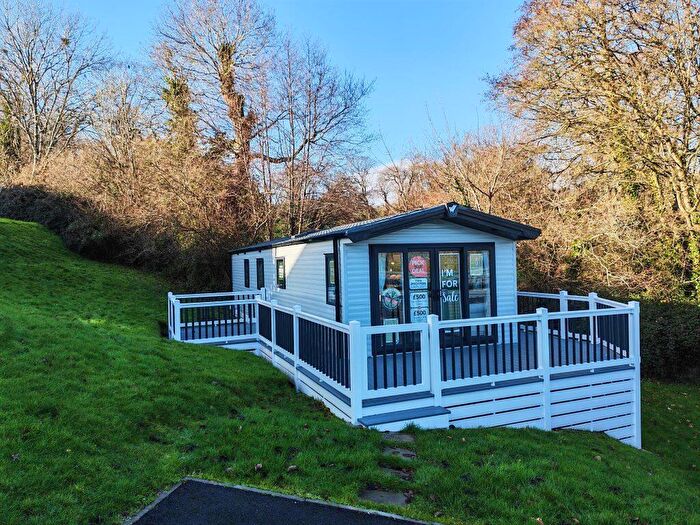
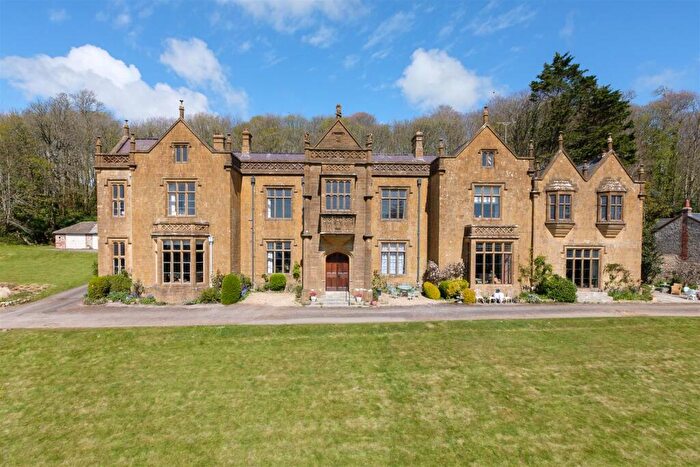
Properties for sale in Marshwood Vale
Roads and Postcodes in Marshwood Vale
Navigate through our locations to find the location of your next house in Marshwood Vale, Bridport for sale or to rent.
| Streets | Postcodes |
|---|---|
| Abbott's Wootton Lane | DT6 6NL |
| Bakers Cross | DT6 6NT DT6 6RF DT6 6RH |
| Berne Lane | DT6 6RE |
| Bluntshay Lane | DT6 6FB |
| Bramblehay | DT6 5FN |
| Carters Lane | DT6 6SF |
| Fishpond | DT6 6NR |
| Gibbs Lane | DT6 6DT |
| Hell Lane | DT6 6LA |
| Loves Lane | DT6 6DZ |
| Marshalsea | DT6 5QE |
| Pitmans Lane | DT6 6EB |
| Redbrick Cottages | DT6 6NJ |
| Ryall Road | DT6 6EG DT6 6EH |
| Seatown | DT6 6JX |
| Shave Cross | DT6 6HW |
| Sheepwash Green | DT6 6NP |
| Ship Knapp | DT6 6EW |
| Star Lane | DT6 6DN |
| Sun Lane | DT6 6DL |
| Taylors Lane | DT6 6ED |
| The Bakery | DT6 6ES |
| The Green | DT6 6EA DT6 6FD |
| Verriotts Lane | DT6 6DU DT6 6DX |
| Whitchurch Road | DT6 6EF |
| DT6 5NR DT6 5NT DT6 5NX DT6 5PA DT6 5PF DT6 5PZ DT6 5QA DT6 5QB DT6 5QD DT6 5QF DT6 5QJ DT6 5QL DT6 6DW DT6 6DY DT6 6EE DT6 6EJ DT6 6EL DT6 6EN DT6 6EQ DT6 6HP DT6 6NN DT6 6RD DT6 6RJ DT6 6RL DT6 6RQ DT6 5JW DT6 5NS DT6 5NU DT6 5NZ DT6 5PE DT6 5QH DT6 5QN DT6 5QQ DT6 6DE DT6 6DG DT6 6DQ DT6 6DS DT6 6HT DT6 6HZ DT6 6NB DT6 6ND DT6 6RB DT6 6RG DT6 6RN DT6 6RP DT6 6RW DT6 6SD |
Transport near Marshwood Vale
- FAQ
- Price Paid By Year
- Property Type Price
Frequently asked questions about Marshwood Vale
What is the average price for a property for sale in Marshwood Vale?
The average price for a property for sale in Marshwood Vale is £616,887. This amount is 46% higher than the average price in Bridport. There are 1,272 property listings for sale in Marshwood Vale.
What streets have the most expensive properties for sale in Marshwood Vale?
The streets with the most expensive properties for sale in Marshwood Vale are Ship Knapp at an average of £950,000, Bakers Cross at an average of £785,000 and Pitmans Lane at an average of £776,666.
What streets have the most affordable properties for sale in Marshwood Vale?
The streets with the most affordable properties for sale in Marshwood Vale are Marshalsea at an average of £350,000, Gibbs Lane at an average of £385,000 and Loves Lane at an average of £658,333.
Which train stations are available in or near Marshwood Vale?
Some of the train stations available in or near Marshwood Vale are Axminster, Crewkerne and Maiden Newton.
Property Price Paid in Marshwood Vale by Year
The average sold property price by year was:
| Year | Average Sold Price | Price Change |
Sold Properties
|
|---|---|---|---|
| 2025 | £564,444 | -29% |
9 Properties |
| 2024 | £730,583 | 28% |
12 Properties |
| 2023 | £527,650 | -30% |
10 Properties |
| 2022 | £684,993 | 26% |
15 Properties |
| 2021 | £504,880 | 8% |
21 Properties |
| 2020 | £466,895 | 18% |
18 Properties |
| 2019 | £385,117 | -5% |
17 Properties |
| 2018 | £403,344 | -27% |
14 Properties |
| 2017 | £512,795 | 14% |
22 Properties |
| 2016 | £442,388 | 9% |
18 Properties |
| 2015 | £403,527 | -19% |
20 Properties |
| 2014 | £478,745 | 29% |
12 Properties |
| 2013 | £340,000 | -13% |
7 Properties |
| 2012 | £384,750 | -3% |
8 Properties |
| 2011 | £396,583 | 18% |
18 Properties |
| 2010 | £323,466 | -24% |
15 Properties |
| 2009 | £400,589 | 6% |
14 Properties |
| 2008 | £375,500 | 9% |
13 Properties |
| 2007 | £342,076 | -7% |
12 Properties |
| 2006 | £364,469 | 18% |
24 Properties |
| 2005 | £297,093 | -7% |
16 Properties |
| 2004 | £316,694 | 13% |
17 Properties |
| 2003 | £276,808 | 23% |
17 Properties |
| 2002 | £212,819 | 3% |
23 Properties |
| 2001 | £207,354 | 31% |
21 Properties |
| 2000 | £143,371 | -9% |
16 Properties |
| 1999 | £155,770 | 6% |
22 Properties |
| 1998 | £146,432 | 17% |
23 Properties |
| 1997 | £121,361 | 4% |
13 Properties |
| 1996 | £116,483 | 7% |
28 Properties |
| 1995 | £107,757 | - |
14 Properties |
Property Price per Property Type in Marshwood Vale
Here you can find historic sold price data in order to help with your property search.
The average Property Paid Price for specific property types in the last three years are:
| Property Type | Average Sold Price | Sold Properties |
|---|---|---|
| Semi Detached House | £365,000.00 | 1 Semi Detached House |
| Detached House | £662,481.00 | 27 Detached Houses |
| Terraced House | £290,500.00 | 3 Terraced Houses |

