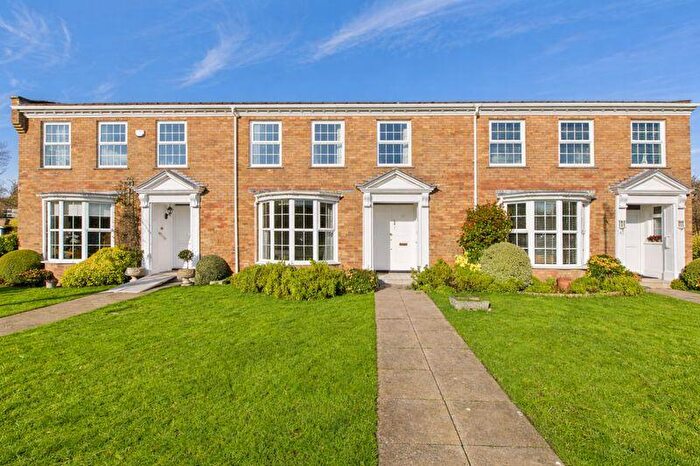
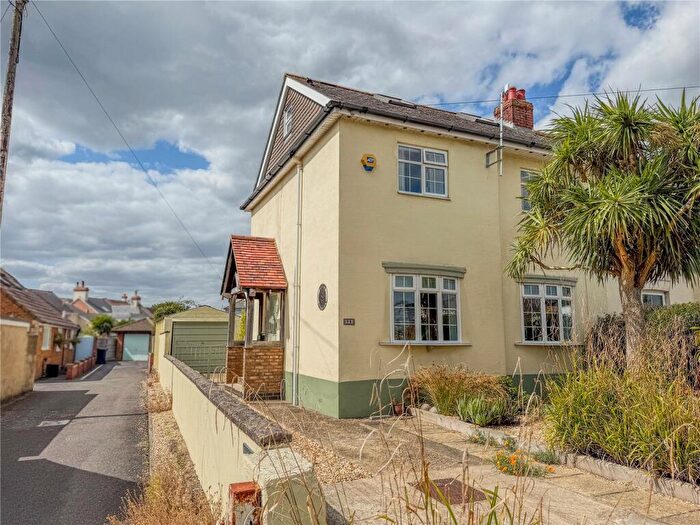
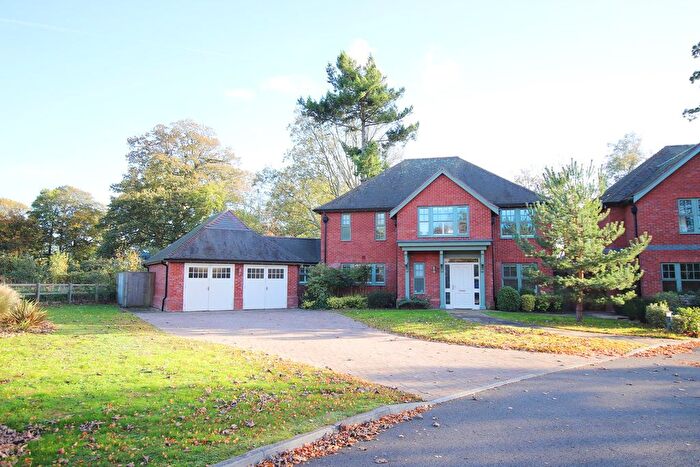
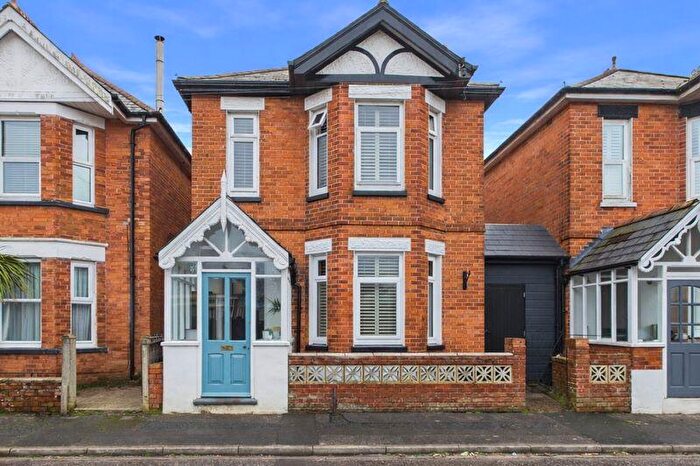
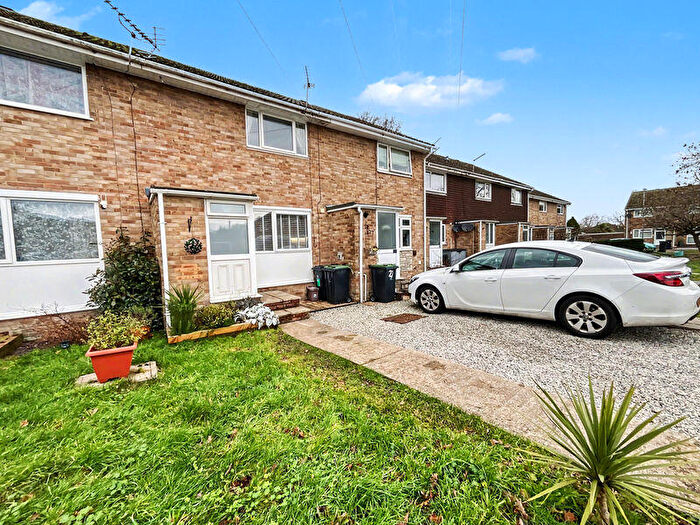
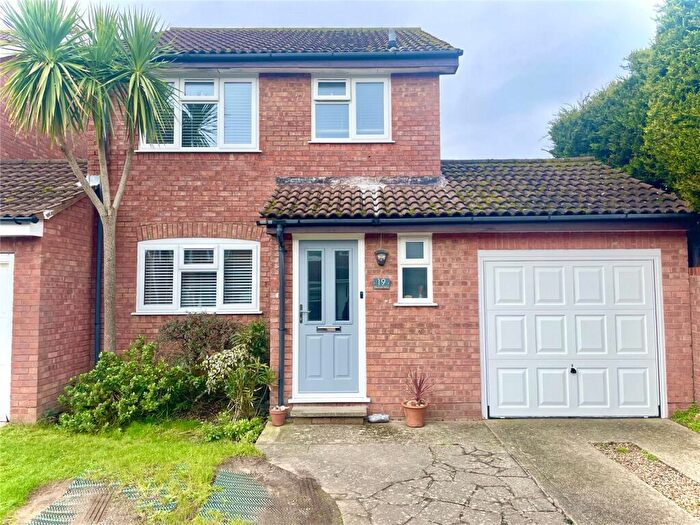
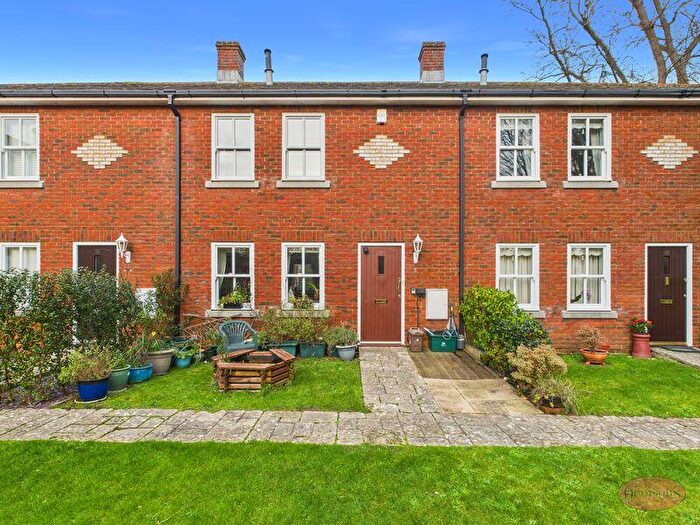
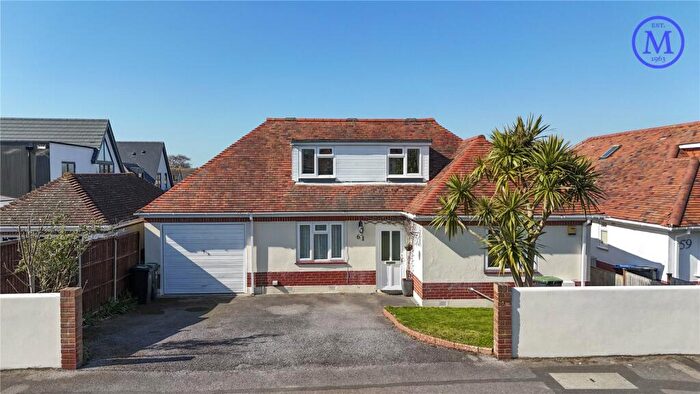
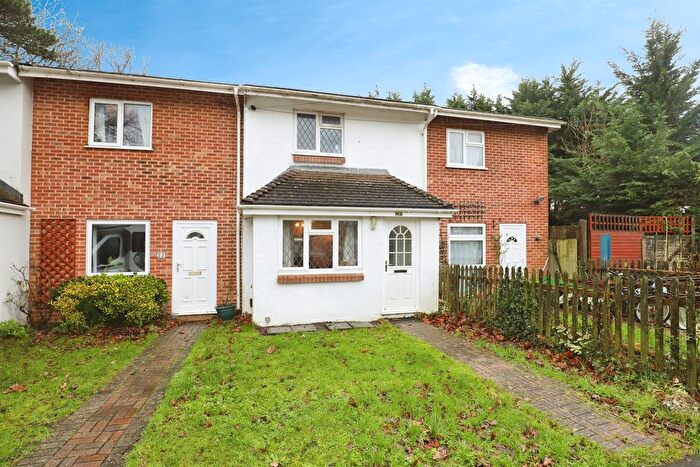
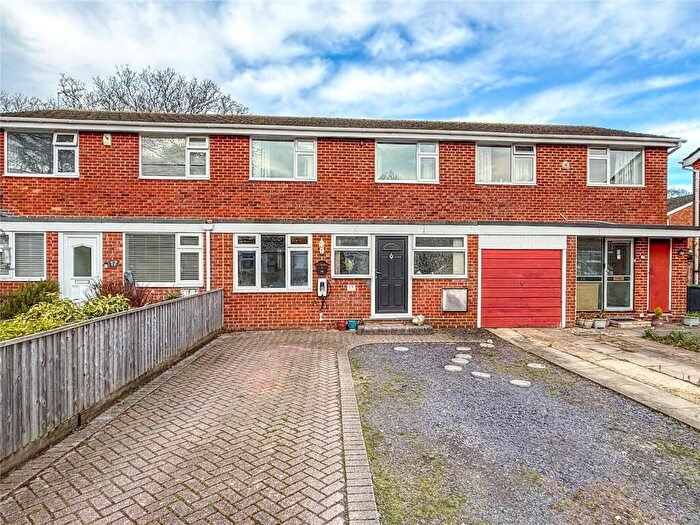
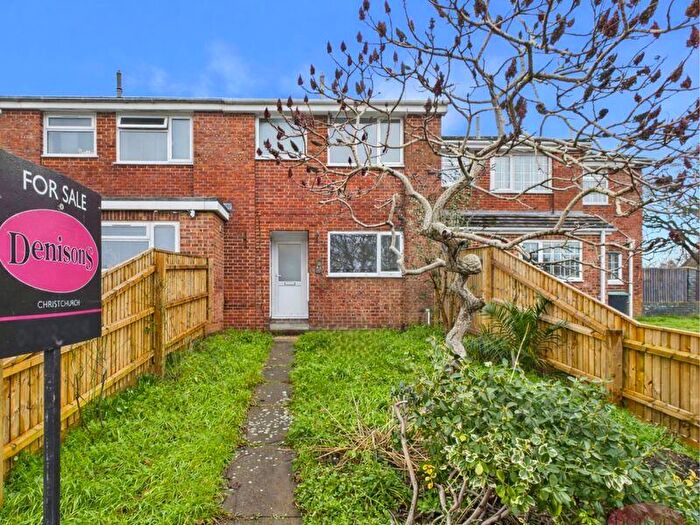
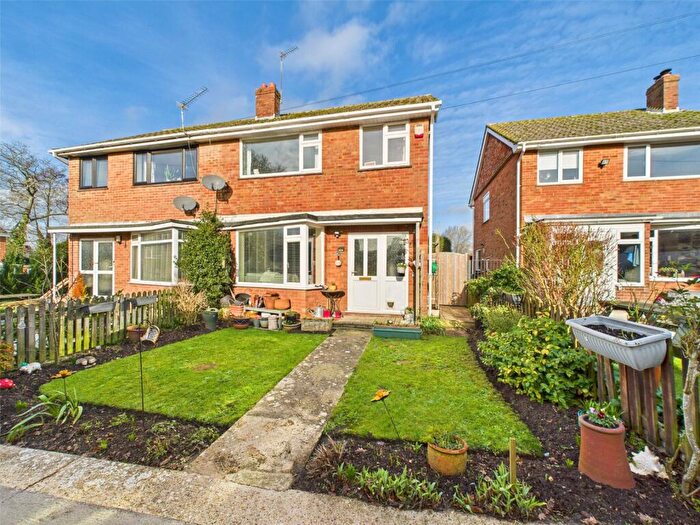
Houses for sale & to rent in Burton & Grange, Christchurch
House Prices in Burton & Grange
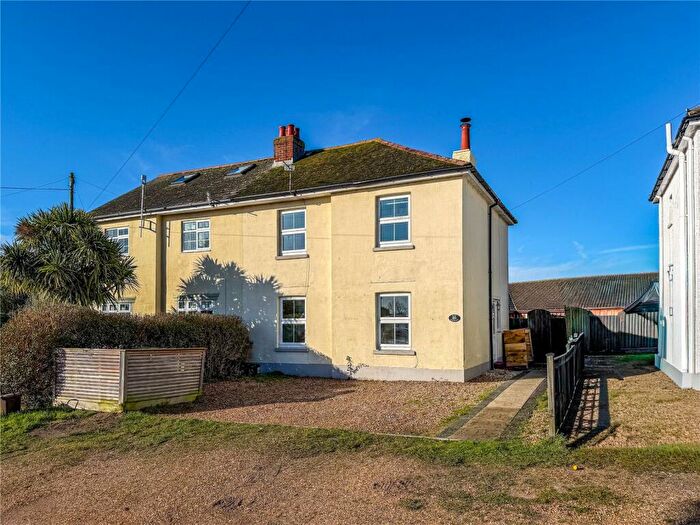
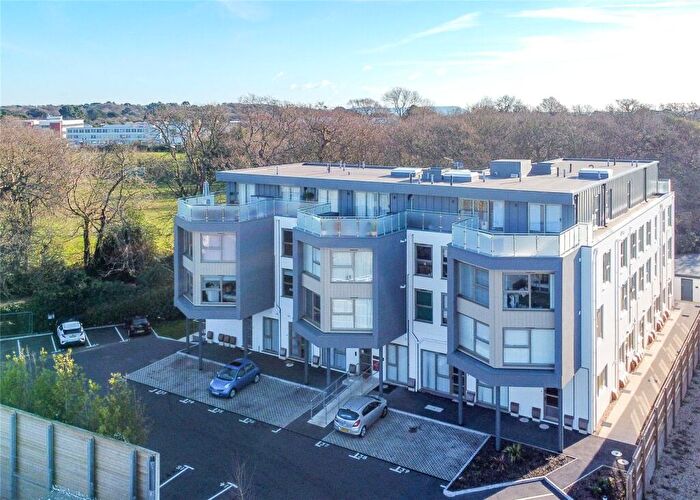
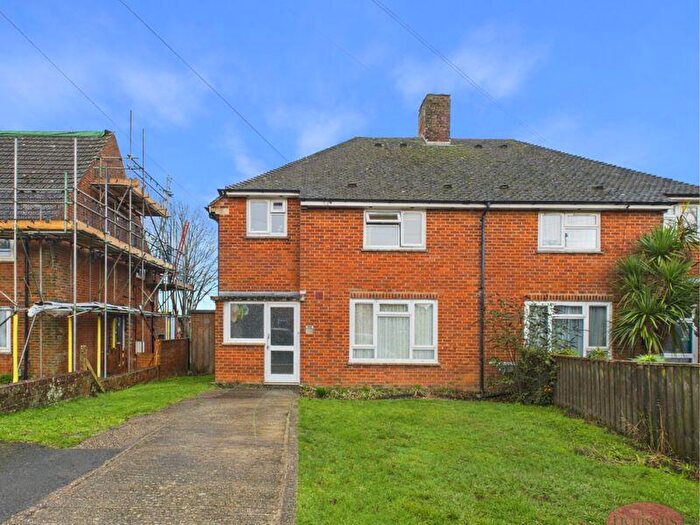
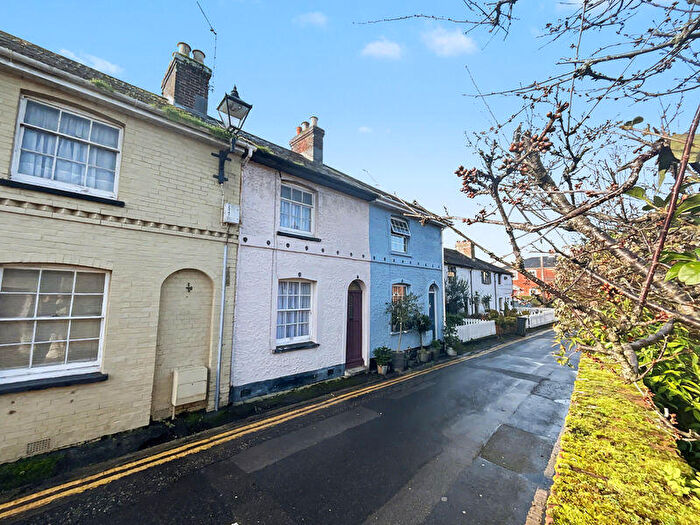
Properties in Burton & Grange have an average house price of £642,000.00 and had 5 Property Transactions within the last 3 years¹.
Burton & Grange is an area in Christchurch, Dorset with 178 households², where the most expensive property was sold for £1,140,000.00.
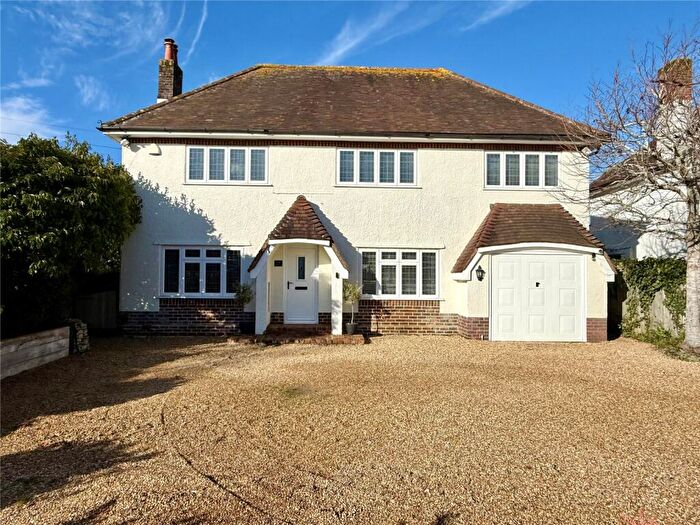
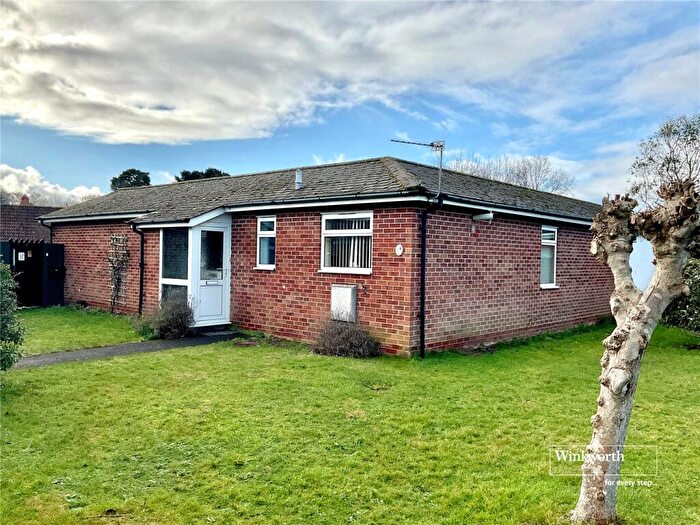
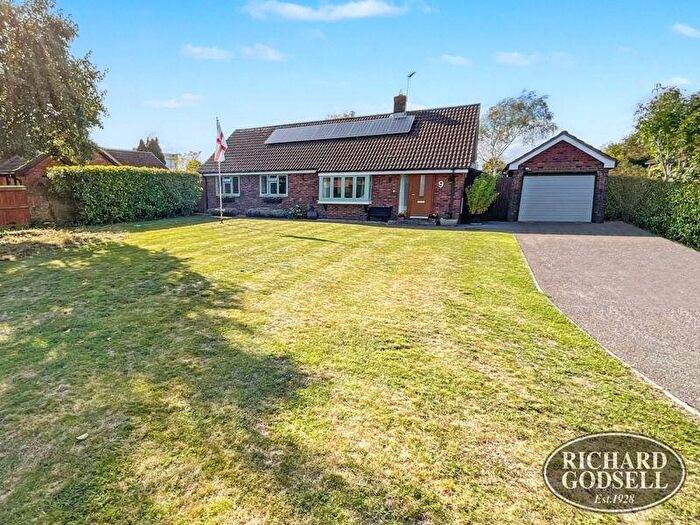
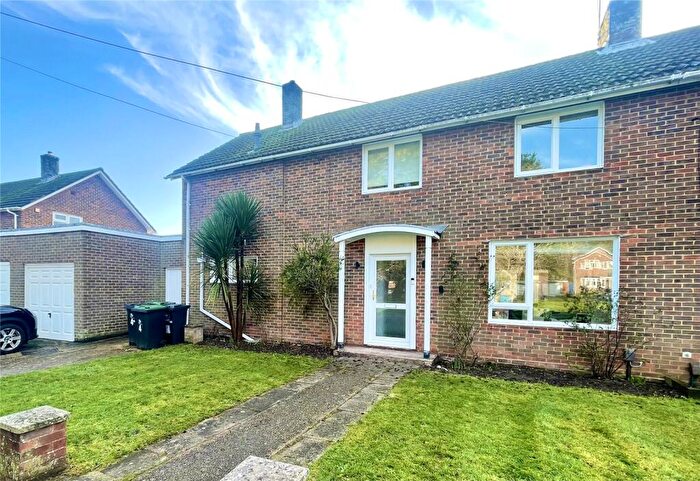
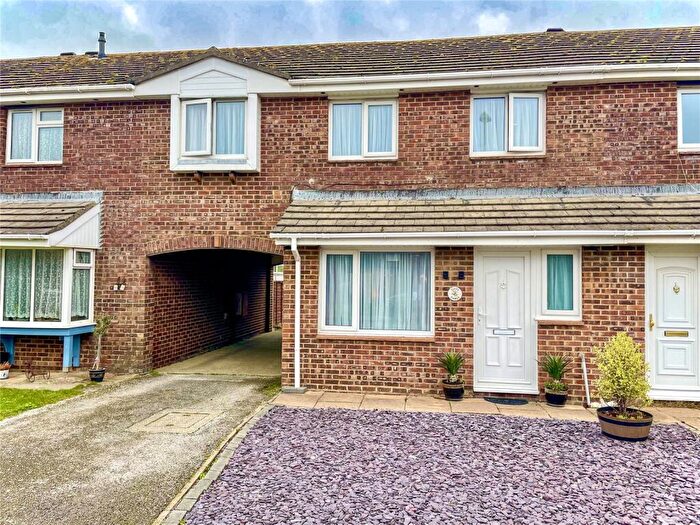
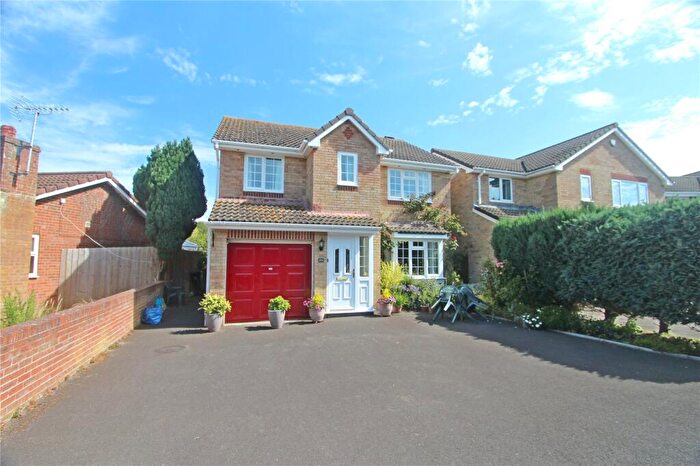
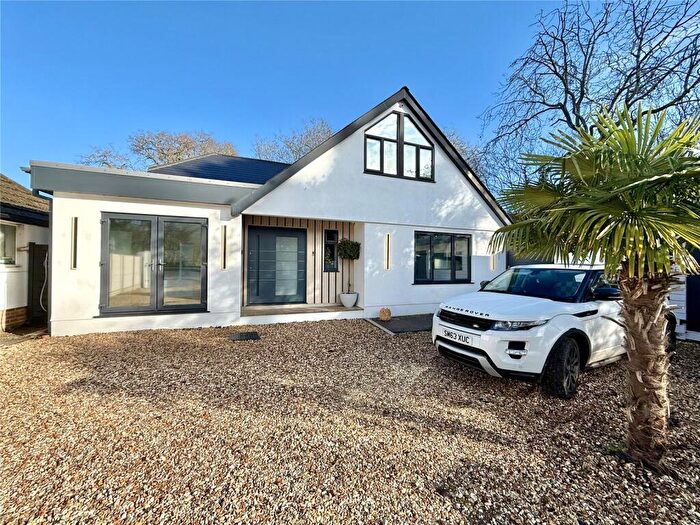
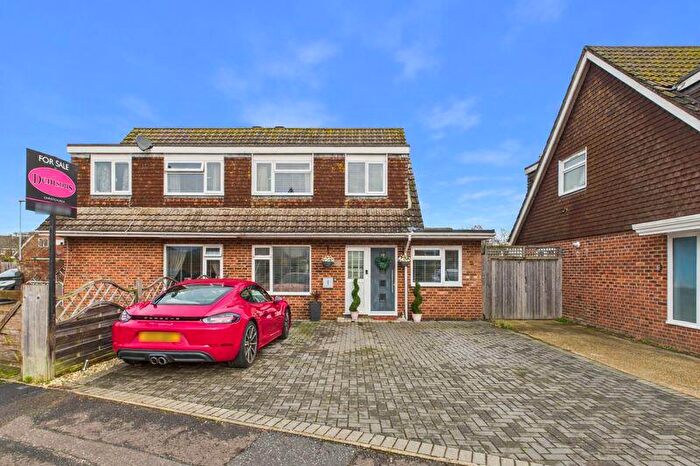
Properties for sale in Burton & Grange
Roads and Postcodes in Burton & Grange
Navigate through our locations to find the location of your next house in Burton & Grange, Christchurch for sale or to rent.
| Streets | Postcodes |
|---|---|
| Admiral Place | BH23 7BT |
| Aerodrome Way | BH23 3FJ |
| Airfield Road | BH23 3TG BH23 3TH BH23 3TQ |
| Airfield Way | BH23 3TF BH23 3TS |
| Bockhampton Road | BH23 7AF |
| Croft Road | BH23 3QH |
| Dorset Road | BH23 3DA |
| Draper Road | BH23 3AS |
| Everest Road | BH23 3EZ |
| Footners Lane | BH23 7NS |
| Hawthorn Road | BH23 7AD |
| Homestead Close | BH23 7BW |
| Hunt Road | BH23 3BS BH23 3BU |
| Jopps Corner | BH23 7JZ |
| Lyndhurst Road | BH23 7AB |
| Martins Hill Lane | BH23 7JE |
| Purewell Cross Road | BH23 3AF |
| Redvers Road | BH23 3AU |
| Salisbury Road | BH23 7JH BH23 7JP |
| Scotts Green | BH23 3FA BH23 3FB |
| Silver Business Park | BH23 3TA |
| Somerford Road | BH23 3PF BH23 3PP BH23 3PX BH23 3PY BH23 3QA BH23 3RT BH23 3TY BH23 3FN |
| St Marys Close | BH23 3FH |
| The Strete | BH23 3FF |
| Treebys Close | BH23 7HP |
| BH23 7AA |
Transport near Burton & Grange
- FAQ
- Price Paid By Year
- Property Type Price
Frequently asked questions about Burton & Grange
What is the average price for a property for sale in Burton & Grange?
The average price for a property for sale in Burton & Grange is £642,000. This amount is 42% higher than the average price in Christchurch. There are 1,538 property listings for sale in Burton & Grange.
What streets have the most expensive properties for sale in Burton & Grange?
The streets with the most expensive properties for sale in Burton & Grange are Admiral Place at an average of £1,095,000 and Aerodrome Way at an average of £350,000.
What streets have the most affordable properties for sale in Burton & Grange?
The street with the most affordable properties for sale in Burton & Grange is The Strete at an average of £320,000.
Which train stations are available in or near Burton & Grange?
Some of the train stations available in or near Burton & Grange are Christchurch, Hinton Admiral and Pokesdown.
Property Price Paid in Burton & Grange by Year
The average sold property price by year was:
| Year | Average Sold Price | Price Change |
Sold Properties
|
|---|---|---|---|
| 2025 | £730,000 | 3% |
2 Properties |
| 2024 | £710,000 | 54% |
2 Properties |
| 2023 | £330,000 | -24% |
1 Property |
| 2022 | £407,600 | -15% |
5 Properties |
| 2021 | £470,000 | -61% |
3 Properties |
| 2020 | £757,500 | 7% |
4 Properties |
| 2019 | £706,666 | -18% |
3 Properties |
| 2018 | £835,000 | 55% |
2 Properties |
| 2017 | £376,818 | 73% |
11 Properties |
| 2015 | £102,000 | -111% |
1 Property |
| 2014 | £215,000 | -184% |
1 Property |
| 2005 | £610,000 | 70% |
1 Property |
| 2001 | £185,000 | 14% |
1 Property |
| 2000 | £160,000 | 20% |
2 Properties |
| 1998 | £127,475 | 22% |
2 Properties |
| 1997 | £99,950 | -6% |
1 Property |
| 1996 | £105,500 | - |
2 Properties |
Property Price per Property Type in Burton & Grange
Here you can find historic sold price data in order to help with your property search.
The average Property Paid Price for specific property types in the last three years are:
| Property Type | Average Sold Price | Sold Properties |
|---|---|---|
| Detached House | £853,333.00 | 3 Detached Houses |
| Terraced House | £330,000.00 | 1 Terraced House |
| Semi Detached House | £320,000.00 | 1 Semi Detached House |

