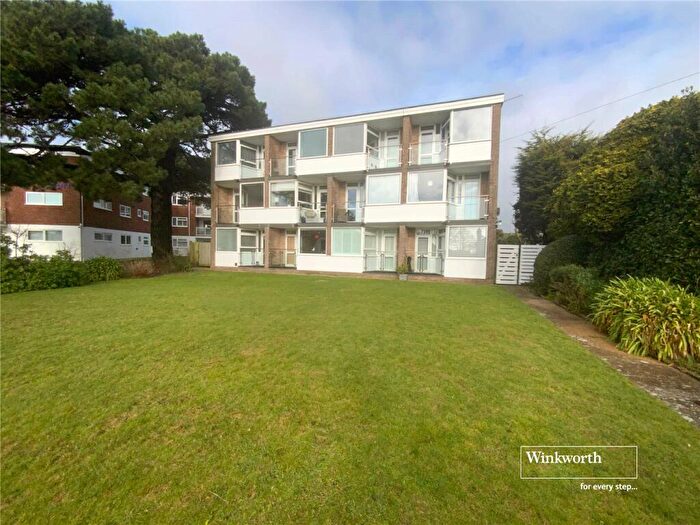
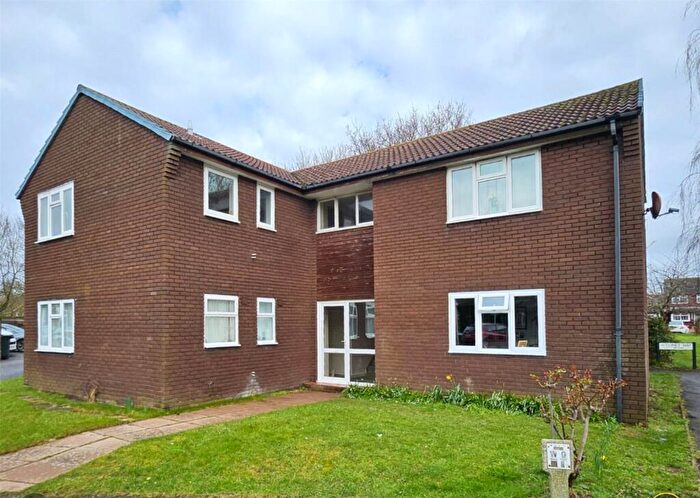
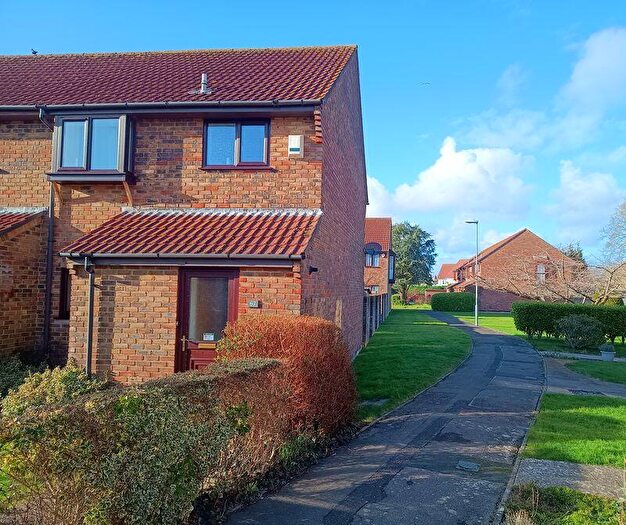
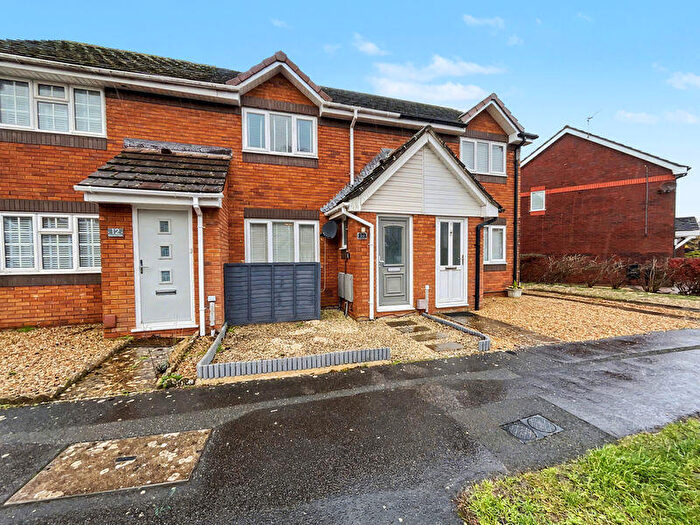
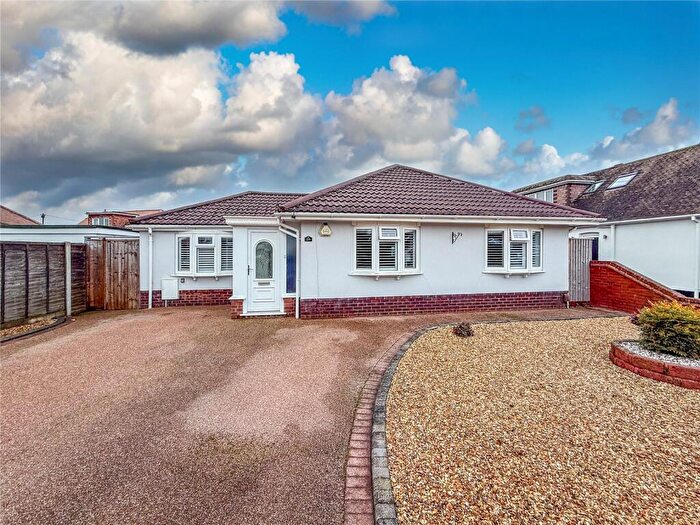
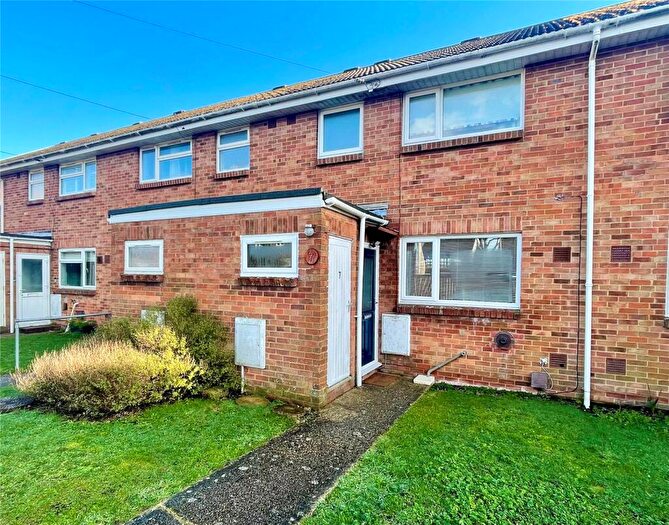
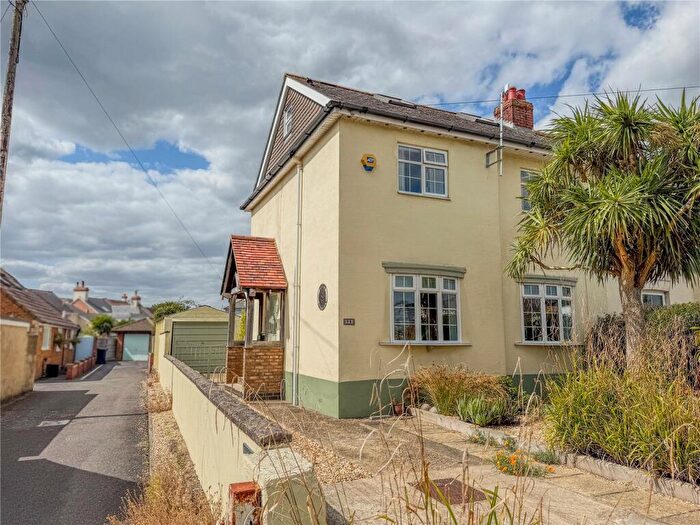
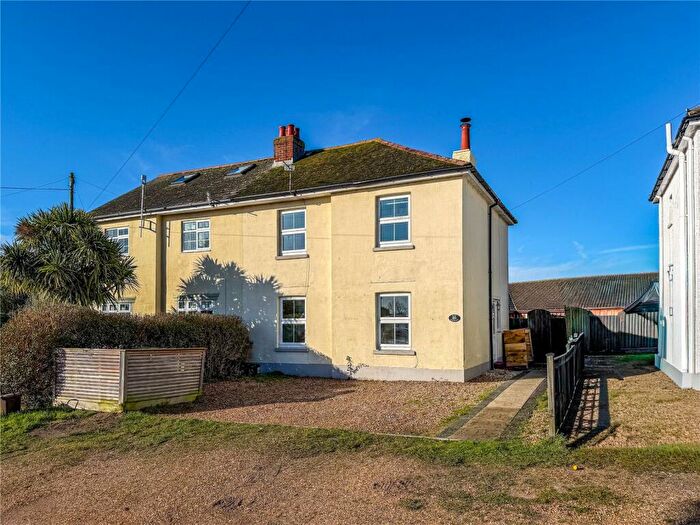
Houses for sale & to rent in Grange, Christchurch
House Prices in Grange
Properties in Grange have an average house price of £309,902.00 and had 124 Property Transactions within the last 3 years¹.
Grange is an area in Christchurch, Dorset with 1,942 households², where the most expensive property was sold for £710,000.00.
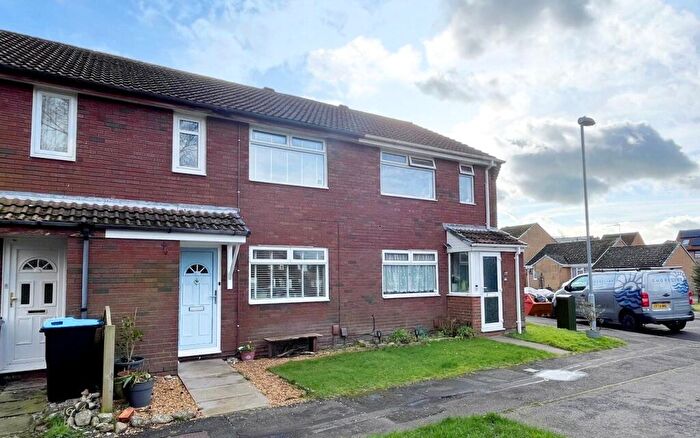
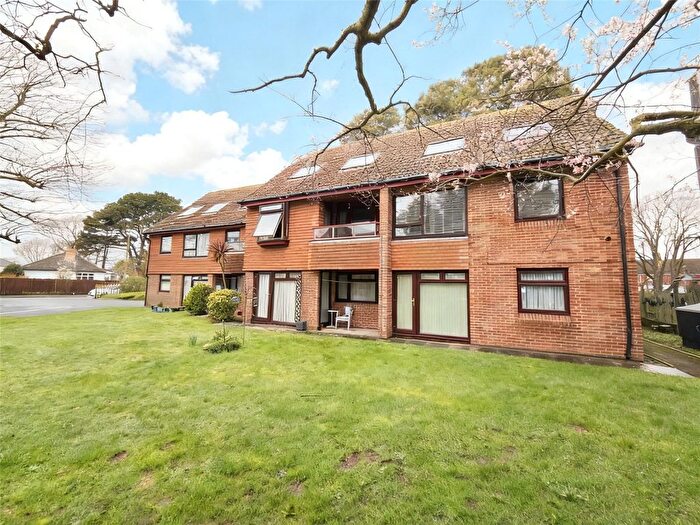
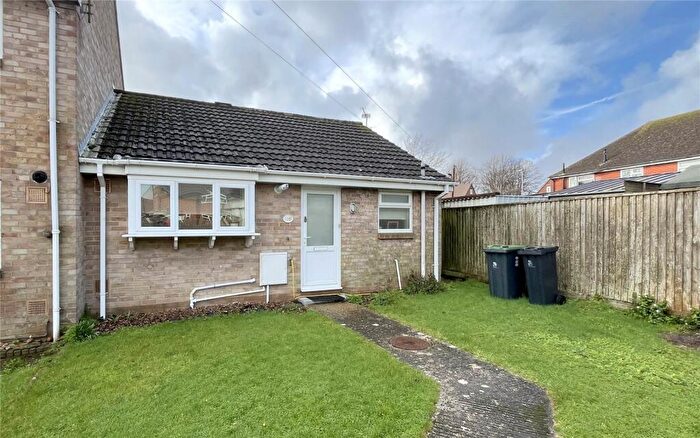
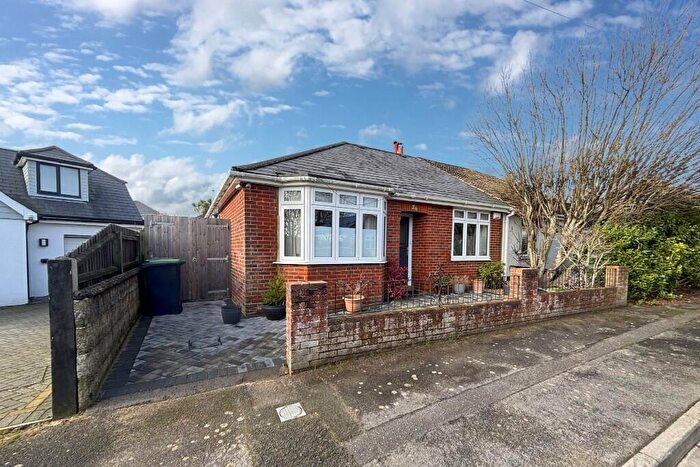
Properties for sale in Grange
Roads and Postcodes in Grange
Navigate through our locations to find the location of your next house in Grange, Christchurch for sale or to rent.
| Streets | Postcodes |
|---|---|
| Airfield Way | BH23 3PE |
| Amethyst Road | BH23 3EA BH23 3EB BH23 3ED BH23 3EF |
| Beresford Gardens | BH23 3QW |
| Bingham Close | BH23 3BQ |
| Bingham Road | BH23 3AH BH23 3AQ |
| Blackberry Lane | BH23 3QZ |
| Bonington Close | BH23 3BG |
| Briar Close | BH23 3RB |
| Burton Road | BH23 3AA BH23 3AB BH23 3AD BH23 3AE |
| Campion Grove | BH23 3RF |
| Caxton Close | BH23 3RP |
| Charles Road | BH23 3DN |
| Coleridge Green | BH23 3EG |
| Court Close | BH23 3PG |
| Croft Road | BH23 3QQ |
| Dennistoun Avenue | BH23 3QL |
| Dorset Road | BH23 3DB BH23 3DD BH23 3DE BH23 3DF BH23 3DG BH23 3DH BH23 3DJ BH23 3DQ |
| Draper Road | BH23 3AP BH23 3AW |
| Druitt Road | BH23 3DP BH23 3DW |
| Edward Road | BH23 3EJ BH23 3EL BH23 3EN BH23 3EW |
| Everest Road | BH23 3AY BH23 3AZ BH23 3BA BH23 3BB |
| Fisher Mews | BH23 3FG |
| Hillary Road | BH23 3BD |
| Hughes Business Centre | BH23 3RU |
| Hunt Road | BH23 3BN BH23 3BP BH23 3BT BH23 3BW BH23 3BX BH23 3BY |
| Irvine Way | BH23 3BE |
| Kay Close | BH23 3QT |
| Leyside | BH23 3RD BH23 3RE |
| Mallory Close | BH23 3BZ |
| Marmion Green | BH23 3DZ |
| Meadowland | BH23 3RA |
| Mudeford Lane | BH23 3HP |
| Newlands Road | BH23 3QB BH23 3QJ |
| Park Gardens | BH23 3PQ |
| Pennant Way | BH23 3PW |
| Redvers Road | BH23 3AT |
| Rosedale Close | BH23 3QP |
| Sandown Road | BH23 3HG |
| Scotts Green | BH23 3EP |
| Slinn Road | BH23 3AL BH23 3AN |
| Somerford Road | BH23 3PL BH23 3QD BH23 3QE BH23 3QF BH23 3QG |
| Somerford Way | BH23 3QN |
| Southey Road | BH23 3EH BH23 3EQ |
| Stroud Gardens | BH23 3QY |
| Stroud Lane | BH23 3QR BH23 3QS BH23 3QU BH23 3QX |
| Stroud Park Avenue | BH23 3HQ |
| Tensing Road | BH23 3AX |
| The Hawthorns | BH23 3RG |
| Wilmar Close | BH23 3FD |
Transport near Grange
- FAQ
- Price Paid By Year
- Property Type Price
Frequently asked questions about Grange
What is the average price for a property for sale in Grange?
The average price for a property for sale in Grange is £309,902. This amount is 32% lower than the average price in Christchurch. There are 583 property listings for sale in Grange.
What streets have the most expensive properties for sale in Grange?
The streets with the most expensive properties for sale in Grange are Stroud Gardens at an average of £507,000, Mudeford Lane at an average of £484,250 and Croft Road at an average of £467,500.
What streets have the most affordable properties for sale in Grange?
The streets with the most affordable properties for sale in Grange are Somerford Way at an average of £189,750, Dorset Road at an average of £228,600 and The Hawthorns at an average of £232,500.
Which train stations are available in or near Grange?
Some of the train stations available in or near Grange are Christchurch, Hinton Admiral and Pokesdown.
Property Price Paid in Grange by Year
The average sold property price by year was:
| Year | Average Sold Price | Price Change |
Sold Properties
|
|---|---|---|---|
| 2025 | £301,247 | -15% |
34 Properties |
| 2024 | £345,068 | 15% |
36 Properties |
| 2023 | £291,907 | -7% |
54 Properties |
| 2022 | £312,911 | 14% |
47 Properties |
| 2021 | £268,325 | 3% |
73 Properties |
| 2020 | £260,185 | 2% |
45 Properties |
| 2019 | £255,288 | 6% |
39 Properties |
| 2018 | £239,315 | -6% |
54 Properties |
| 2017 | £254,239 | 13% |
54 Properties |
| 2016 | £221,107 | 4% |
58 Properties |
| 2015 | £212,830 | 8% |
53 Properties |
| 2014 | £196,289 | 11% |
65 Properties |
| 2013 | £174,534 | -8% |
56 Properties |
| 2012 | £188,106 | 6% |
46 Properties |
| 2011 | £176,715 | -4% |
49 Properties |
| 2010 | £182,928 | 14% |
47 Properties |
| 2009 | £157,138 | -17% |
47 Properties |
| 2008 | £183,424 | -0,1% |
32 Properties |
| 2007 | £183,546 | 9% |
68 Properties |
| 2006 | £167,260 | 6% |
87 Properties |
| 2005 | £156,851 | 2% |
59 Properties |
| 2004 | £153,770 | 12% |
76 Properties |
| 2003 | £135,827 | 17% |
69 Properties |
| 2002 | £112,739 | 8% |
88 Properties |
| 2001 | £103,870 | 10% |
60 Properties |
| 2000 | £93,932 | 20% |
82 Properties |
| 1999 | £74,920 | 12% |
66 Properties |
| 1998 | £65,641 | 16% |
68 Properties |
| 1997 | £55,312 | 6% |
64 Properties |
| 1996 | £51,724 | 5% |
53 Properties |
| 1995 | £49,238 | - |
47 Properties |
Property Price per Property Type in Grange
Here you can find historic sold price data in order to help with your property search.
The average Property Paid Price for specific property types in the last three years are:
| Property Type | Average Sold Price | Sold Properties |
|---|---|---|
| Semi Detached House | £340,240.00 | 27 Semi Detached Houses |
| Detached House | £410,287.00 | 33 Detached Houses |
| Terraced House | £287,337.00 | 41 Terraced Houses |
| Flat | £170,478.00 | 23 Flats |

