Houses for sale & to rent in Jumpers, Christchurch
House Prices in Jumpers
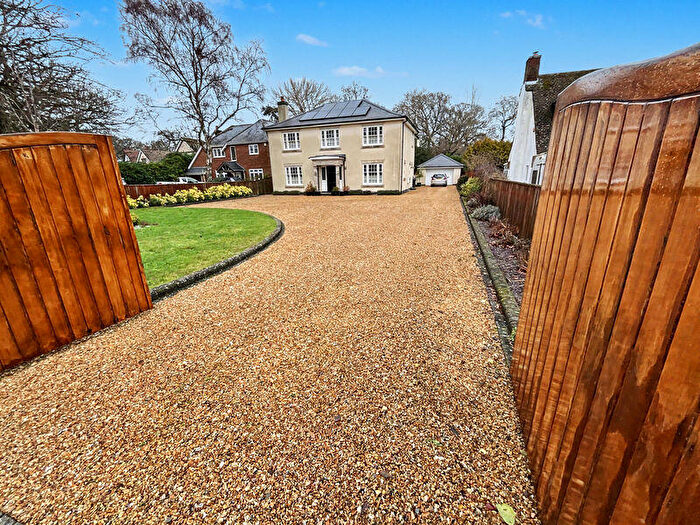
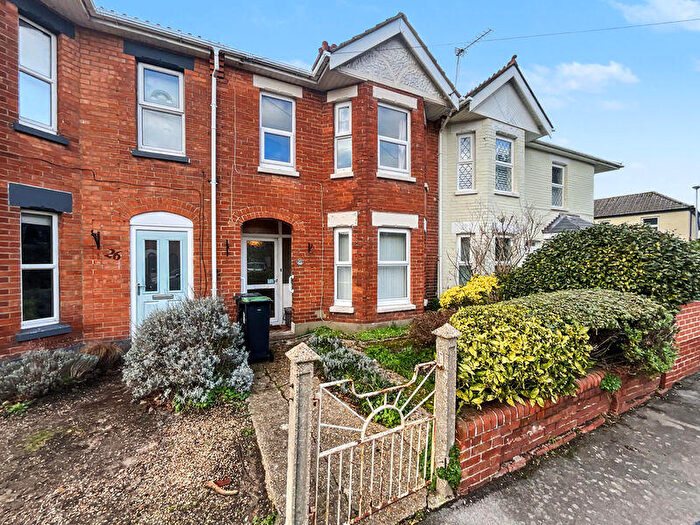
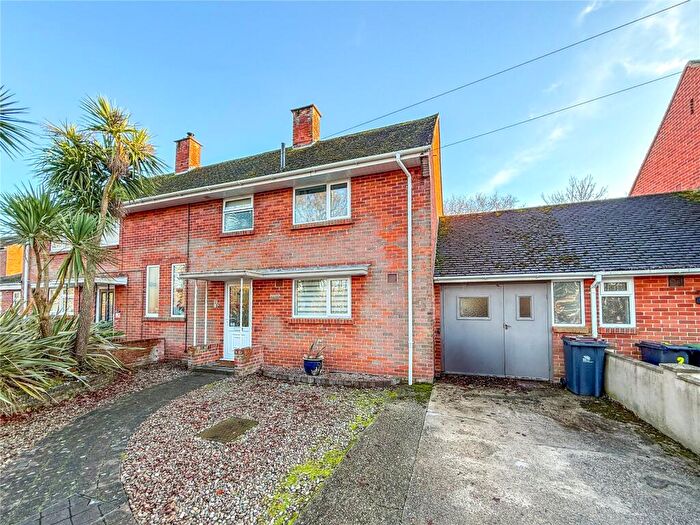
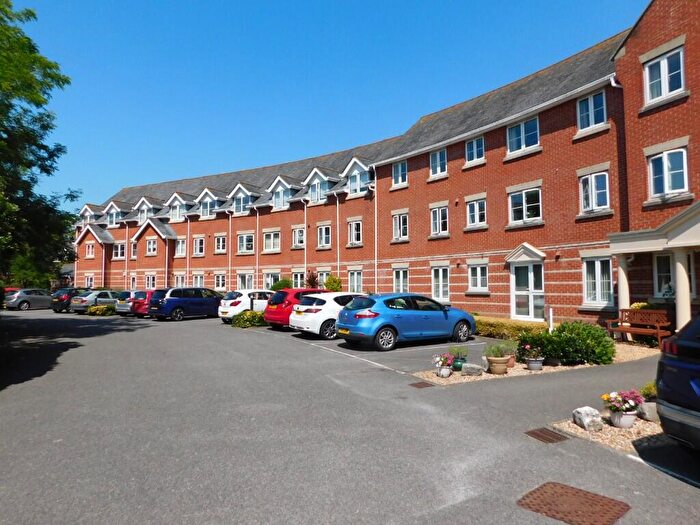
Properties in Jumpers have an average house price of £440,977.00 and had 146 Property Transactions within the last 3 years¹.
Jumpers is an area in Christchurch, Dorset with 1,541 households², where the most expensive property was sold for £940,000.00.
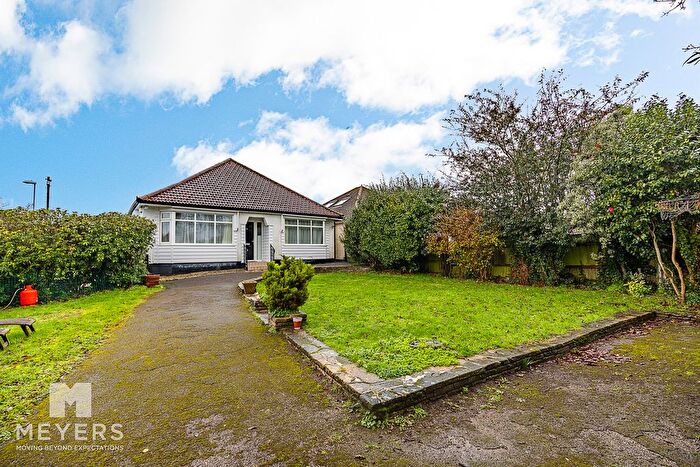
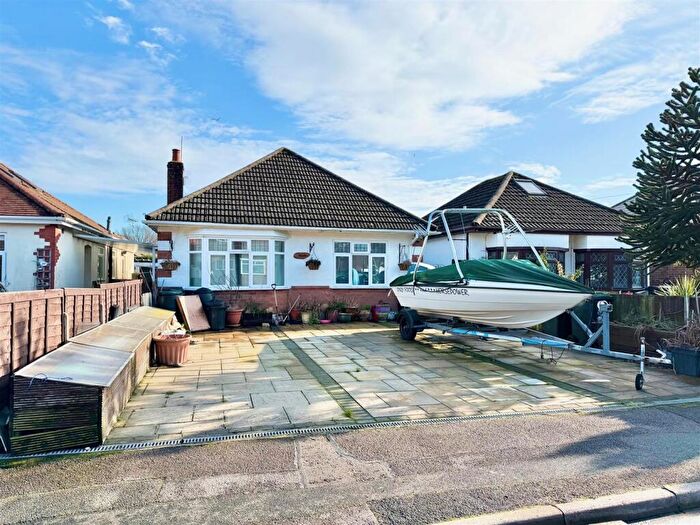
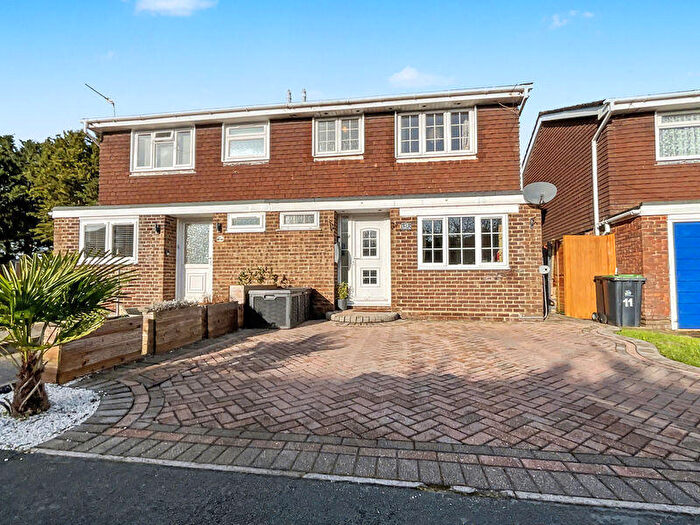
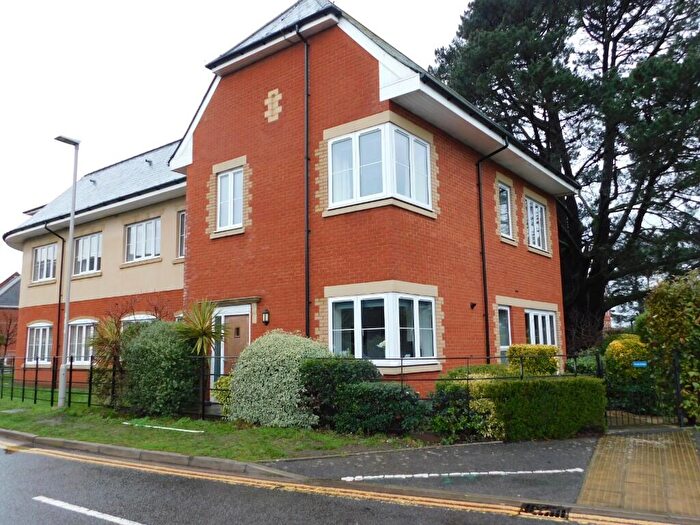
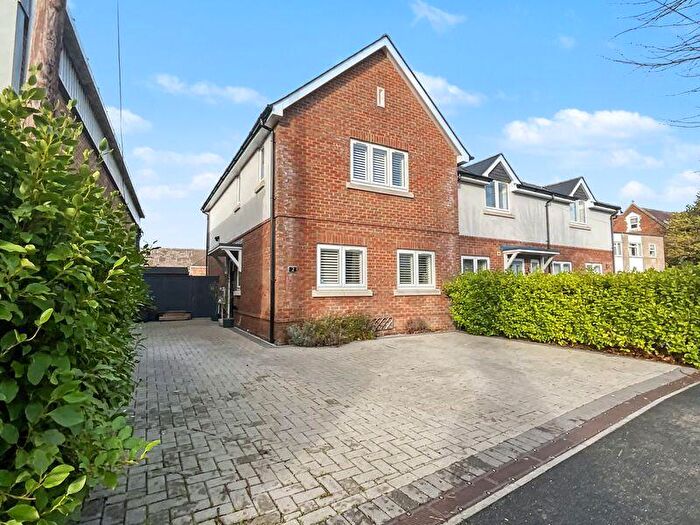
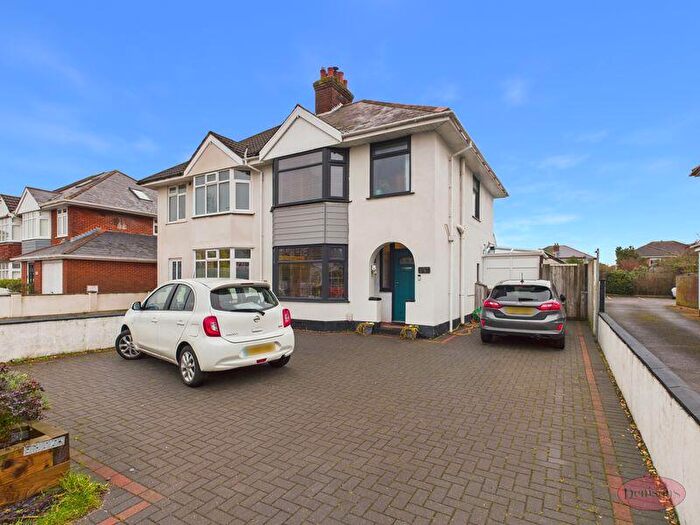
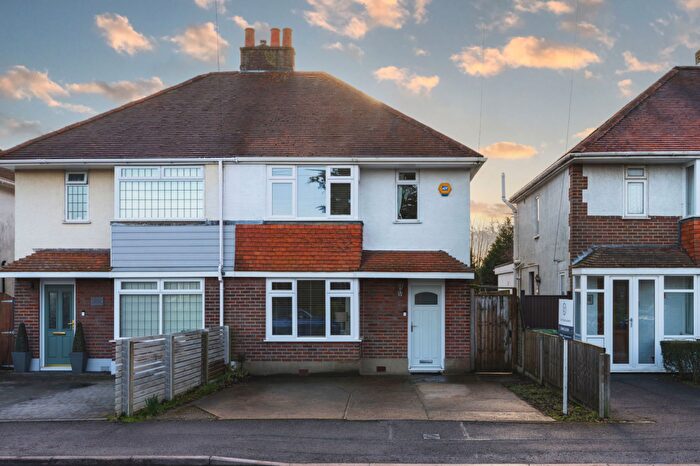
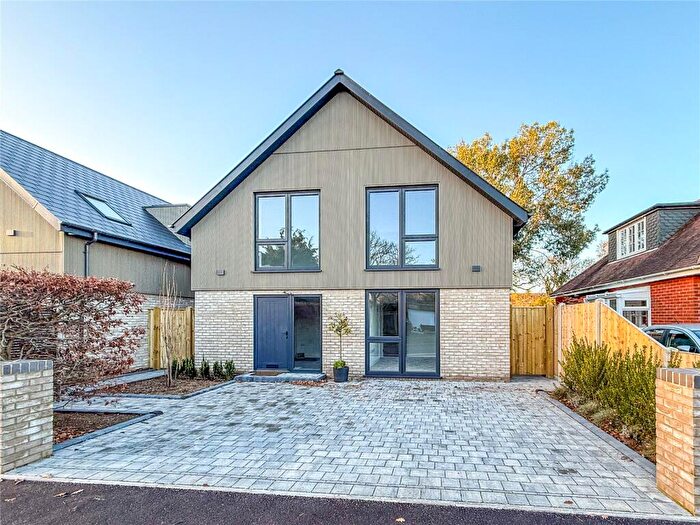
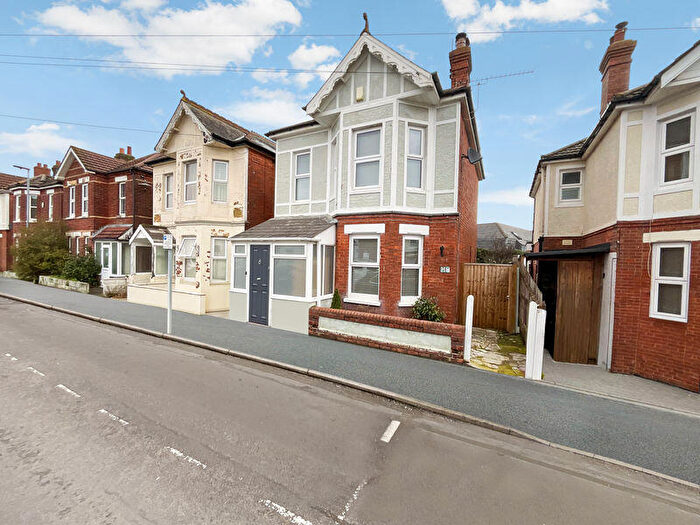
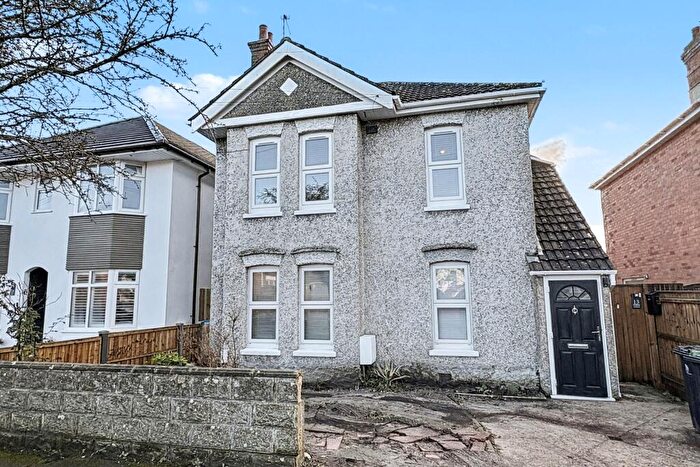
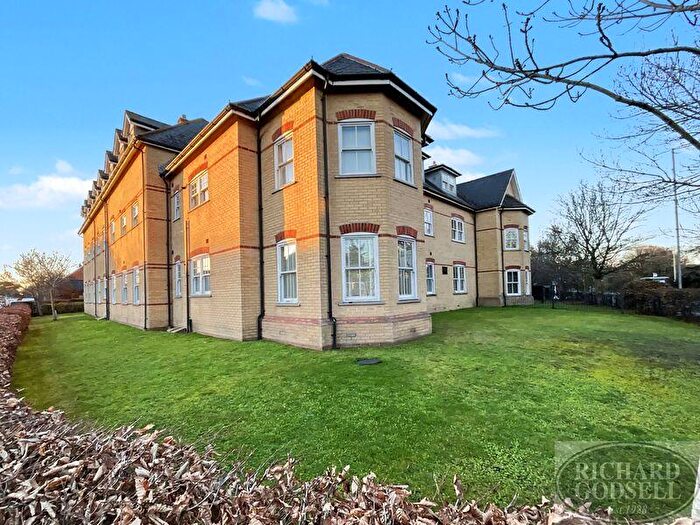
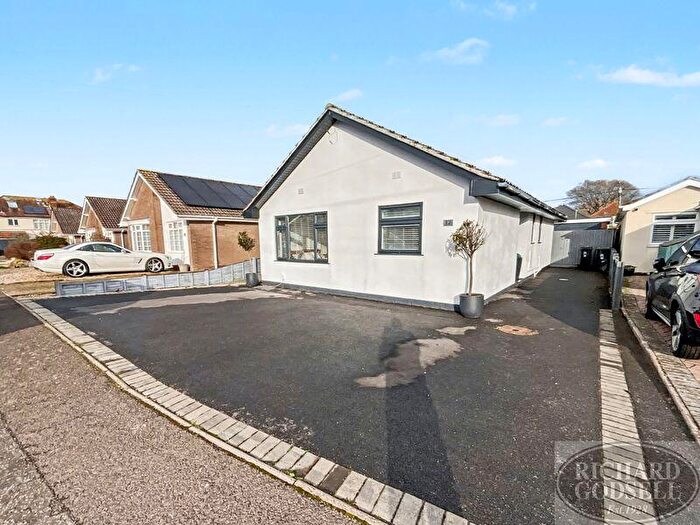
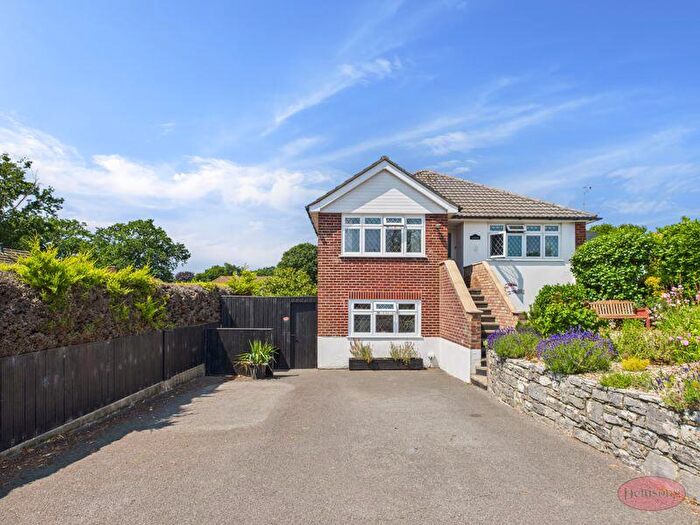
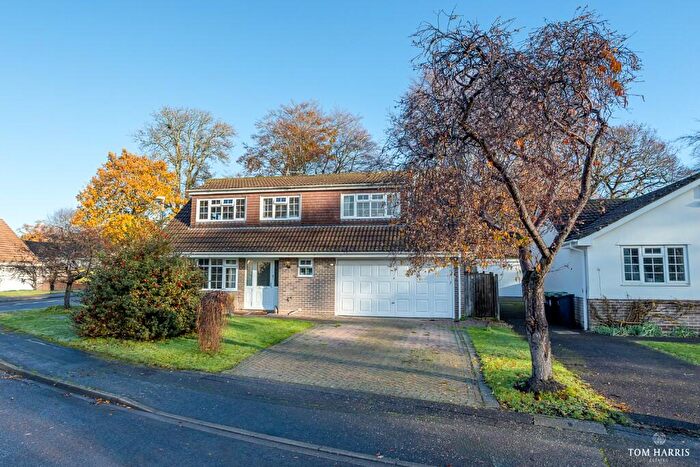
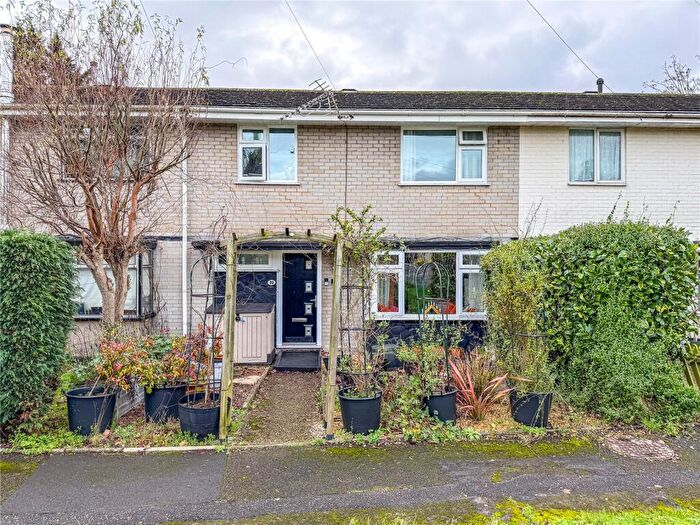
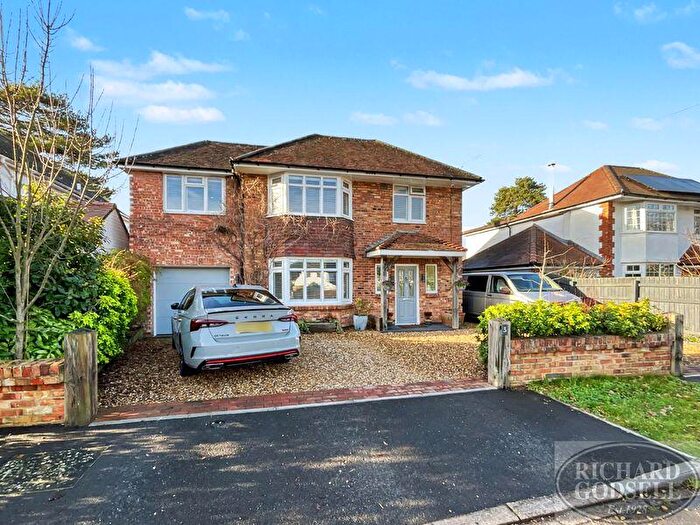
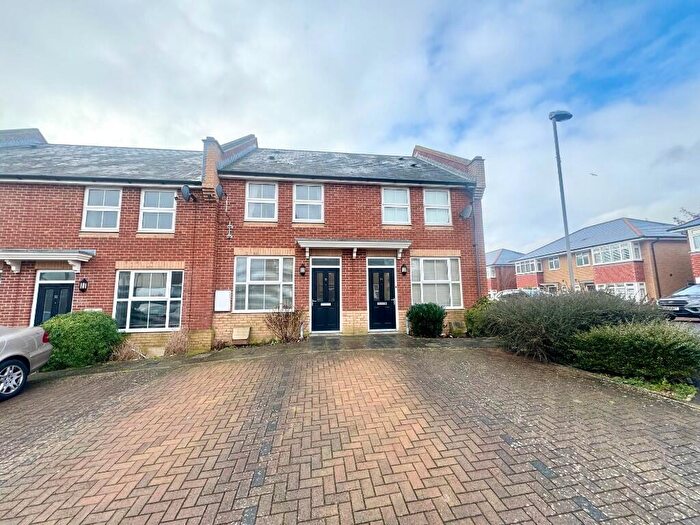
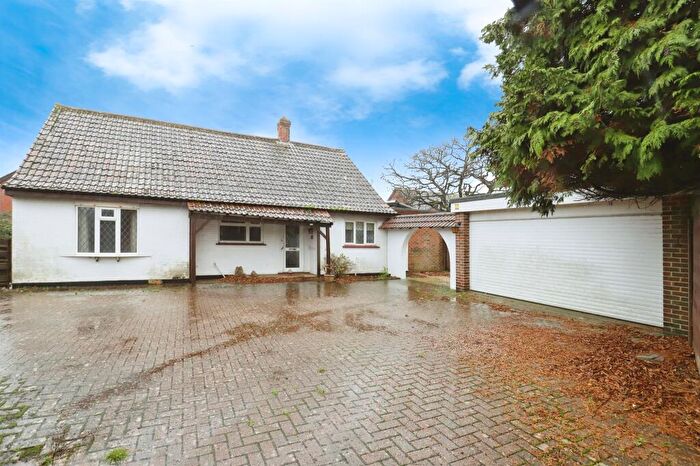
Properties for sale in Jumpers
Roads and Postcodes in Jumpers
Navigate through our locations to find the location of your next house in Jumpers, Christchurch for sale or to rent.
| Streets | Postcodes |
|---|---|
| Adelaide Close | BH23 2JW |
| Albion Road | BH23 2JG BH23 2JH BH23 2JQ |
| Anne Close | BH23 2NW |
| Apple Grove | BH23 2HG |
| Arcadia Road | BH23 2JE BH23 2JF |
| Bendigo Road | BH23 2HR |
| Branwell Close | BH23 2NP |
| Brisbane Road | BH23 2HP |
| Bronte Avenue | BH23 2LX BH23 2LY BH23 2LZ BH23 2NA BH23 2NB BH23 2ND |
| Cairns Close | BH23 2JJ |
| Cambridge Gardens | BH23 2TL |
| Canberra Close | BH23 2FD |
| Canberra Road | BH23 2HL BH23 2HN BH23 2HW |
| Crofton Close | BH23 2JN |
| Darwin Avenue | BH23 2JA BH23 2JB |
| Driftwood Park | BH23 2GA |
| Elm Avenue | BH23 2HJ |
| Emily Close | BH23 2NN |
| Endfield Close | BH23 2HH |
| Endfield Road | BH23 2HS BH23 2HT BH23 2HU |
| Essex Avenue | BH23 2SF |
| Fairmile Road | BH23 2LD BH23 2LE BH23 2LF BH23 2LG BH23 2LH BH23 2LP BH23 2LQ BH23 2LR BH23 2LW |
| Flambard Avenue | BH23 2NE BH23 2NF |
| Halewood Way | BH23 2JU |
| Haworth Close | BH23 2PT |
| Huntingdon Gardens | BH23 2TW |
| Jumpers Avenue | BH23 2EP BH23 2ER |
| Jumpers Road | BH23 2JT |
| Kimberley Close | BH23 2JL |
| Kingsway Close | BH23 2TP |
| Lincoln Avenue | BH23 2SG |
| Lodge Road | BH23 2ET |
| Marsh Lane | BH23 2NH |
| Melbourne Road | BH23 2HY BH23 2HZ |
| Norfolk Avenue | BH23 2SE |
| Normanton Close | BH23 2JD |
| Parsonage Close | BH23 2GB |
| Perth Close | BH23 2EJ |
| Pippin Close | BH23 2DU |
| Suffolk Avenue | BH23 2SQ BH23 2TJ |
| Sydney Road | BH23 2HX |
| The Glade | BH23 2ES |
| The Grove | BH23 2EX BH23 2EY BH23 2EZ |
| The Hurdles | BH23 2DR |
| The Old Boat Yard | BH23 2BW |
| Villette Close | BH23 2NR |
| Walcott Avenue | BH23 2NG BH23 2NQ |
| Wildfell Close | BH23 2PU |
Transport near Jumpers
- FAQ
- Price Paid By Year
- Property Type Price
Frequently asked questions about Jumpers
What is the average price for a property for sale in Jumpers?
The average price for a property for sale in Jumpers is £440,977. This amount is 3% lower than the average price in Christchurch. There are 816 property listings for sale in Jumpers.
What streets have the most expensive properties for sale in Jumpers?
The streets with the most expensive properties for sale in Jumpers are Walcott Avenue at an average of £667,875, Flambard Avenue at an average of £641,666 and Arcadia Road at an average of £605,000.
What streets have the most affordable properties for sale in Jumpers?
The streets with the most affordable properties for sale in Jumpers are Brisbane Road at an average of £238,833, Cairns Close at an average of £280,000 and Marsh Lane at an average of £292,500.
Which train stations are available in or near Jumpers?
Some of the train stations available in or near Jumpers are Christchurch, Pokesdown and Bournemouth.
Property Price Paid in Jumpers by Year
The average sold property price by year was:
| Year | Average Sold Price | Price Change |
Sold Properties
|
|---|---|---|---|
| 2025 | £451,885 | 7% |
57 Properties |
| 2024 | £421,002 | -7% |
52 Properties |
| 2023 | £452,246 | 2% |
37 Properties |
| 2022 | £441,620 | 6% |
71 Properties |
| 2021 | £414,208 | 4% |
83 Properties |
| 2020 | £398,821 | 7% |
56 Properties |
| 2019 | £371,167 | 5% |
67 Properties |
| 2018 | £351,600 | 5% |
55 Properties |
| 2017 | £335,691 | -1% |
62 Properties |
| 2016 | £339,200 | 13% |
62 Properties |
| 2015 | £296,060 | 8% |
50 Properties |
| 2014 | £272,292 | 8% |
62 Properties |
| 2013 | £250,463 | 3% |
90 Properties |
| 2012 | £243,417 | -4% |
51 Properties |
| 2011 | £253,030 | -0,3% |
66 Properties |
| 2010 | £253,732 | 1% |
60 Properties |
| 2009 | £250,892 | -4% |
56 Properties |
| 2008 | £259,707 | 2% |
41 Properties |
| 2007 | £253,825 | 0,3% |
81 Properties |
| 2006 | £253,162 | -0,1% |
99 Properties |
| 2005 | £253,485 | 14% |
87 Properties |
| 2004 | £219,129 | 12% |
87 Properties |
| 2003 | £193,084 | 15% |
84 Properties |
| 2002 | £165,036 | 15% |
96 Properties |
| 2001 | £140,308 | 20% |
86 Properties |
| 2000 | £111,545 | 3% |
59 Properties |
| 1999 | £107,918 | 20% |
122 Properties |
| 1998 | £86,761 | 4% |
91 Properties |
| 1997 | £82,981 | 15% |
91 Properties |
| 1996 | £70,342 | 10% |
85 Properties |
| 1995 | £63,491 | - |
54 Properties |
Property Price per Property Type in Jumpers
Here you can find historic sold price data in order to help with your property search.
The average Property Paid Price for specific property types in the last three years are:
| Property Type | Average Sold Price | Sold Properties |
|---|---|---|
| Semi Detached House | £396,597.00 | 46 Semi Detached Houses |
| Detached House | £520,721.00 | 73 Detached Houses |
| Terraced House | £334,970.00 | 17 Terraced Houses |
| Flat | £243,200.00 | 10 Flats |

