Houses for sale & to rent in Town Centre, Christchurch
House Prices in Town Centre
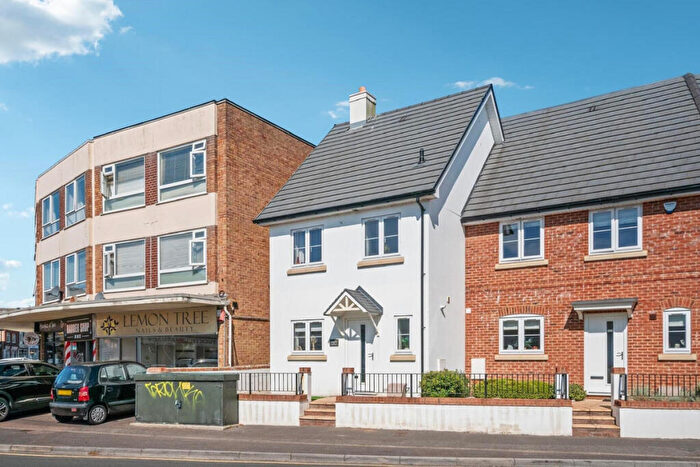
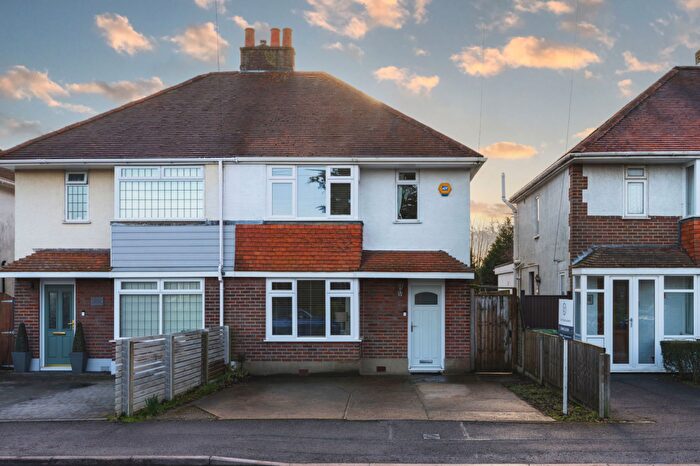
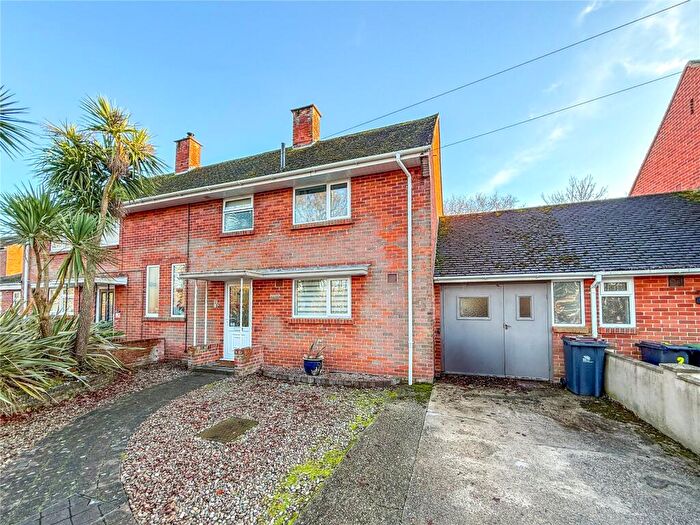
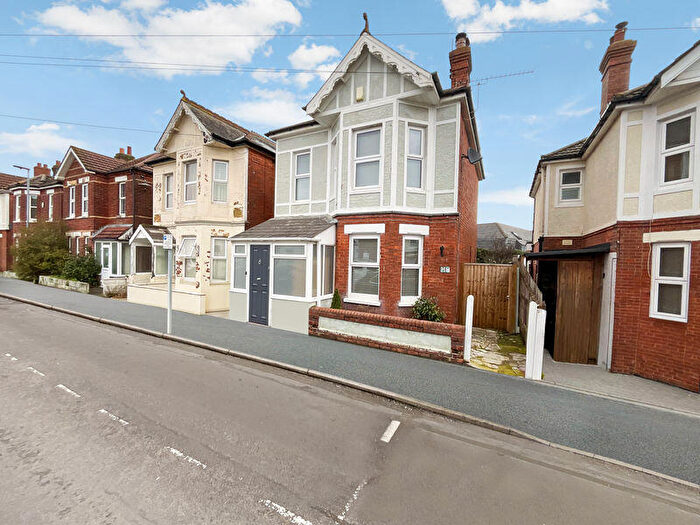
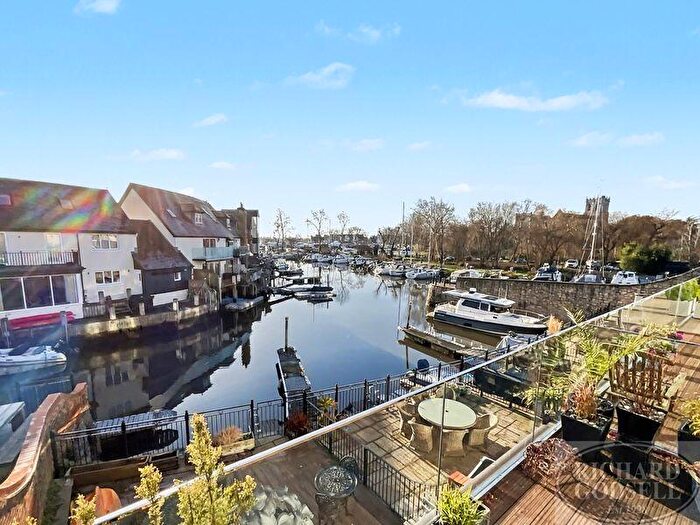
Properties in Town Centre have an average house price of £413,107.00 and had 220 Property Transactions within the last 3 years¹.
Town Centre is an area in Christchurch, Dorset with 1,807 households², where the most expensive property was sold for £1,585,000.00.
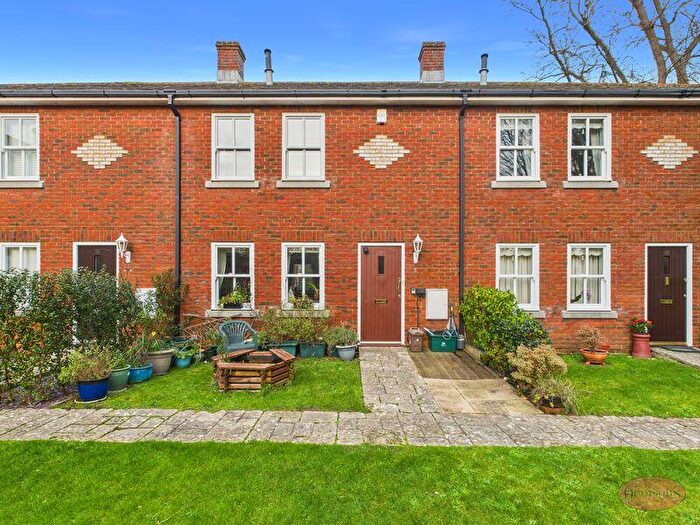
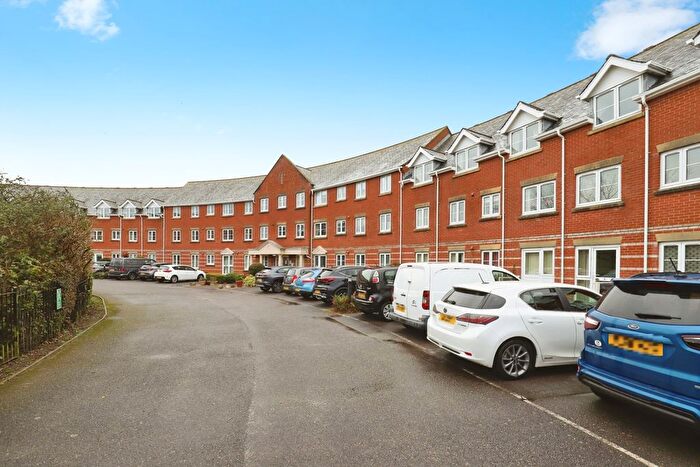
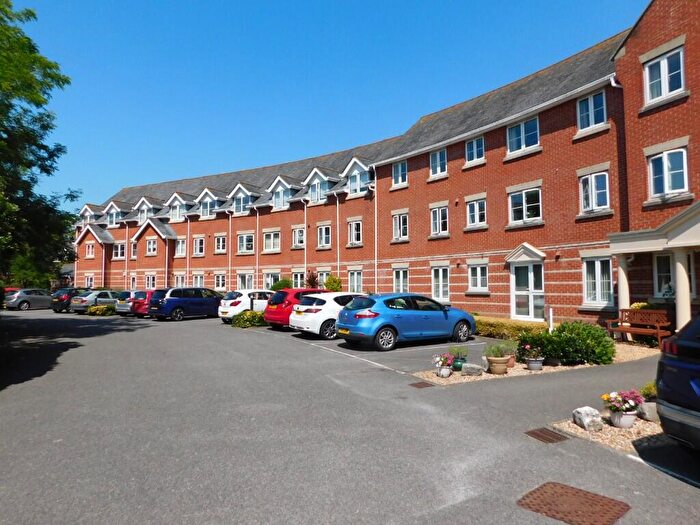
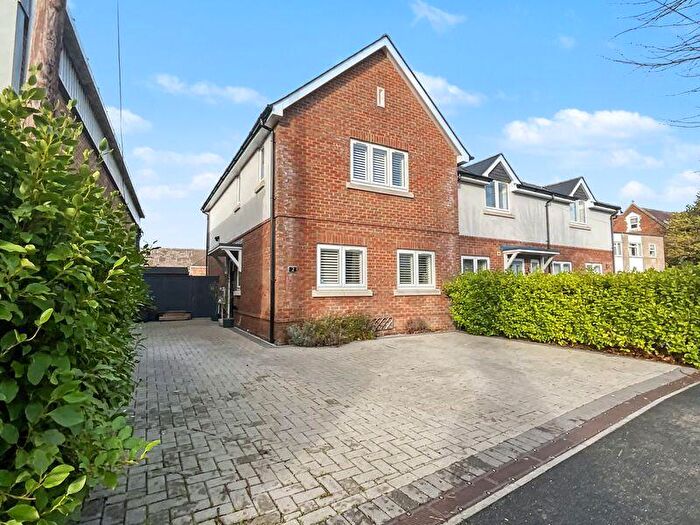
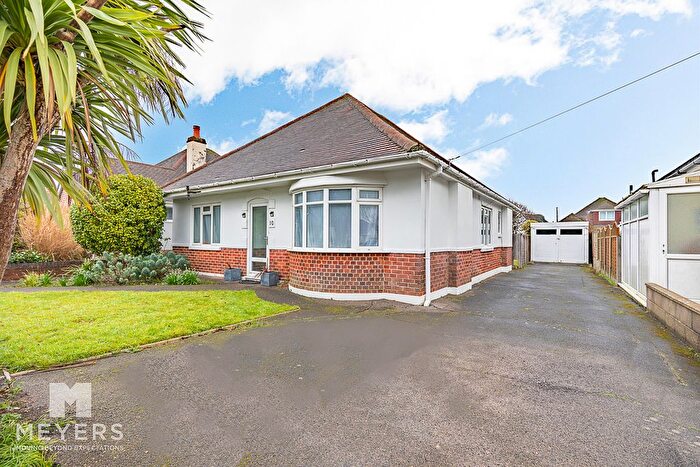
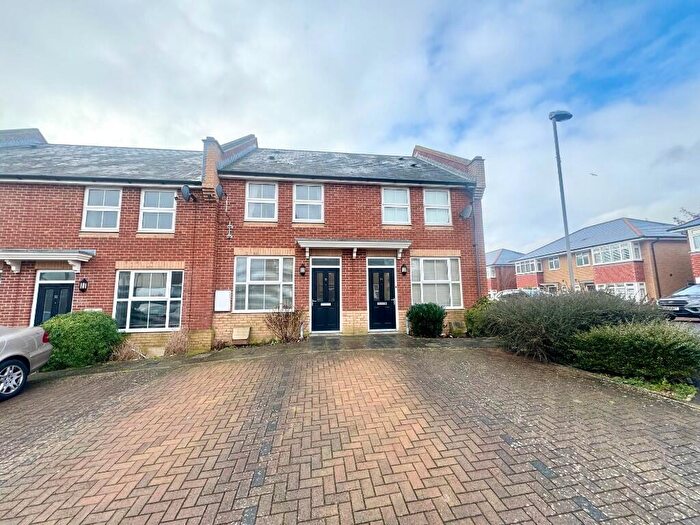
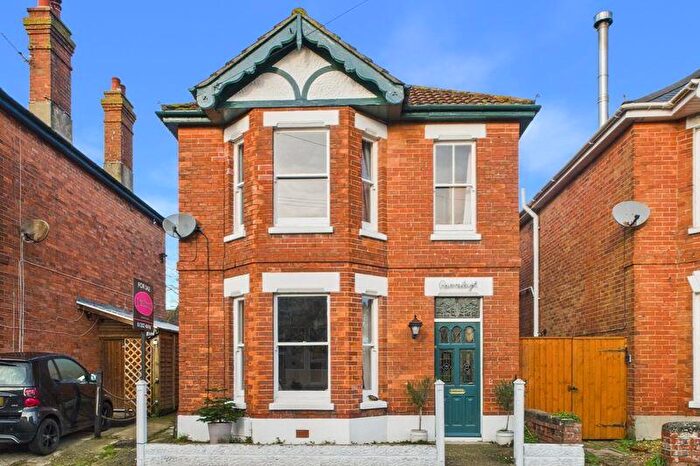
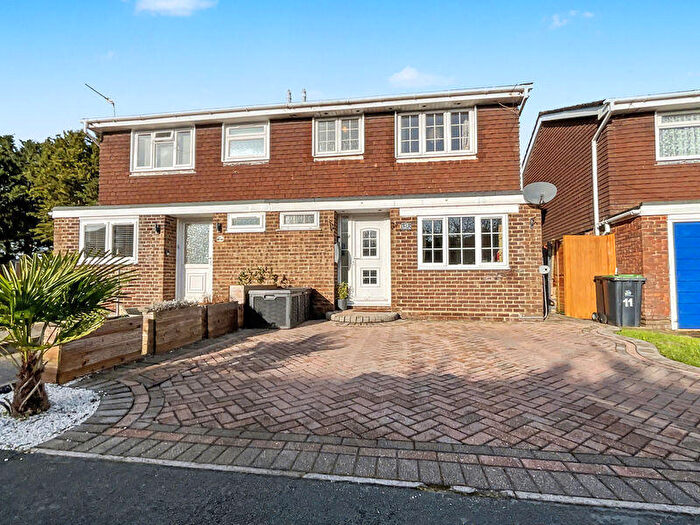
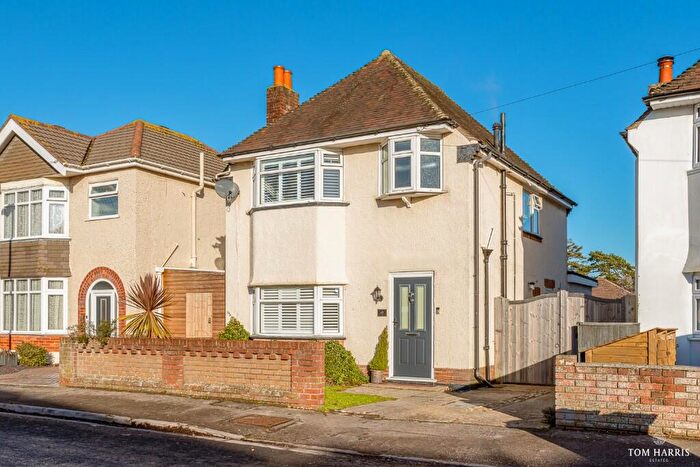
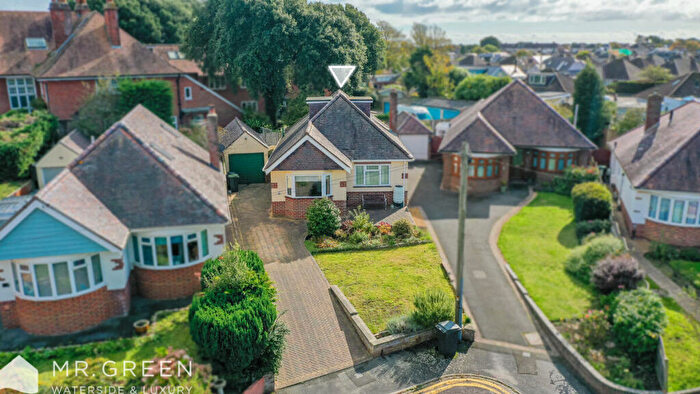
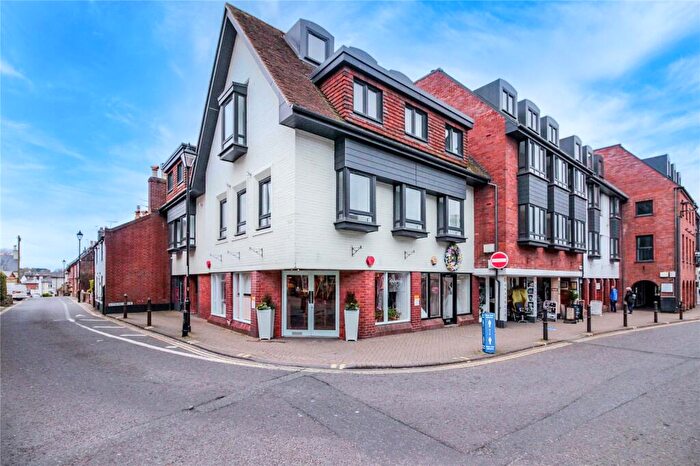
Properties for sale in Town Centre
Roads and Postcodes in Town Centre
Navigate through our locations to find the location of your next house in Town Centre, Christchurch for sale or to rent.
| Streets | Postcodes |
|---|---|
| Arthur Road | BH23 1PU |
| Avon Buildings | BH23 1QJ BH23 1QS |
| Avon Wharf | BH23 1DJ |
| Bargates | BH23 1QD BH23 1QE BH23 1QH BH23 1QL BH23 1QP BH23 1QQ |
| Barrack Road | BH23 1PA BH23 1PD BH23 1PF |
| Beaconsfield Road | BH23 1QT |
| Belvedere Road | BH23 1PT |
| Bridge Street | BH23 1BL BH23 1DY BH23 1ED |
| Castle Street | BH23 1DP BH23 1DT |
| Church Lane | BH23 1BS |
| Church Street | BH23 1BW |
| Creedy Drive | BH23 1NX |
| Douglas Avenue | BH23 1JT |
| Ducking Stool Lane | BH23 1DS |
| Ducking Stool Walk | BH23 1GA |
| Fairfield | BH23 1QX |
| Fairfield Close | BH23 1QZ |
| Fairway Drive | BH23 1JX BH23 1JY BH23 1JZ |
| Freda Road | BH23 1LY |
| Galton Avenue | BH23 1JU |
| Gleadowe Avenue | BH23 1LR BH23 1LS |
| High Street | BH23 1AB BH23 1AS BH23 1AY BH23 1BN |
| Kings Avenue | BH23 1LZ BH23 1NA BH23 1NB |
| Magdalen Lane | BH23 1PH |
| Malmesbury Close | BH23 1NU |
| Manor Road | BH23 1LT BH23 1LU |
| Millhams Street | BH23 1DN BH23 1DW |
| Orchard Close | BH23 1LL |
| Princess Avenue | BH23 1DB BH23 1DD |
| Priory Mews | BH23 1GB |
| Priory Quay | BH23 1DR |
| Quay Road | BH23 1BU |
| Queens Avenue | BH23 1BZ BH23 1DA |
| Riverdale Lane | BH23 1RL |
| Riverlea Road | BH23 1JQ |
| Rossiters Quay | BH23 1DZ |
| Silver Street | BH23 1BT |
| Sopers Lane | BH23 1JE BH23 1JF |
| South View Road | BH23 1JH |
| St Johns Road | BH23 1LX |
| St Margarets Avenue | BH23 1JD |
| Station Road | BH23 1QY |
| Stour Road | BH23 1FG BH23 1JL BH23 1JN BH23 1JP BH23 1JW BH23 1LN BH23 1LW BH23 1PJ BH23 1PL BH23 1PS |
| Stourbank Road | BH23 1LH |
| The Meridians | BH23 1RA BH23 1RD |
| The Mews | BH23 1QF |
| Turnberry Close | BH23 1LQ |
| Twynham Avenue | BH23 1QU |
| Wentworth Drive | BH23 1RB |
| Whitehall | BH23 1DE |
| Wick Lane | BH23 1HT BH23 1HU BH23 1HX |
| Wick Point Mews | BH23 1NY BH23 1NZ |
| Wickfield Avenue | BH23 1JA BH23 1JB |
| Wickfield Close | BH23 1HZ |
| Willow Way | BH23 1JJ BH23 1LA |
Transport near Town Centre
- FAQ
- Price Paid By Year
- Property Type Price
Frequently asked questions about Town Centre
What is the average price for a property for sale in Town Centre?
The average price for a property for sale in Town Centre is £413,107. This amount is 9% lower than the average price in Christchurch. There are 1,090 property listings for sale in Town Centre.
What streets have the most expensive properties for sale in Town Centre?
The streets with the most expensive properties for sale in Town Centre are Priory Quay at an average of £1,345,000, Rossiters Quay at an average of £1,210,000 and Wickfield Avenue at an average of £900,750.
What streets have the most affordable properties for sale in Town Centre?
The streets with the most affordable properties for sale in Town Centre are Arthur Road at an average of £156,250, Bargates at an average of £165,625 and Barrack Road at an average of £191,444.
Which train stations are available in or near Town Centre?
Some of the train stations available in or near Town Centre are Christchurch, Pokesdown and Hinton Admiral.
Property Price Paid in Town Centre by Year
The average sold property price by year was:
| Year | Average Sold Price | Price Change |
Sold Properties
|
|---|---|---|---|
| 2025 | £381,135 | -19% |
64 Properties |
| 2024 | £452,474 | 13% |
84 Properties |
| 2023 | £395,597 | -4% |
72 Properties |
| 2022 | £412,694 | -3% |
90 Properties |
| 2021 | £423,114 | -1% |
107 Properties |
| 2020 | £428,275 | -2% |
67 Properties |
| 2019 | £436,352 | 13% |
80 Properties |
| 2018 | £378,037 | - |
92 Properties |
| 2017 | £378,087 | 10% |
98 Properties |
| 2016 | £339,510 | 12% |
114 Properties |
| 2015 | £300,261 | 10% |
134 Properties |
| 2014 | £270,729 | -29% |
91 Properties |
| 2013 | £347,898 | 23% |
100 Properties |
| 2012 | £267,192 | -26% |
70 Properties |
| 2011 | £337,544 | 15% |
76 Properties |
| 2010 | £288,204 | 16% |
72 Properties |
| 2009 | £242,435 | -51% |
100 Properties |
| 2008 | £365,025 | 26% |
55 Properties |
| 2007 | £268,924 | 7% |
130 Properties |
| 2006 | £249,105 | 5% |
131 Properties |
| 2005 | £237,743 | 1% |
108 Properties |
| 2004 | £234,206 | 10% |
141 Properties |
| 2003 | £211,319 | 10% |
133 Properties |
| 2002 | £189,233 | 19% |
149 Properties |
| 2001 | £153,465 | 2% |
163 Properties |
| 2000 | £151,115 | 12% |
118 Properties |
| 1999 | £133,364 | 18% |
164 Properties |
| 1998 | £109,643 | 14% |
123 Properties |
| 1997 | £94,558 | 11% |
151 Properties |
| 1996 | £84,478 | 7% |
151 Properties |
| 1995 | £78,869 | - |
91 Properties |
Property Price per Property Type in Town Centre
Here you can find historic sold price data in order to help with your property search.
The average Property Paid Price for specific property types in the last three years are:
| Property Type | Average Sold Price | Sold Properties |
|---|---|---|
| Semi Detached House | £522,366.00 | 15 Semi Detached Houses |
| Detached House | £577,587.00 | 58 Detached Houses |
| Terraced House | £515,541.00 | 55 Terraced Houses |
| Flat | £230,360.00 | 92 Flats |

