
Houses for sale in Shaftesbury, Dorset
House Prices in Shaftesbury
Properties in Shaftesbury have an average house price of £347k and had 661 Property Transactions within the last 3 years.¹
Shaftesbury is an area in Dorset with 5,620 households², where the most expensive property was sold for £1.71M.
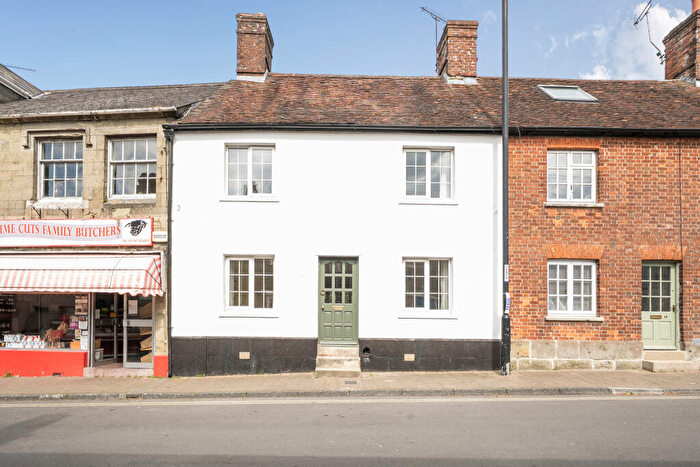
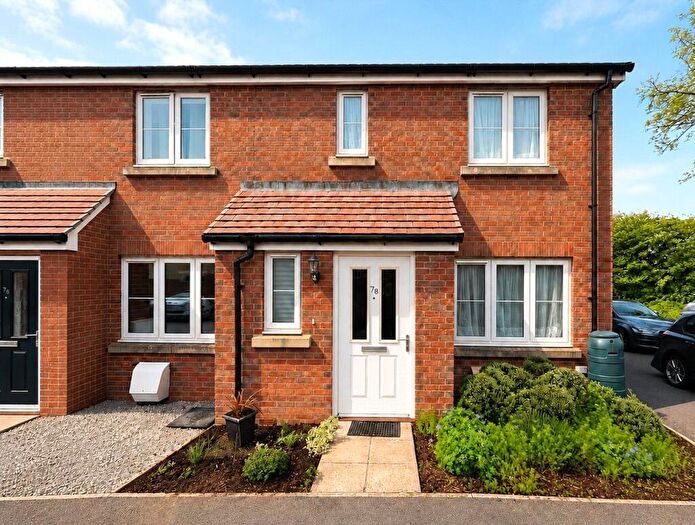
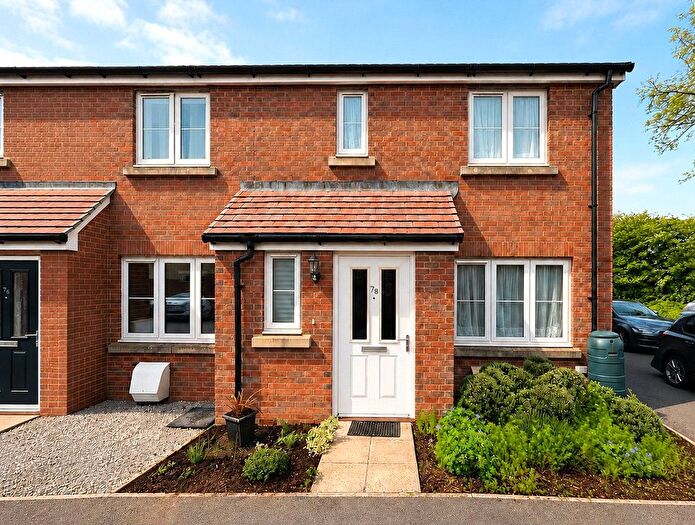
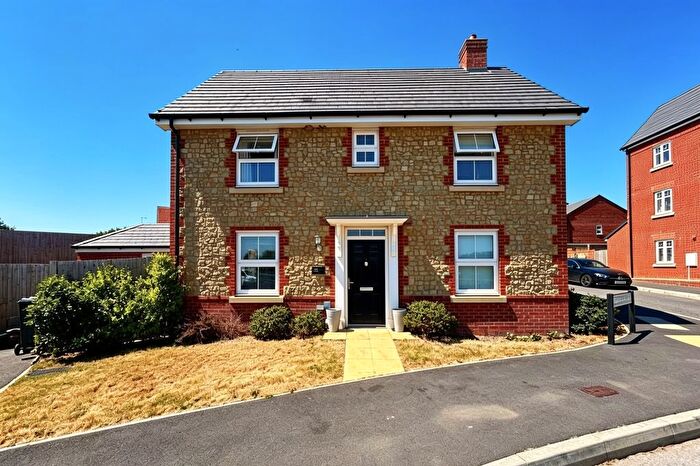
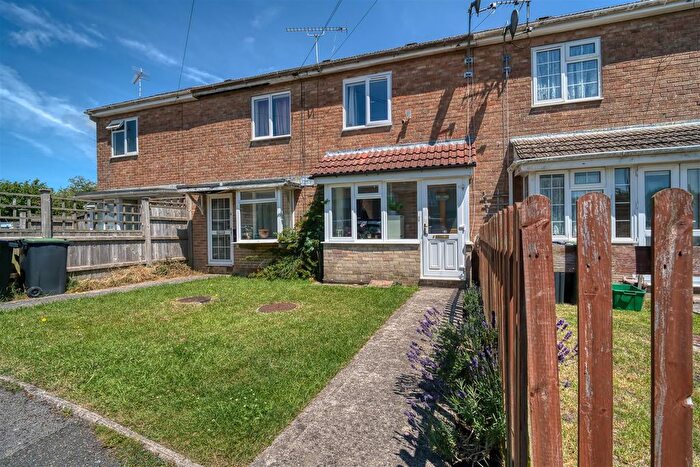
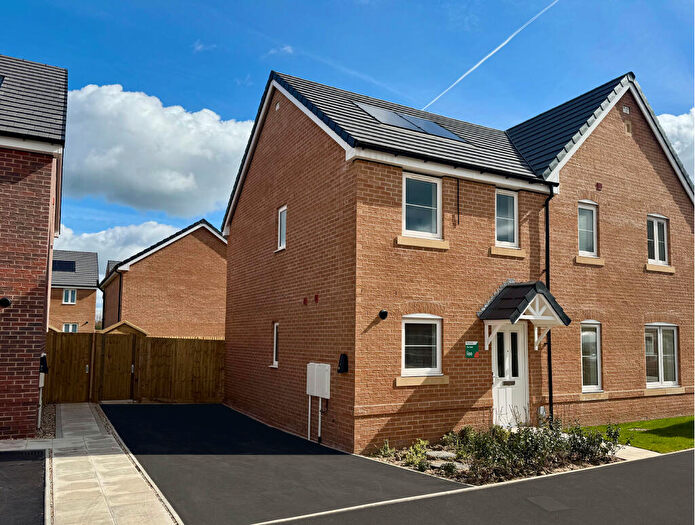
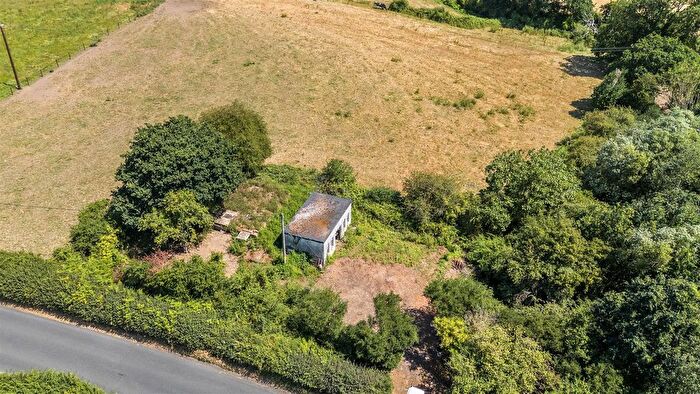
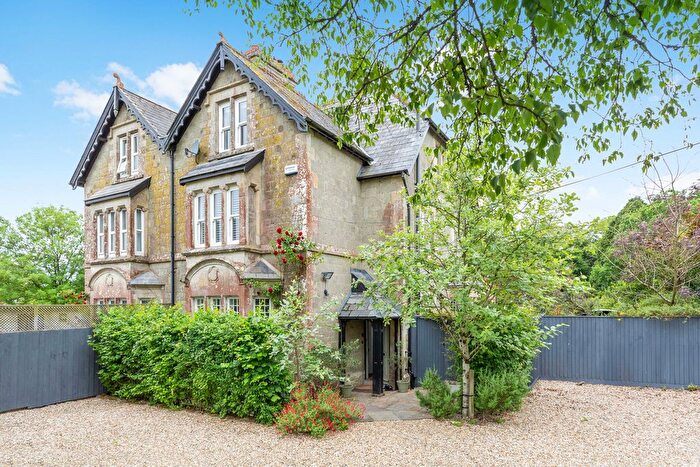
Properties for sale in Shaftesbury
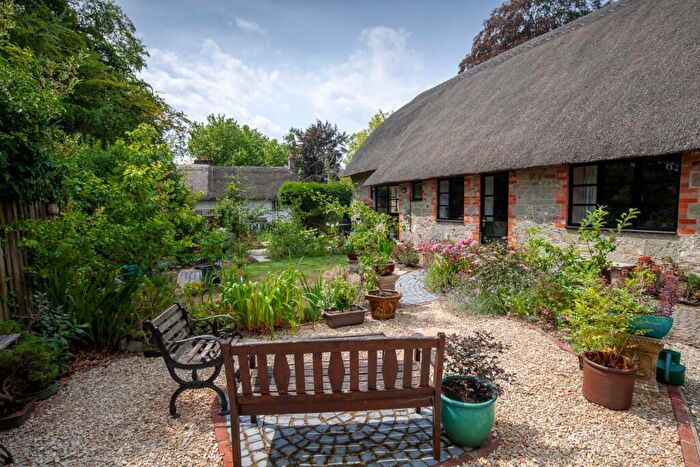


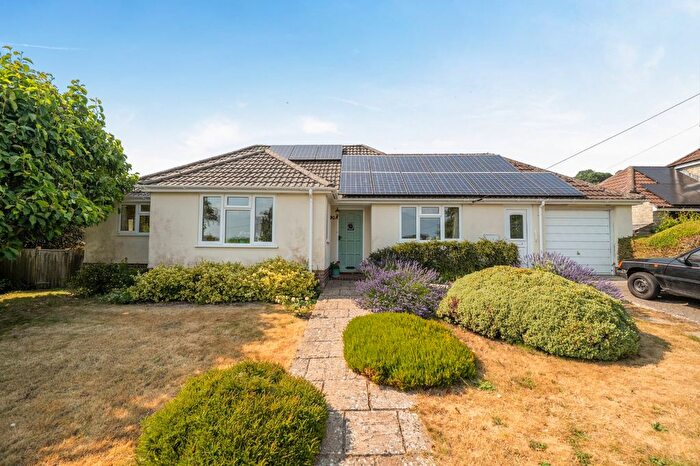
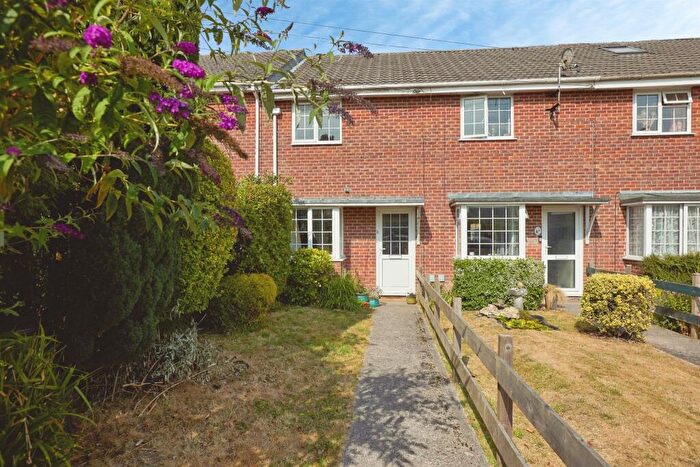
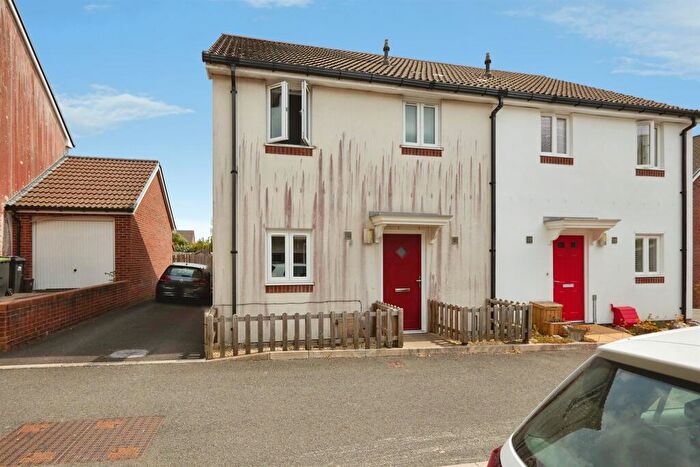
![]()
If you are looking to sell your house, let it out, or receive a property valuation, an expert can help you.
Click the button below to get started.

Neighbourhoods in Shaftesbury
Navigate through our locations to find the location of your next house in Shaftesbury, Dorset for sale or to rent.
Property price trends in Shaftesbury
According to the latest Land Registry data, the average home in Shaftesbury sold for £366,131 in 2026. That figure comes from a substantial record of 7,951 sales logged over the past 31 years.
Prices have continued to climb over the last three years. Compared with 2023, when the typical sale came in around £344,208, that's a rise of roughly 6.4%.
Looking back five years, average prices are up about 11.7% since 2021, a gain of around £38,271 in cash terms.
Zoom out to the past decade for the fuller picture. Back in 2016, homes here averaged £245,397, so the typical sold price has climbed about 49.2% since then, roughly 4.1% a year. Stretch the view to fifteen years and that annual pace eases back to about 3.1%.
Frequently asked questions about Shaftesbury
What is the average price for a property for sale in Shaftesbury?
The average price for a property for sale in Shaftesbury is £347,150. This amount is 12% lower than the average price in Dorset. There are 2,880 property listings for sale in Shaftesbury.
What locations have the most expensive properties for sale in Shaftesbury?
The locations with the most expensive properties for sale in Shaftesbury are The Stours at an average of £595,858, The Beacon at an average of £535,331 and Motcombe And Ham at an average of £463,227.
What locations have the most affordable properties for sale in Shaftesbury?
The locations with the most affordable properties for sale in Shaftesbury are Shaftesbury Grosvenor at an average of £248,613, Shaftesbury Town at an average of £251,915 and Shaftesbury Christys at an average of £278,843.
Which train stations are available in or near Shaftesbury?
Some of the train stations available in or near Shaftesbury are Gillingham (Dorset), Tisbury and Templecombe.
Property Price Paid in Shaftesbury by Year
The average sold property price by year was:
| Year | Average Sold Price | Price Change |
Sold Properties
|
|---|---|---|---|
| 2026 | £366,131 | 6% |
19 Properties |
| 2025 | £345,152 | -1% |
207 Properties |
| 2024 | £350,239 | 2% |
221 Properties |
| 2023 | £344,208 | -19% |
214 Properties |
| 2022 | £407,938 | 20% |
238 Properties |
| 2021 | £327,860 | 3% |
275 Properties |
| 2020 | £317,038 | 18% |
236 Properties |
| 2019 | £260,627 | -6% |
196 Properties |
| 2018 | £277,297 | 2% |
341 Properties |
| 2017 | £272,540 | 10% |
251 Properties |
Property Price per Property Type in Shaftesbury
Here you can find historic sold price data in order to help with your property search.
The average Property Paid Price for specific property types in the last three years are:
| Property Type | Average Sold Price | Sold Properties |
|---|---|---|
| Semi Detached House | £315,102.00 | 159 Semi Detached Houses |
| Detached House | £532,539.00 | 215 Detached Houses |
| Terraced House | £240,086.00 | 212 Terraced Houses |
| Flat | £186,278.00 | 75 Flats |
Transport in Shaftesbury
Please see below transportation links in this area:
