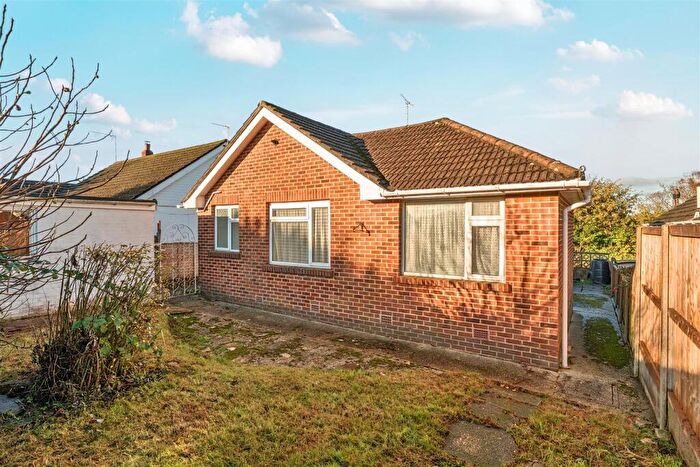
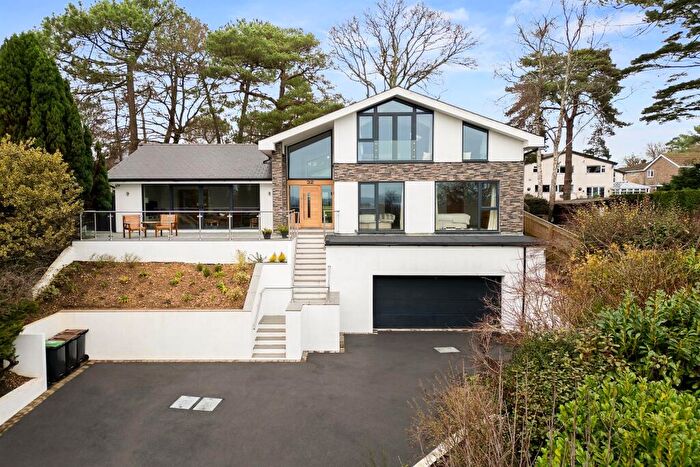
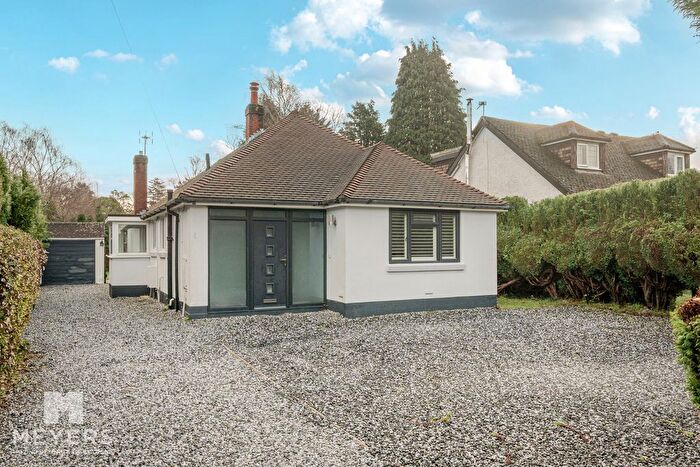
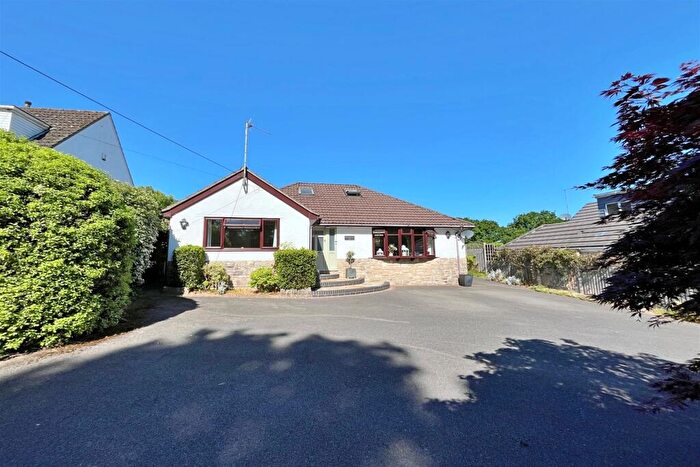
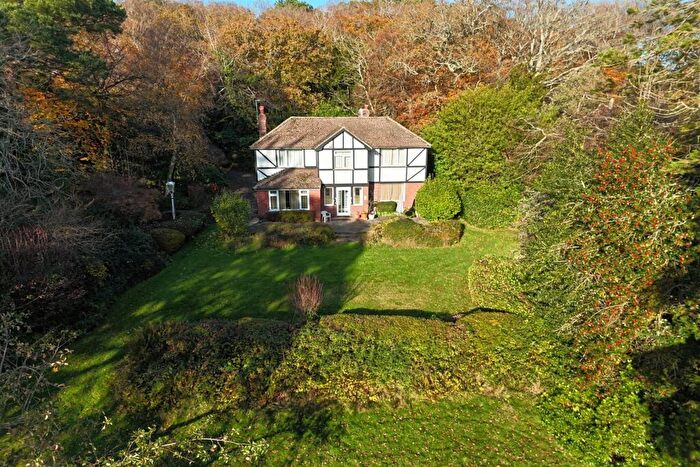
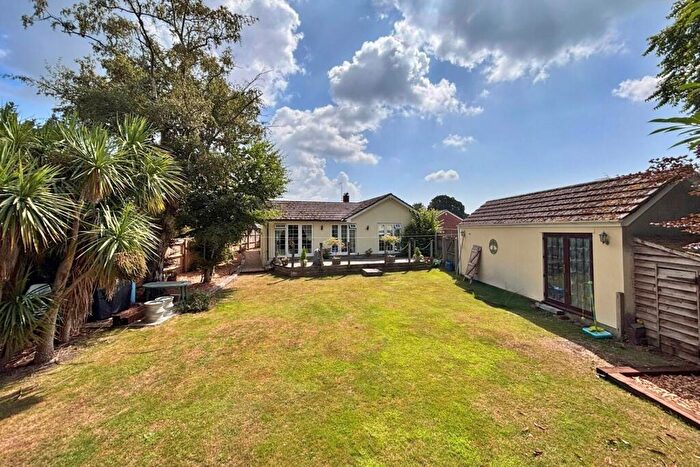
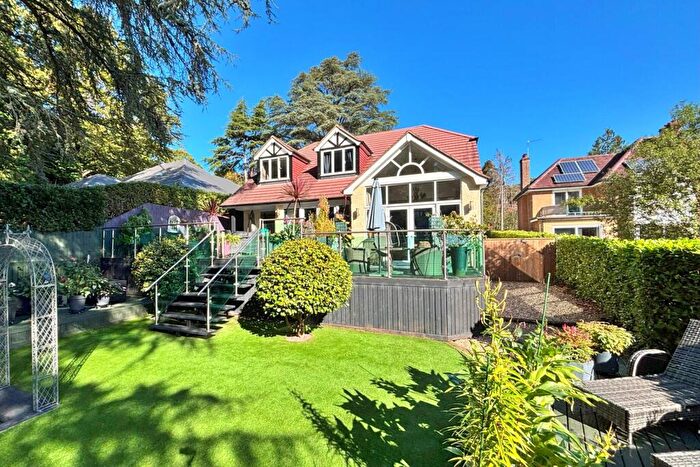
Houses for sale & to rent in Corfe Mullen South, Wimborne
House Prices in Corfe Mullen South
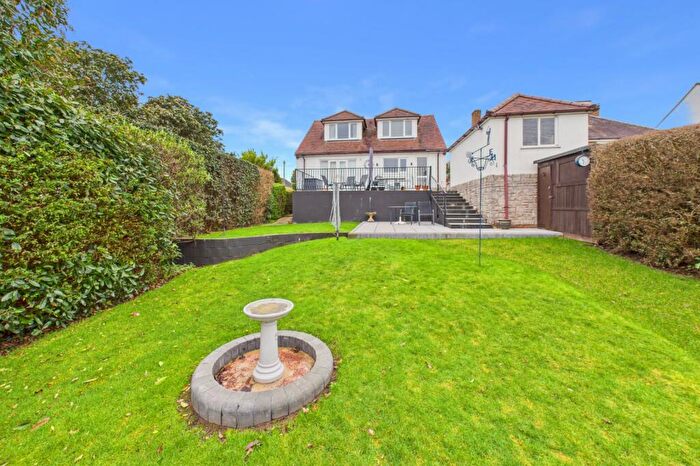
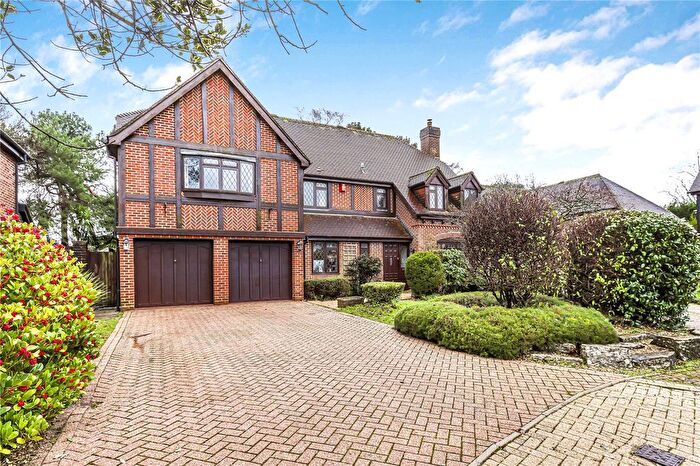
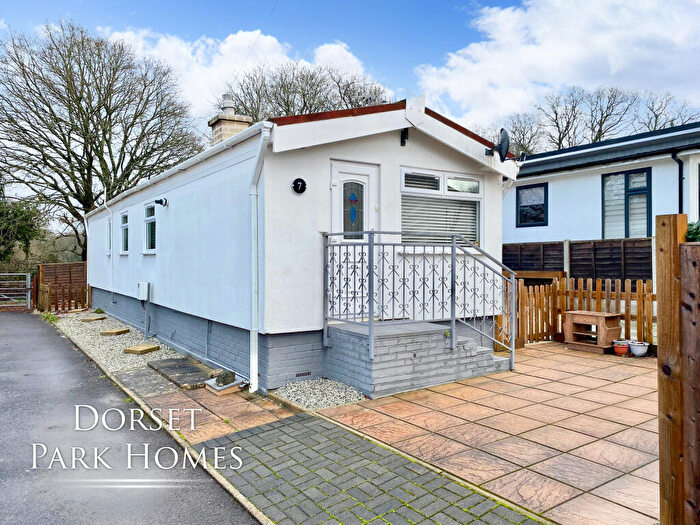
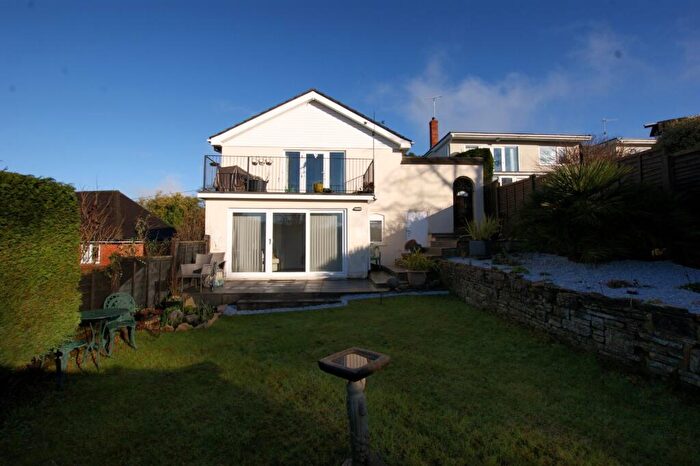
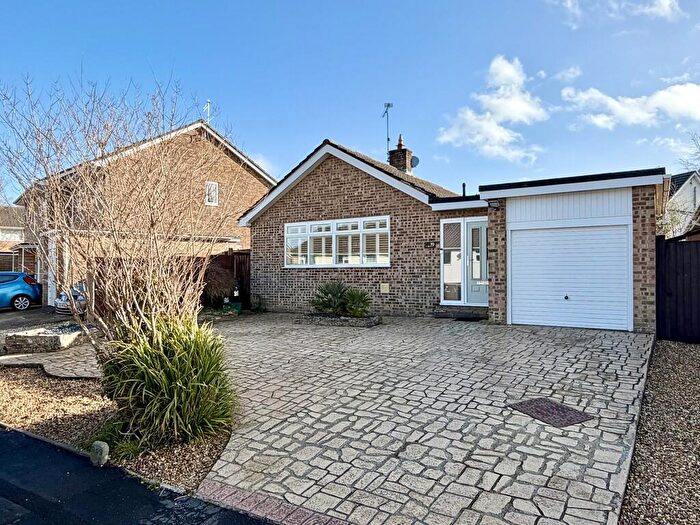
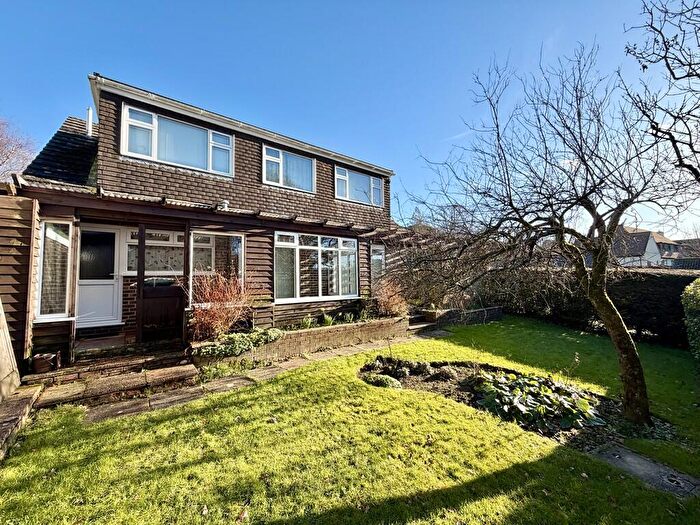
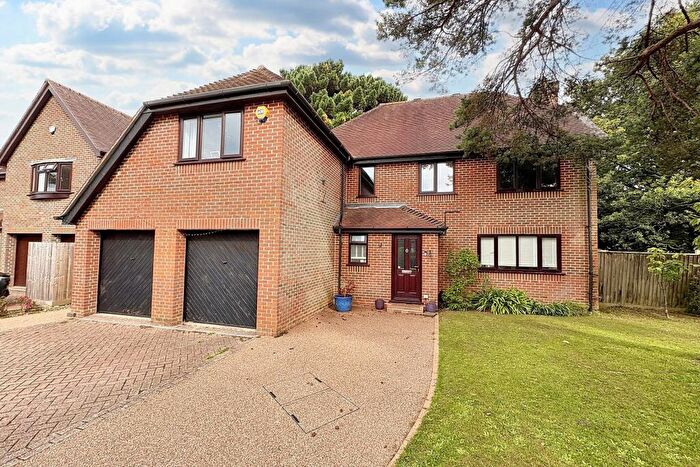
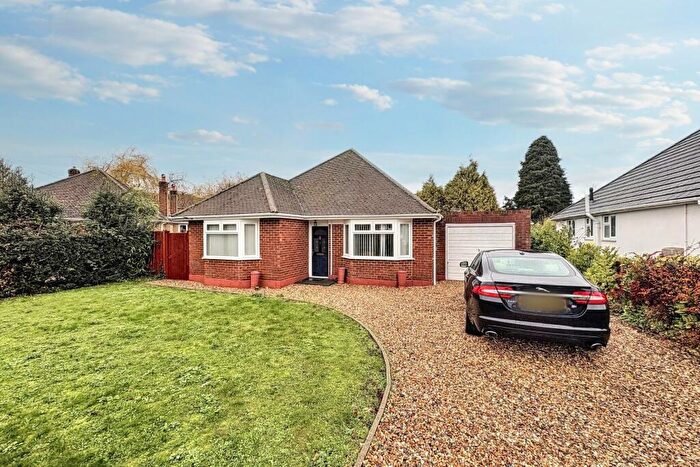
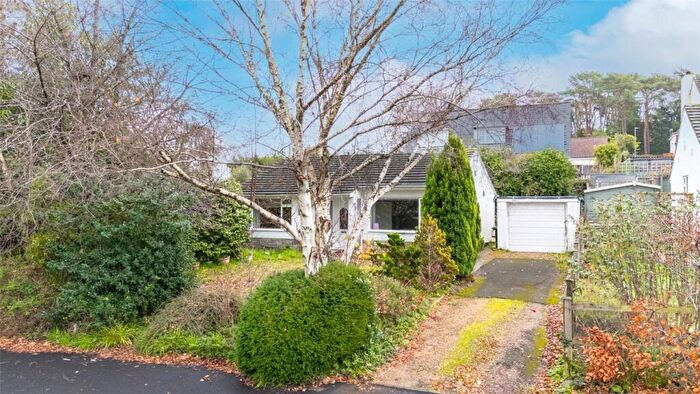
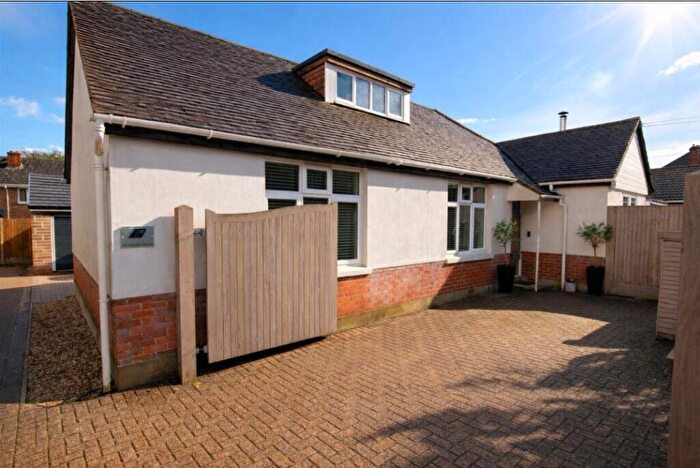
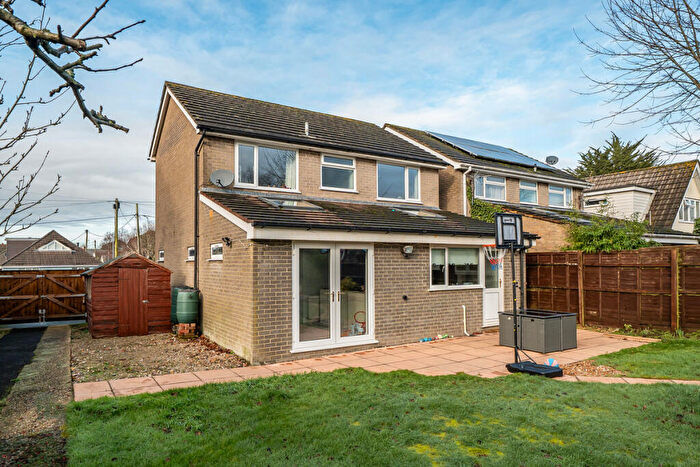
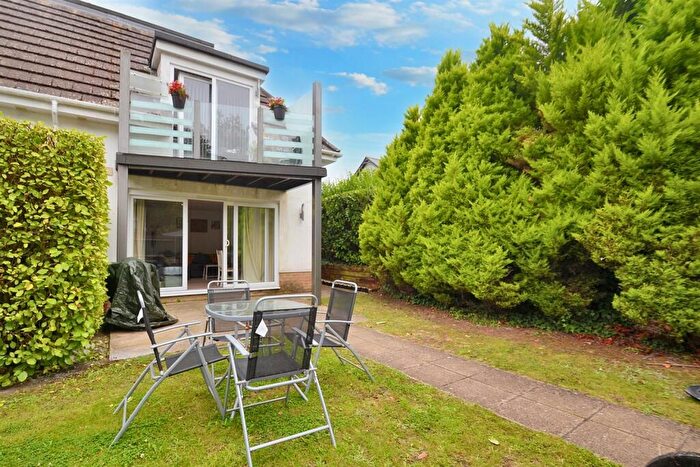
Properties in Corfe Mullen South have an average house price of £393,633.00 and had 63 Property Transactions within the last 3 years¹.
Corfe Mullen South is an area in Wimborne, Dorset with 766 households², where the most expensive property was sold for £835,000.00.
Properties for sale in Corfe Mullen South
Roads and Postcodes in Corfe Mullen South
Navigate through our locations to find the location of your next house in Corfe Mullen South, Wimborne for sale or to rent.
| Streets | Postcodes |
|---|---|
| Amber Road | BH21 3US |
| Beacon Hill Lane | BH21 3RU |
| Colin Close | BH21 3QG |
| Coventry Close | BH21 3UP BH21 3UW |
| Dairy Close | BH21 3UX |
| Dalkeith Road | BH21 3PQ |
| Firside Road | BH21 3LS |
| Froud Way | BH21 3UU |
| Highfield Road | BH21 3PA BH21 3PE |
| Hillside Gardens | BH21 3UL |
| Hillside Mews | BH21 3UQ |
| Hillside Road | BH21 3SA BH21 3SF |
| Ivor Road | BH21 3QF |
| Kiln Close | BH21 3UR |
| Marian Close | BH21 3UH |
| Marian Road | BH21 3UJ |
| Oak Close | BH21 3JJ |
| Rushall Lane | BH21 3RS |
| Springdale Grove | BH21 3QT |
| Springdale Road | BH21 3QJ BH21 3QL BH21 3QN BH21 3QQ |
| Terence Road | BH21 3LT |
| Victoria Close | BH21 3TX |
| Wareham Road | BH21 3LB BH21 3LN BH21 3LW BH21 3RY |
| Waterloo Road | BH21 3SN BH21 3SP BH21 3SW |
| Wickham Drive | BH21 3JT |
| Wills Close | BH21 3SR |
Transport near Corfe Mullen South
- FAQ
- Price Paid By Year
- Property Type Price
Frequently asked questions about Corfe Mullen South
What is the average price for a property for sale in Corfe Mullen South?
The average price for a property for sale in Corfe Mullen South is £393,633. This amount is 12% lower than the average price in Wimborne. There are 761 property listings for sale in Corfe Mullen South.
What streets have the most expensive properties for sale in Corfe Mullen South?
The streets with the most expensive properties for sale in Corfe Mullen South are Wills Close at an average of £815,000, Springdale Road at an average of £625,993 and Ivor Road at an average of £579,666.
What streets have the most affordable properties for sale in Corfe Mullen South?
The streets with the most affordable properties for sale in Corfe Mullen South are Froud Way at an average of £178,725, Amber Road at an average of £281,300 and Marian Road at an average of £287,666.
Which train stations are available in or near Corfe Mullen South?
Some of the train stations available in or near Corfe Mullen South are Hamworthy, Poole and Holton Heath.
Property Price Paid in Corfe Mullen South by Year
The average sold property price by year was:
| Year | Average Sold Price | Price Change |
Sold Properties
|
|---|---|---|---|
| 2025 | £405,102 | 7% |
28 Properties |
| 2024 | £376,110 | -5% |
19 Properties |
| 2023 | £394,371 | -5% |
16 Properties |
| 2022 | £413,617 | 4% |
29 Properties |
| 2021 | £396,691 | -17% |
39 Properties |
| 2020 | £466,019 | 15% |
26 Properties |
| 2019 | £395,000 | 5% |
16 Properties |
| 2018 | £373,898 | 17% |
35 Properties |
| 2017 | £311,575 | -5% |
30 Properties |
| 2016 | £327,381 | 11% |
28 Properties |
| 2015 | £292,864 | -8% |
24 Properties |
| 2014 | £315,875 | 10% |
27 Properties |
| 2013 | £284,595 | 4% |
21 Properties |
| 2012 | £273,964 | 14% |
21 Properties |
| 2011 | £235,270 | -22% |
22 Properties |
| 2010 | £286,000 | 15% |
14 Properties |
| 2009 | £244,325 | -20% |
31 Properties |
| 2008 | £292,132 | -9% |
26 Properties |
| 2007 | £318,189 | 24% |
42 Properties |
| 2006 | £240,650 | -2% |
45 Properties |
| 2005 | £246,115 | 9% |
35 Properties |
| 2004 | £224,617 | 8% |
37 Properties |
| 2003 | £207,269 | 16% |
38 Properties |
| 2002 | £174,409 | 22% |
48 Properties |
| 2001 | £136,259 | -7% |
56 Properties |
| 2000 | £146,294 | 20% |
46 Properties |
| 1999 | £116,340 | 10% |
71 Properties |
| 1998 | £105,164 | 23% |
37 Properties |
| 1997 | £80,674 | -11% |
42 Properties |
| 1996 | £89,709 | 29% |
43 Properties |
| 1995 | £63,858 | - |
47 Properties |
Property Price per Property Type in Corfe Mullen South
Here you can find historic sold price data in order to help with your property search.
The average Property Paid Price for specific property types in the last three years are:
| Property Type | Average Sold Price | Sold Properties |
|---|---|---|
| Semi Detached House | £334,642.00 | 7 Semi Detached Houses |
| Terraced House | £290,960.00 | 25 Terraced Houses |
| Flat | £182,483.00 | 3 Flats |
| Detached House | £522,677.00 | 28 Detached Houses |

