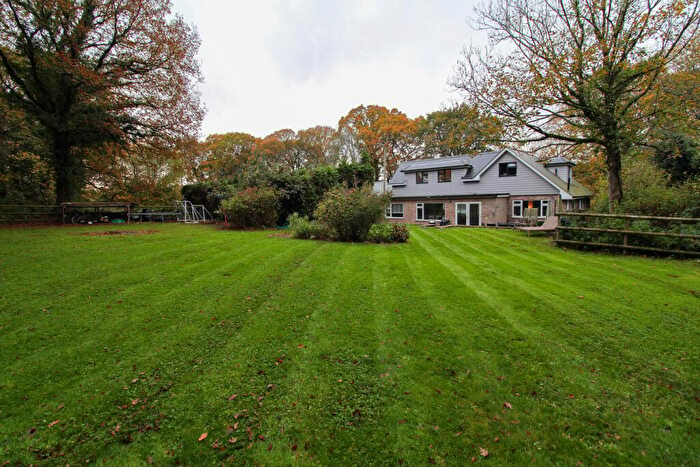
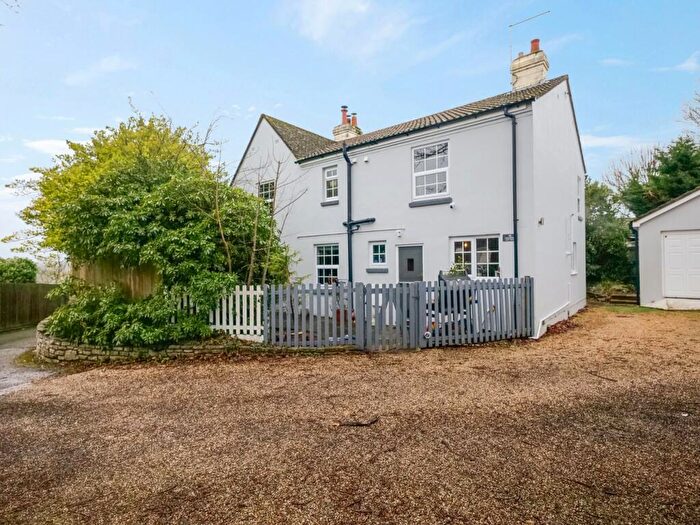
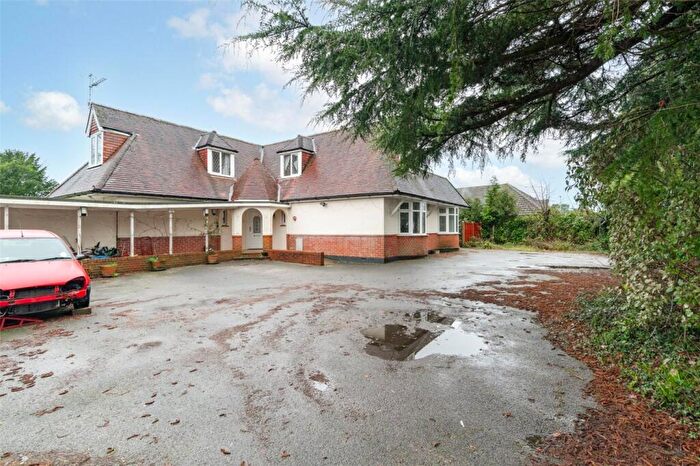
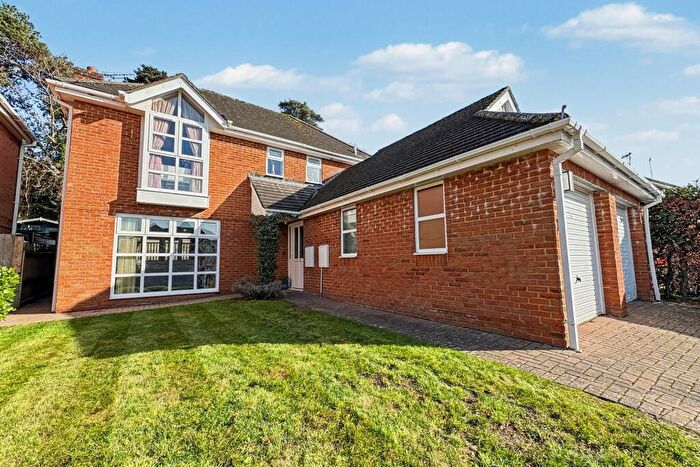
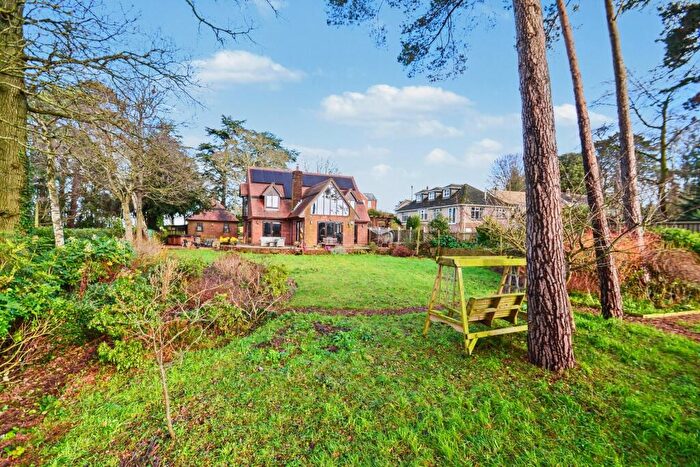
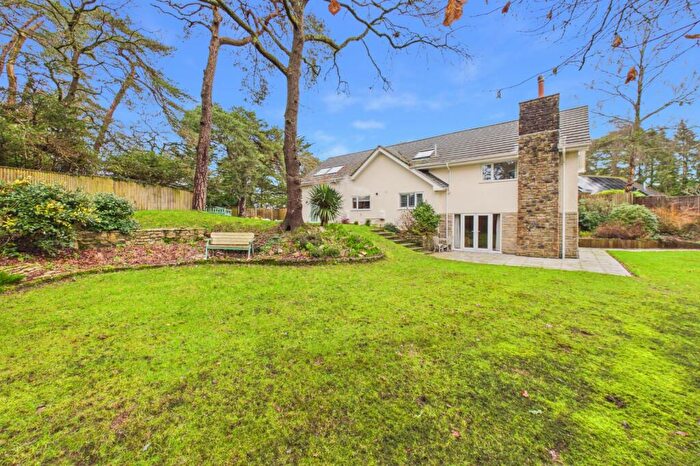
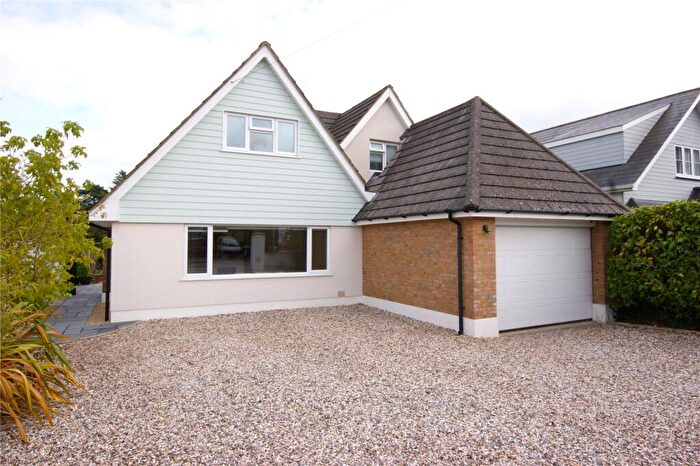
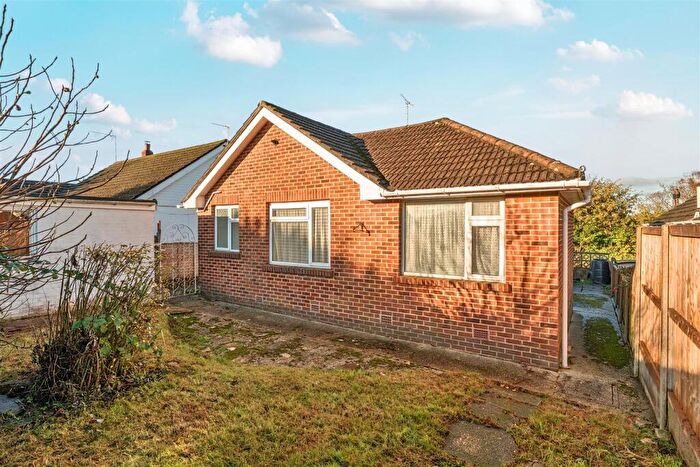
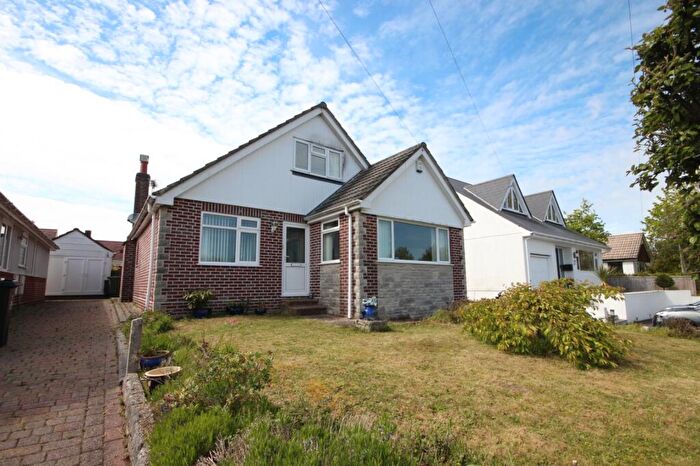
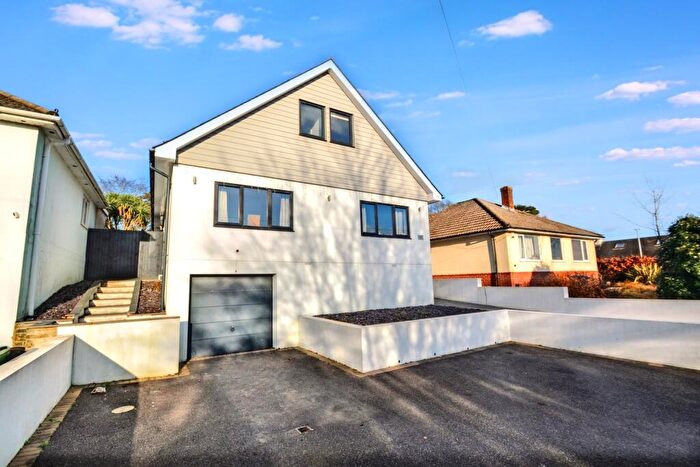
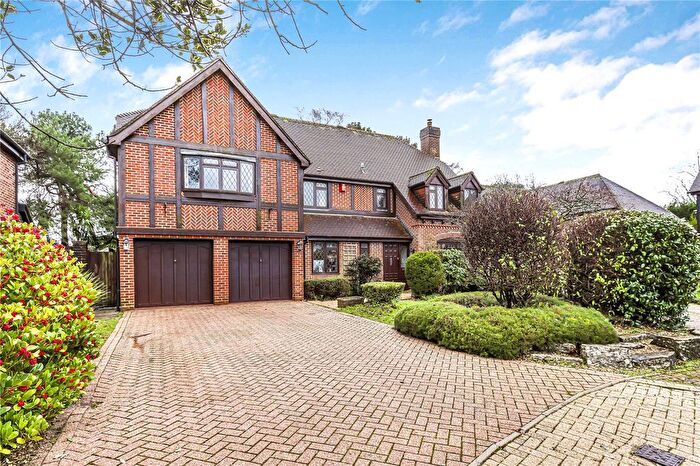
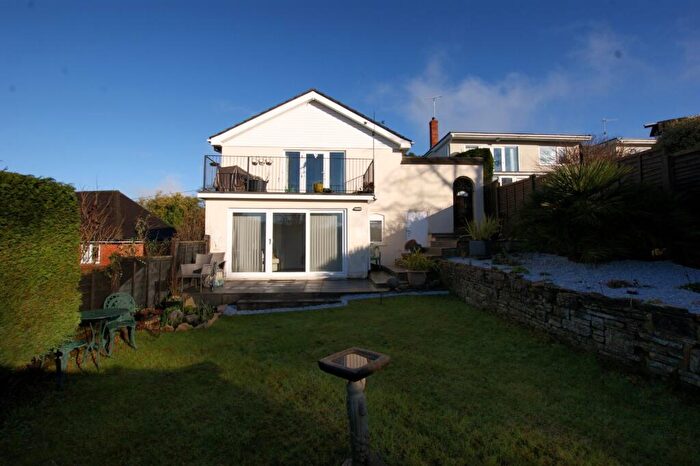
Houses for sale & to rent in Corfe Mullen Central, Wimborne
House Prices in Corfe Mullen Central
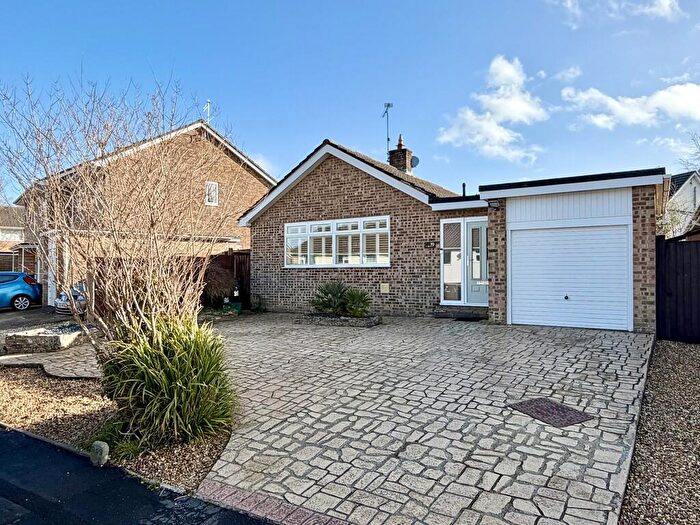
Properties in Corfe Mullen Central have an average house price of £397,988.00 and had 175 Property Transactions within the last 3 years¹.
Corfe Mullen Central is an area in Wimborne, Dorset with 1,959 households², where the most expensive property was sold for £935,000.00.
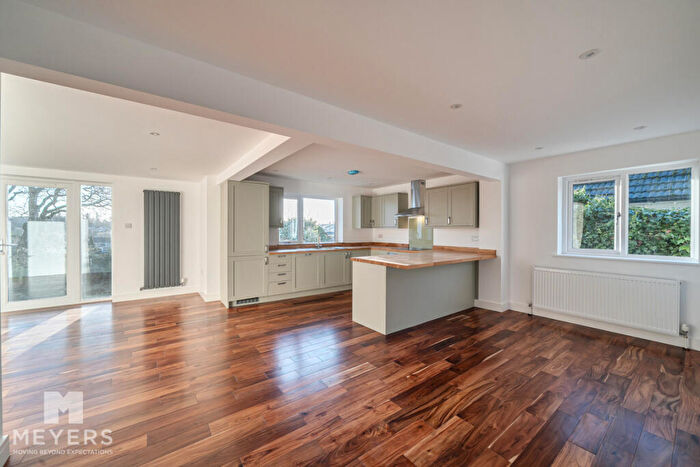
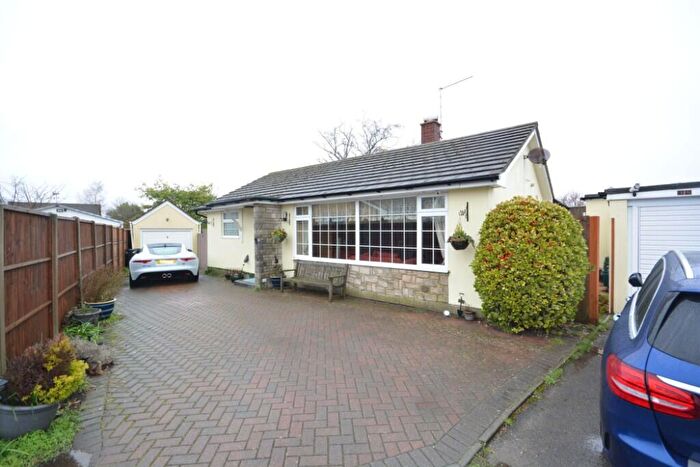
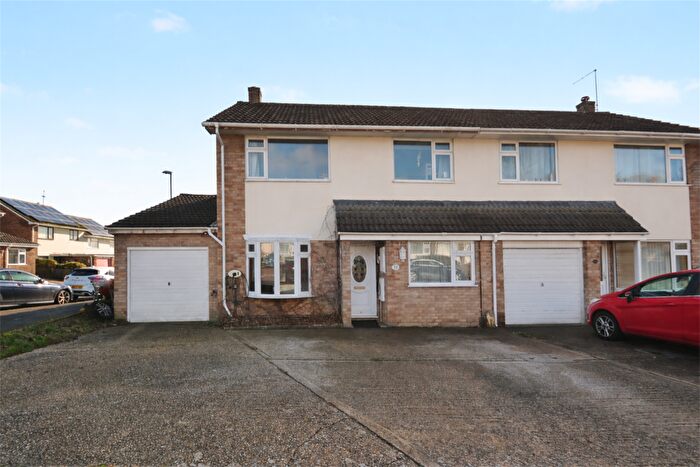
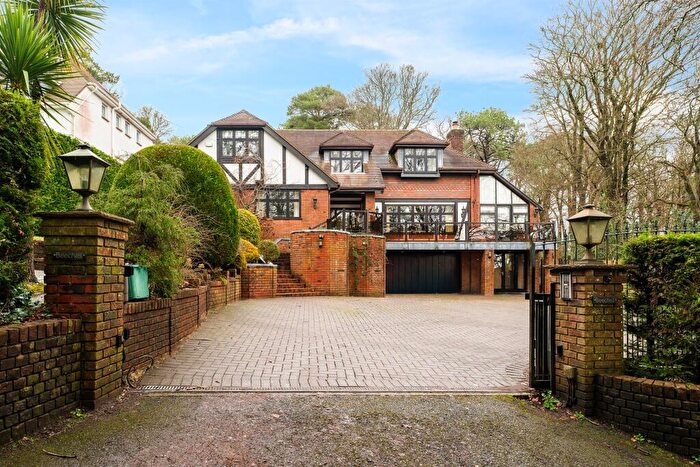
Properties for sale in Corfe Mullen Central
Roads and Postcodes in Corfe Mullen Central
Navigate through our locations to find the location of your next house in Corfe Mullen Central, Wimborne for sale or to rent.
| Streets | Postcodes |
|---|---|
| Albert Road | BH21 3QB BH21 3QD BH21 3QE |
| Bakers View | BH21 3JS |
| Birch Close | BH21 3TB |
| Blacksmith Close | BH21 3QW |
| Blandford Road | BH21 3HD |
| Blaney Way | BH21 3UG |
| Blythe Road | BH21 3LP BH21 3LR |
| Brook Lane | BH21 3RD BH21 3UD |
| Brownsea Avenue | BH21 3ND |
| Cecil Close | BH21 3PW |
| Central Avenue | BH21 3JD |
| Chapel Close | BH21 3SH |
| Chapel Lane | BH21 3SL |
| Corfe View Road | BH21 3LY BH21 3LZ BH21 3NA |
| Croft Close | BH21 3JE |
| Dennis Road | BH21 3NF |
| Diprose Road | BH21 3QY |
| East Way | BH21 3NG |
| Erica Drive | BH21 3TQ |
| Gorse Road | BH21 3SJ |
| Gurney Road | BH21 3NQ |
| Hamilton Road | BH21 3PH |
| Hanham Road | BH21 3PX BH21 3PY BH21 3PZ |
| Haven Road | BH21 3SY |
| Heather Close | BH21 3PP |
| Heckford Road | BH21 3LU |
| Henbury Close | BH21 3TF |
| Henbury Rise | BH21 3TE |
| Henbury View Road | BH21 3TA BH21 3TG BH21 3TP BH21 3TT |
| Highfield Close | BH21 3PJ |
| Highfield Road | BH21 3PB BH21 3PD BH21 3PF BH21 3PG |
| Highmoor Close | BH21 3PU |
| Highmoor Road | BH21 3PT |
| Hillcrest Road | BH21 3LX |
| Hillside Road | BH21 3SB BH21 3SD BH21 3SE BH21 3SG BH21 3TR BH21 3TS |
| Hilltop Road | BH21 3PR BH21 3PS |
| Jubilee Close | BH21 3BN |
| Jubilee Road | BH21 3NH BH21 3NJ BH21 3TJ |
| Laurel Close | BH21 3TD |
| Link Rise | BH21 3QP |
| Louise Court | BH21 3BU |
| Moorside Road | BH21 3NB |
| Olivia Close | BH21 3BX |
| Phelipps Road | BH21 3NL BH21 3NN BH21 3NP BH21 3NR BH21 3NS BH21 3NW |
| Primrose Way | BH21 3NT |
| Pye Close | BH21 3NU |
| Queens Road | BH21 3NE |
| Ralph Road | BH21 3NX |
| Rushcombe Way | BH21 3QR BH21 3QS BH21 3QU BH21 3QX |
| South Road | BH21 3HY BH21 3HZ BH21 3JA BH21 3JQ |
| Southlands Avenue | BH21 3JB |
| Southlands Close | BH21 3JL |
| Thornton Close | BH21 3TU |
| Towers Farm | BH21 3NY |
| Viewside Close | BH21 3ST |
| Wareham Road | BH21 3JU BH21 3JX BH21 3JY BH21 3JZ BH21 3LA BH21 3LG BH21 3LH BH21 3LJ BH21 3LL BH21 3LQ |
| Warland Way | BH21 3NZ BH21 3TH |
| Wayman Road | BH21 3PL BH21 3PN |
| Windgreen | BH21 3HX |
| Wyatts Close | BH21 3SX |
| Wyatts Lane | BH21 3SQ BH21 3UE |
Transport near Corfe Mullen Central
- FAQ
- Price Paid By Year
- Property Type Price
Frequently asked questions about Corfe Mullen Central
What is the average price for a property for sale in Corfe Mullen Central?
The average price for a property for sale in Corfe Mullen Central is £397,988. This amount is 11% lower than the average price in Wimborne. There are 1,136 property listings for sale in Corfe Mullen Central.
What streets have the most expensive properties for sale in Corfe Mullen Central?
The streets with the most expensive properties for sale in Corfe Mullen Central are Brook Lane at an average of £770,000, Blythe Road at an average of £545,040 and Highfield Close at an average of £542,500.
What streets have the most affordable properties for sale in Corfe Mullen Central?
The streets with the most affordable properties for sale in Corfe Mullen Central are Wayman Road at an average of £184,000, Louise Court at an average of £190,000 and Laurel Close at an average of £204,500.
Which train stations are available in or near Corfe Mullen Central?
Some of the train stations available in or near Corfe Mullen Central are Hamworthy, Poole and Parkstone.
Property Price Paid in Corfe Mullen Central by Year
The average sold property price by year was:
| Year | Average Sold Price | Price Change |
Sold Properties
|
|---|---|---|---|
| 2025 | £377,248 | 1% |
56 Properties |
| 2024 | £373,587 | -18% |
57 Properties |
| 2023 | £439,153 | 8% |
62 Properties |
| 2022 | £404,961 | 4% |
84 Properties |
| 2021 | £388,258 | 16% |
94 Properties |
| 2020 | £327,036 | -2% |
73 Properties |
| 2019 | £332,023 | 4% |
73 Properties |
| 2018 | £318,523 | -0,3% |
73 Properties |
| 2017 | £319,457 | 6% |
97 Properties |
| 2016 | £300,639 | 4% |
112 Properties |
| 2015 | £288,195 | 1% |
93 Properties |
| 2014 | £286,483 | 15% |
89 Properties |
| 2013 | £244,303 | 2% |
84 Properties |
| 2012 | £238,746 | -3% |
75 Properties |
| 2011 | £245,759 | 2% |
86 Properties |
| 2010 | £240,979 | 17% |
82 Properties |
| 2009 | £200,087 | -16% |
60 Properties |
| 2008 | £231,172 | -10% |
61 Properties |
| 2007 | £253,819 | 12% |
116 Properties |
| 2006 | £222,882 | 3% |
137 Properties |
| 2005 | £216,841 | 1% |
95 Properties |
| 2004 | £214,686 | 11% |
117 Properties |
| 2003 | £191,440 | 10% |
134 Properties |
| 2002 | £173,156 | 30% |
130 Properties |
| 2001 | £121,917 | 10% |
115 Properties |
| 2000 | £109,882 | 11% |
94 Properties |
| 1999 | £98,323 | 4% |
124 Properties |
| 1998 | £93,920 | 14% |
104 Properties |
| 1997 | £80,551 | 16% |
132 Properties |
| 1996 | £67,383 | 9% |
100 Properties |
| 1995 | £61,207 | - |
78 Properties |
Property Price per Property Type in Corfe Mullen Central
Here you can find historic sold price data in order to help with your property search.
The average Property Paid Price for specific property types in the last three years are:
| Property Type | Average Sold Price | Sold Properties |
|---|---|---|
| Semi Detached House | £366,656.00 | 24 Semi Detached Houses |
| Detached House | £508,230.00 | 84 Detached Houses |
| Terraced House | £339,492.00 | 35 Terraced Houses |
| Flat | £196,078.00 | 32 Flats |

