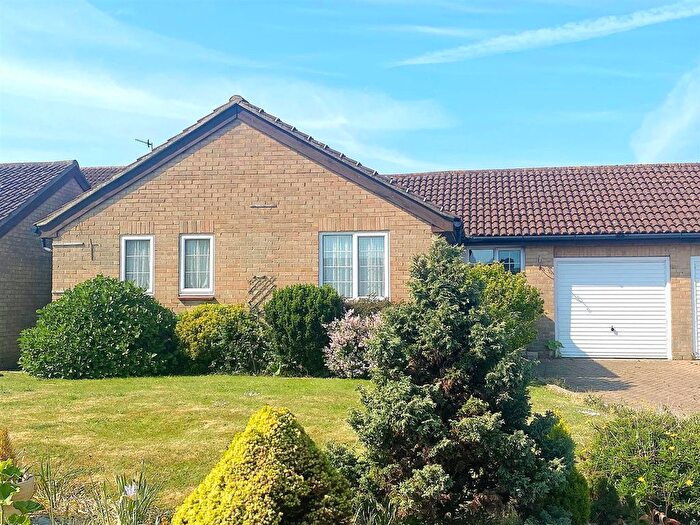
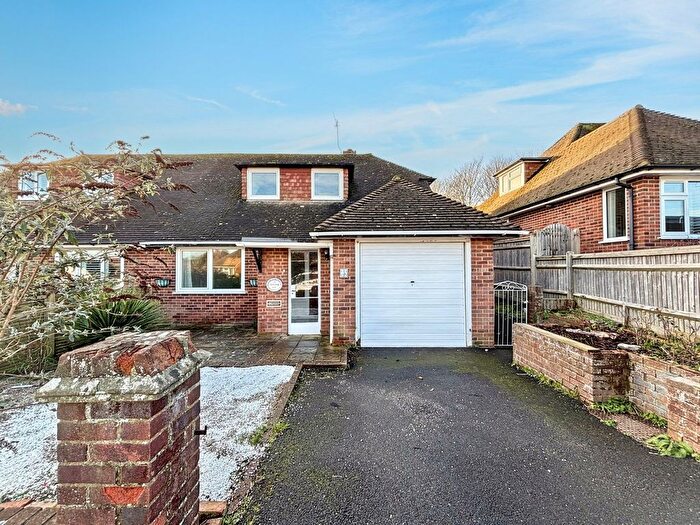
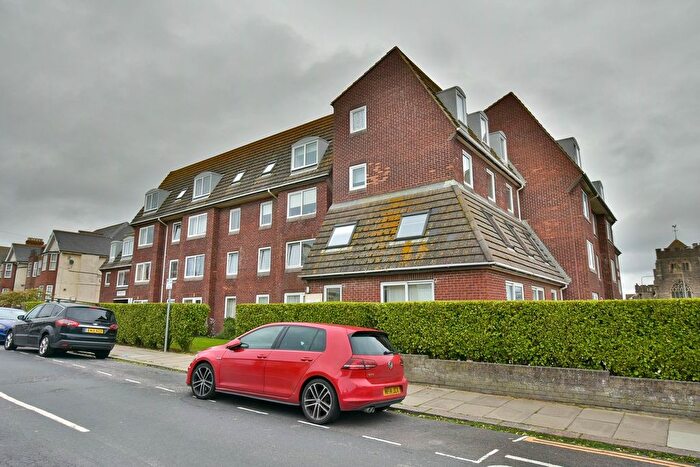
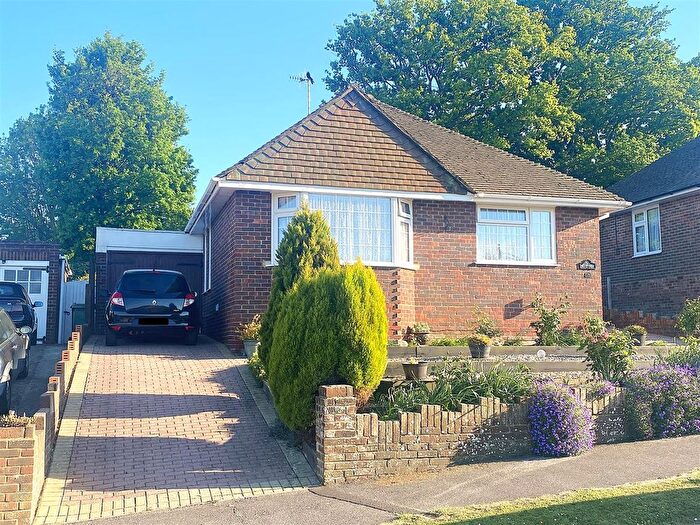
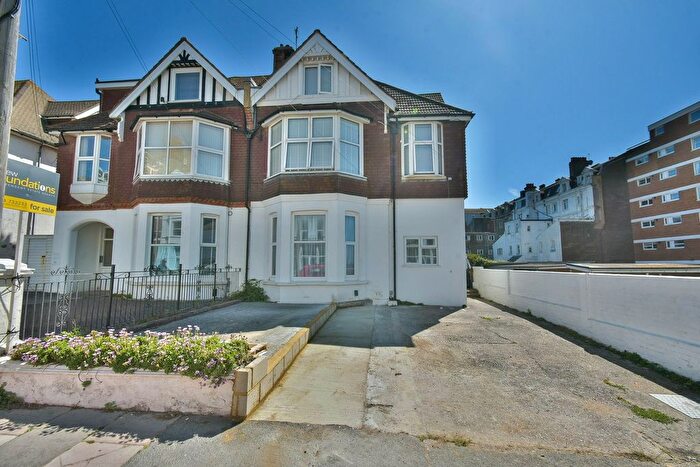
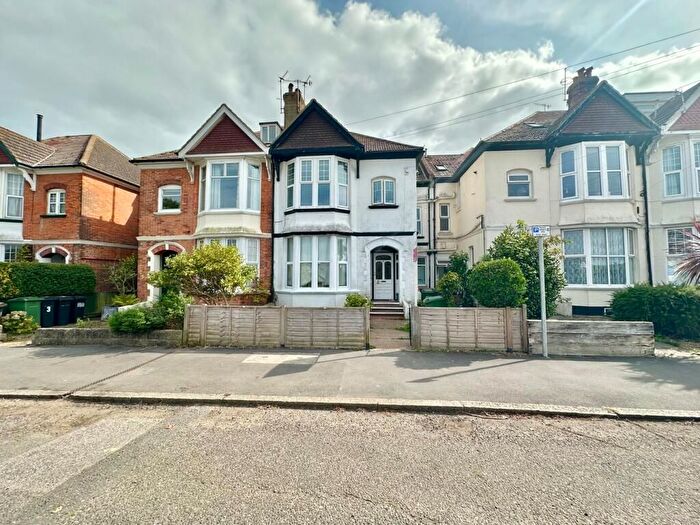
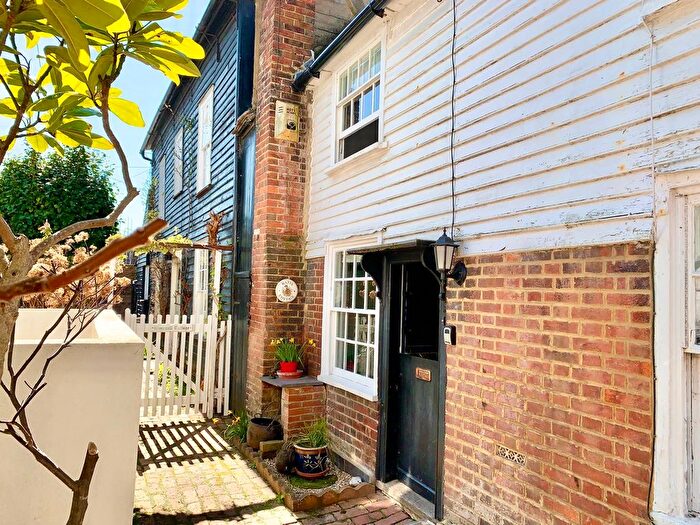
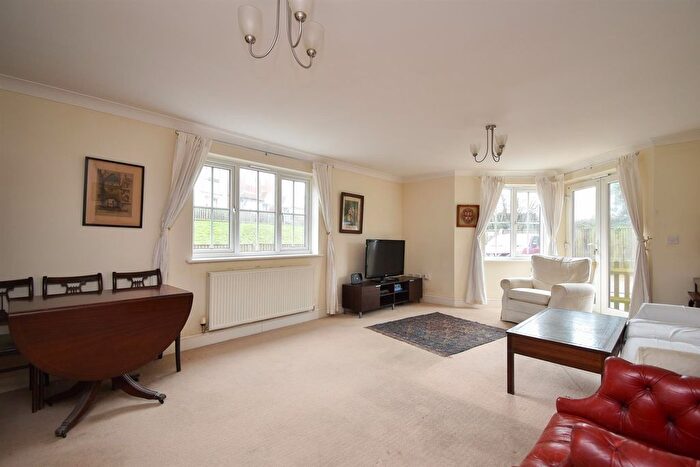
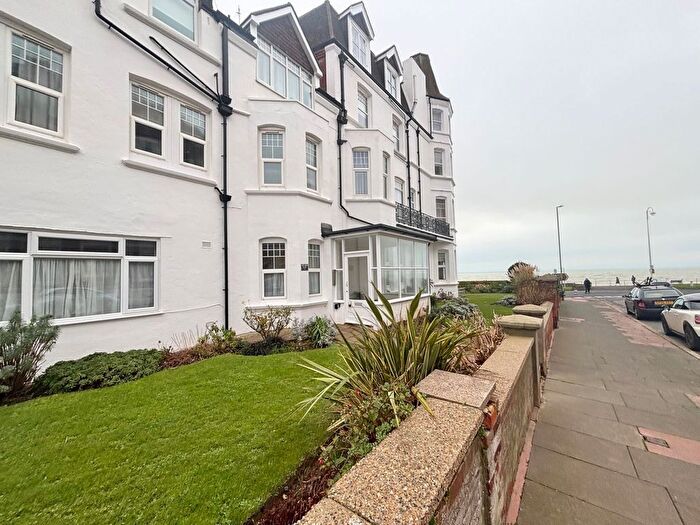
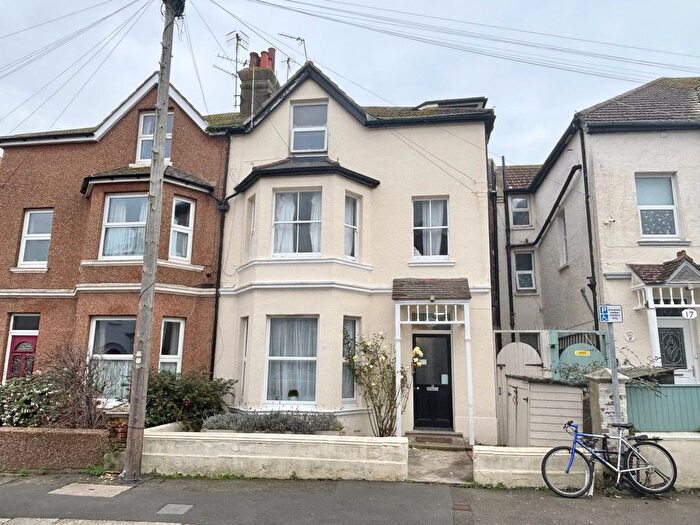
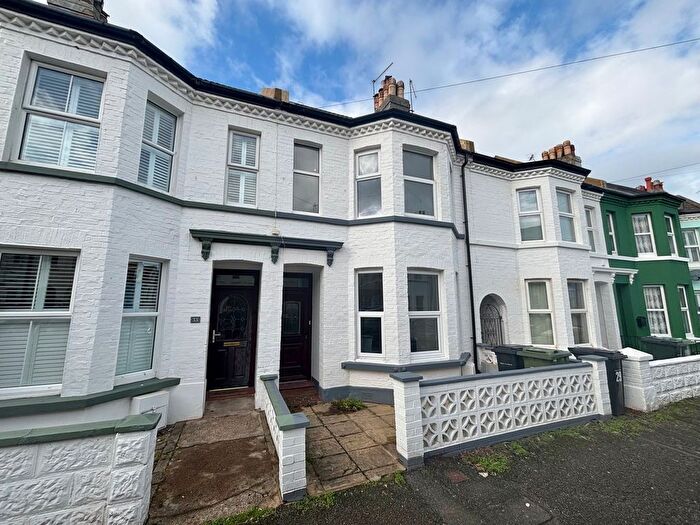
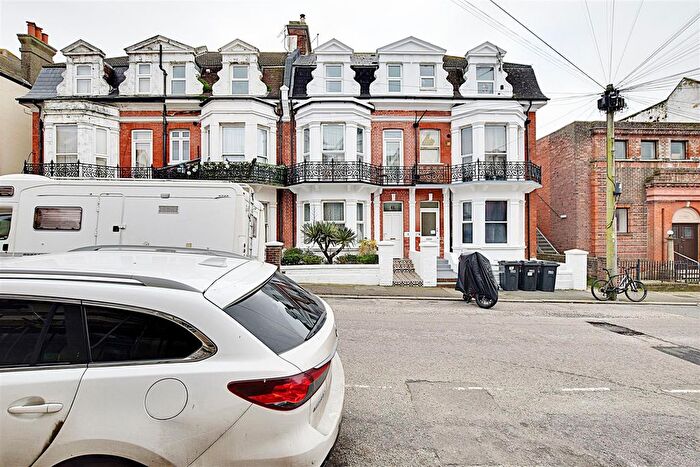
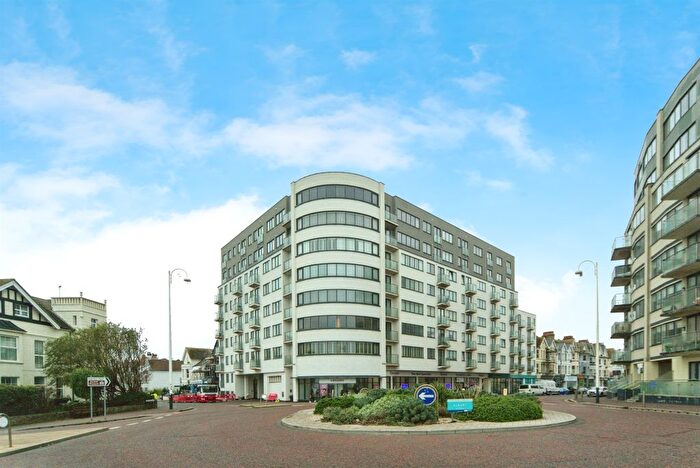
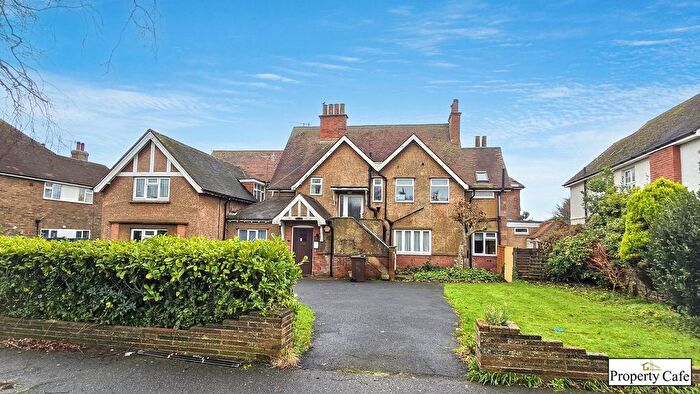
Houses for sale & to rent in Central, Bexhill-on-sea
House Prices in Central
Properties in Central have an average house price of £223,529.00 and had 509 Property Transactions within the last 3 years¹.
Central is an area in Bexhill-on-sea, East Sussex with 2,889 households², where the most expensive property was sold for £1,100,000.00.
Properties for sale in Central
Roads and Postcodes in Central
Navigate through our locations to find the location of your next house in Central, Bexhill-on-sea for sale or to rent.
Transport near Central
- FAQ
- Price Paid By Year
- Property Type Price
Frequently asked questions about Central
What is the average price for a property for sale in Central?
The average price for a property for sale in Central is £223,529. This amount is 34% lower than the average price in Bexhill-on-sea. There are 2,095 property listings for sale in Central.
What streets have the most expensive properties for sale in Central?
The streets with the most expensive properties for sale in Central are Millfield Rise at an average of £506,000, Larkhill at an average of £397,470 and New Park Avenue at an average of £386,566.
What streets have the most affordable properties for sale in Central?
The streets with the most affordable properties for sale in Central are Western Mews at an average of £125,000, Cranfield Road at an average of £137,115 and St Leonards Road at an average of £152,329.
Which train stations are available in or near Central?
Some of the train stations available in or near Central are Bexhill, Collington and Cooden Beach.
Property Price Paid in Central by Year
The average sold property price by year was:
| Year | Average Sold Price | Price Change |
Sold Properties
|
|---|---|---|---|
| 2025 | £218,074 | -4% |
75 Properties |
| 2024 | £226,277 | 5% |
135 Properties |
| 2023 | £214,746 | -7% |
127 Properties |
| 2022 | £230,236 | 6% |
172 Properties |
| 2021 | £216,358 | 13% |
208 Properties |
| 2020 | £187,943 | 0,4% |
132 Properties |
| 2019 | £187,104 | 6% |
152 Properties |
| 2018 | £176,151 | -1% |
181 Properties |
| 2017 | £177,972 | 15% |
213 Properties |
| 2016 | £151,938 | -1% |
213 Properties |
| 2015 | £153,715 | 3% |
231 Properties |
| 2014 | £149,011 | 5% |
236 Properties |
| 2013 | £141,560 | -1% |
168 Properties |
| 2012 | £142,310 | 1% |
130 Properties |
| 2011 | £140,611 | -0,2% |
104 Properties |
| 2010 | £140,825 | 3% |
121 Properties |
| 2009 | £136,071 | -9% |
125 Properties |
| 2008 | £148,817 | -3% |
129 Properties |
| 2007 | £152,841 | 14% |
327 Properties |
| 2006 | £130,757 | 3% |
266 Properties |
| 2005 | £126,262 | 4% |
211 Properties |
| 2004 | £120,779 | 9% |
301 Properties |
| 2003 | £110,213 | 22% |
213 Properties |
| 2002 | £86,496 | 19% |
277 Properties |
| 2001 | £70,096 | 16% |
283 Properties |
| 2000 | £58,721 | 18% |
258 Properties |
| 1999 | £48,342 | 6% |
292 Properties |
| 1998 | £45,438 | 4% |
218 Properties |
| 1997 | £43,747 | 5% |
216 Properties |
| 1996 | £41,625 | -3% |
206 Properties |
| 1995 | £43,000 | - |
155 Properties |
Property Price per Property Type in Central
Here you can find historic sold price data in order to help with your property search.
The average Property Paid Price for specific property types in the last three years are:
| Property Type | Average Sold Price | Sold Properties |
|---|---|---|
| Semi Detached House | £387,023.00 | 17 Semi Detached Houses |
| Detached House | £515,450.00 | 11 Detached Houses |
| Terraced House | £354,407.00 | 77 Terraced Houses |
| Flat | £183,756.00 | 404 Flats |

