
Houses for sale & to rent in Sidley, Bexhill-on-sea
House Prices in Sidley
Properties in Sidley have an average house price of £312,616.00 and had 240 Property Transactions within the last 3 years¹.
Sidley is an area in Bexhill-on-sea, East Sussex with 2,293 households², where the most expensive property was sold for £1,025,000.00.
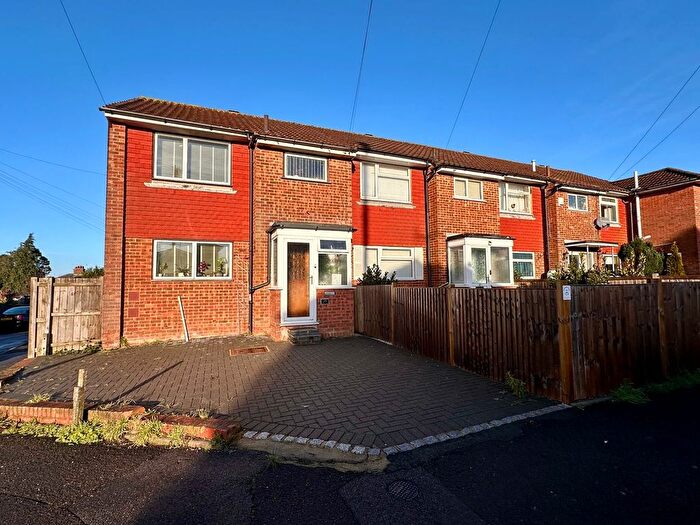
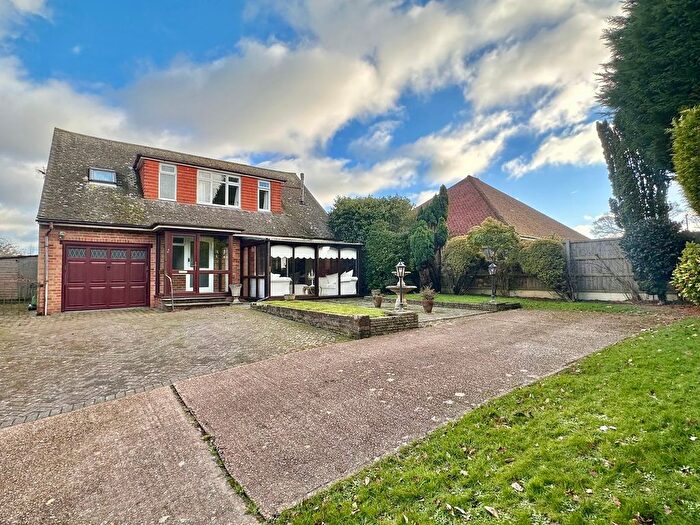
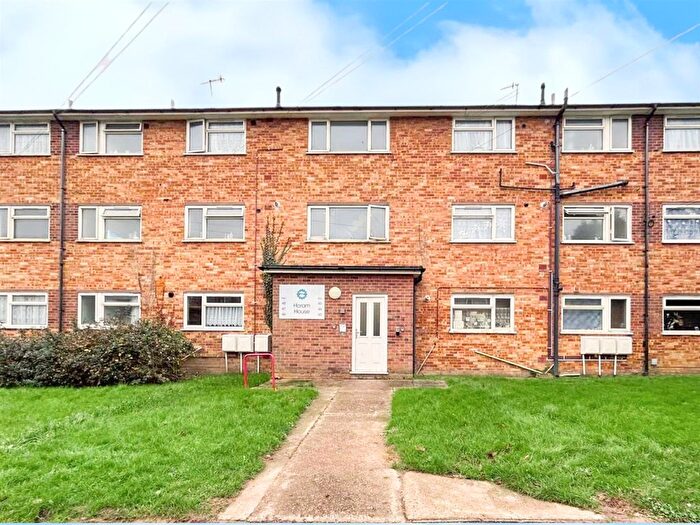
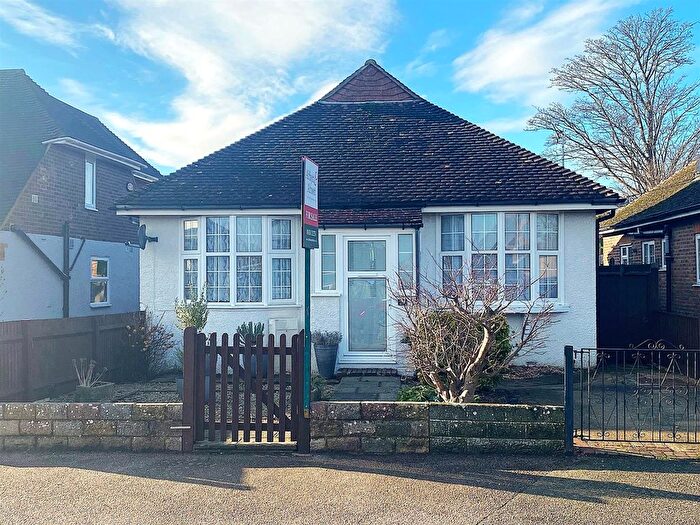
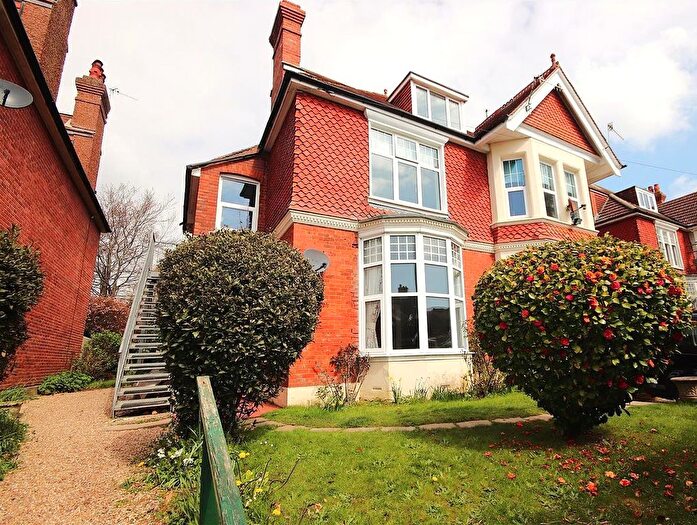
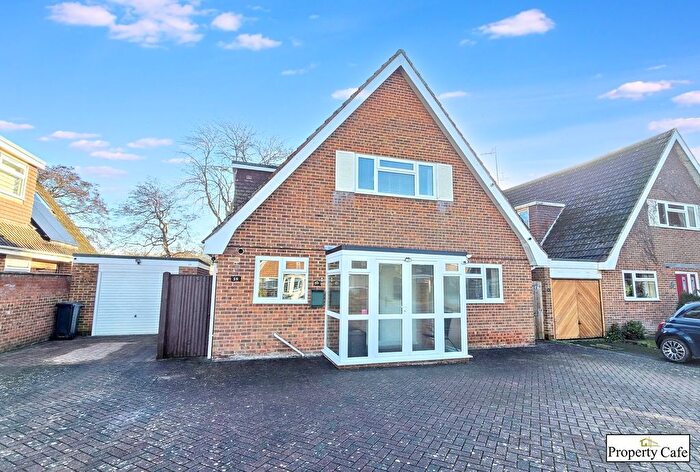
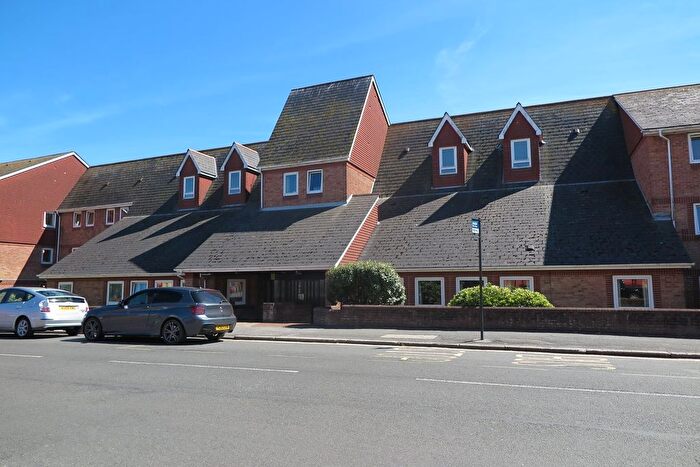
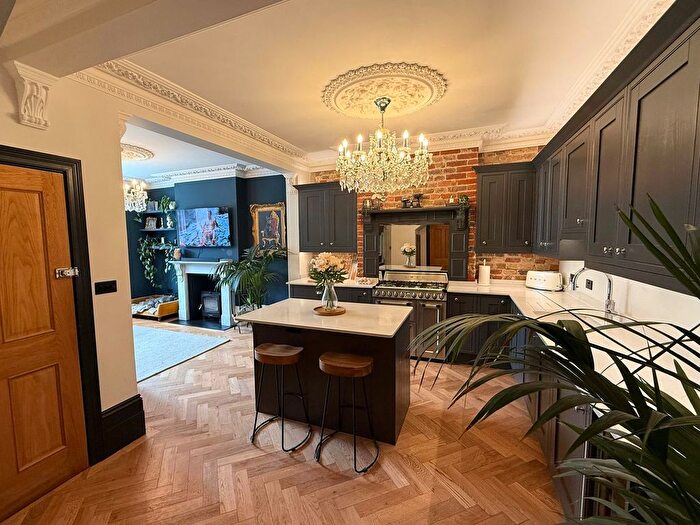
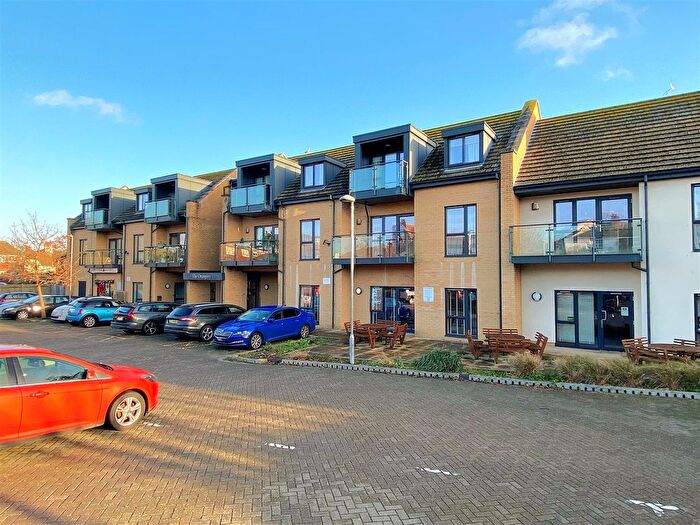
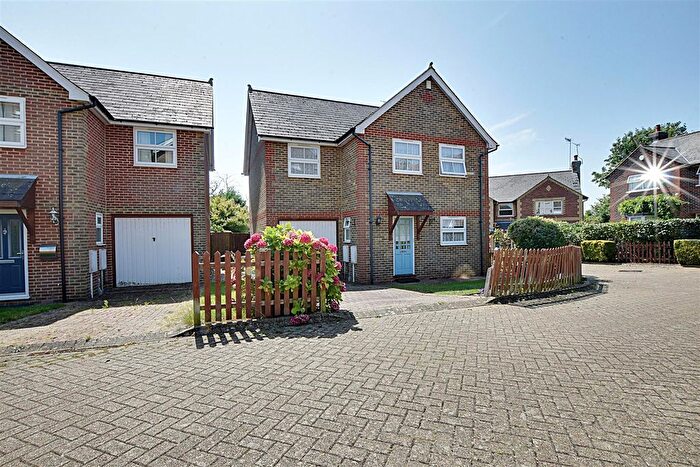
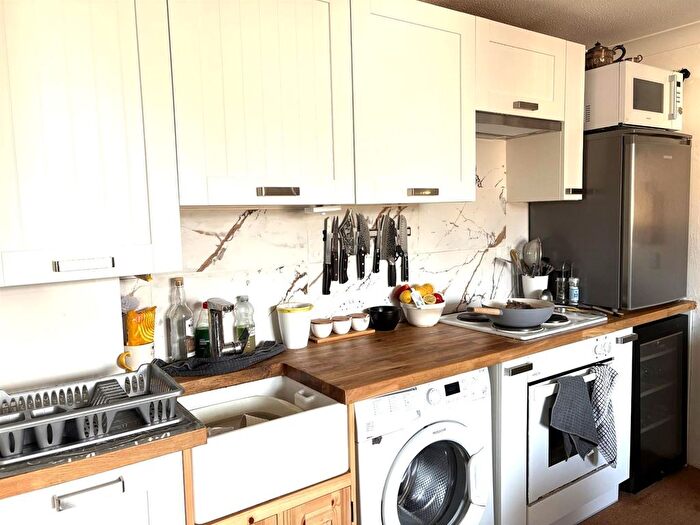
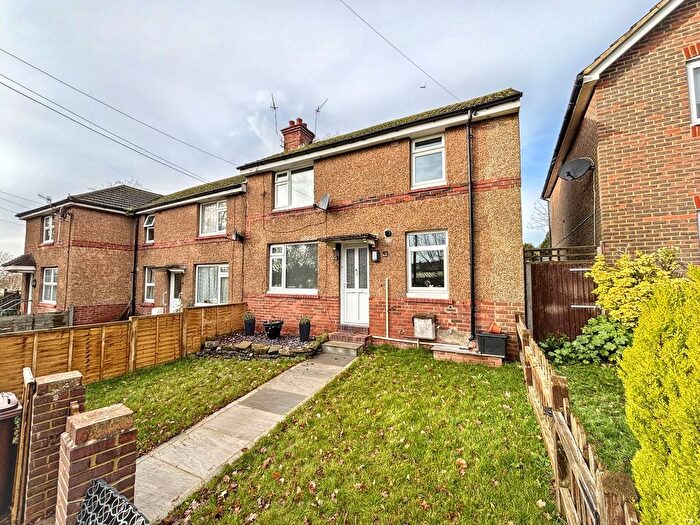
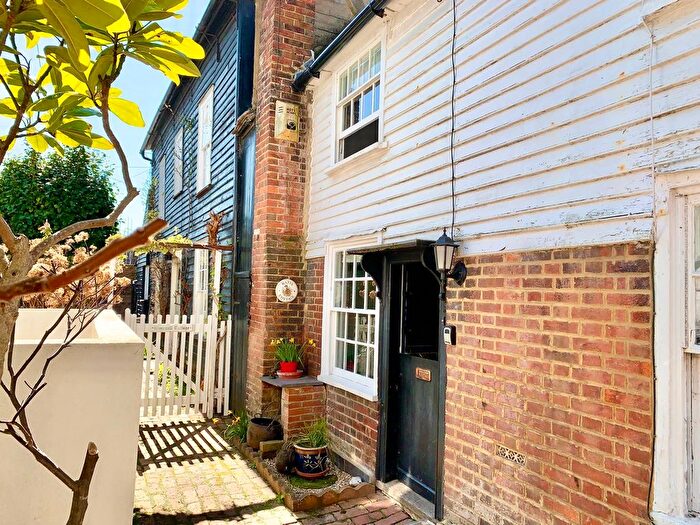
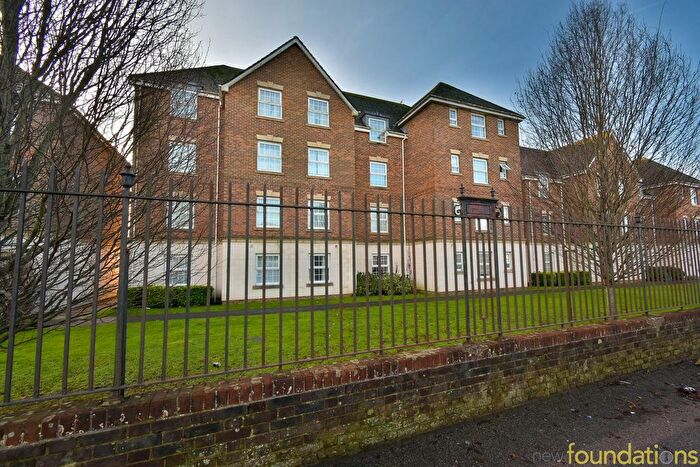
Properties for sale in Sidley
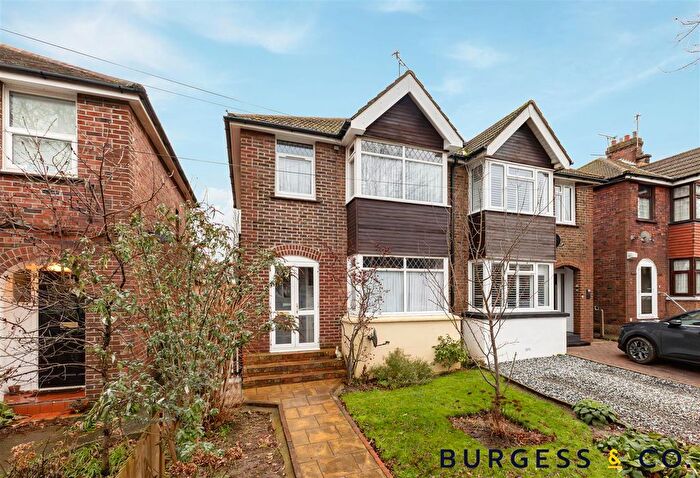
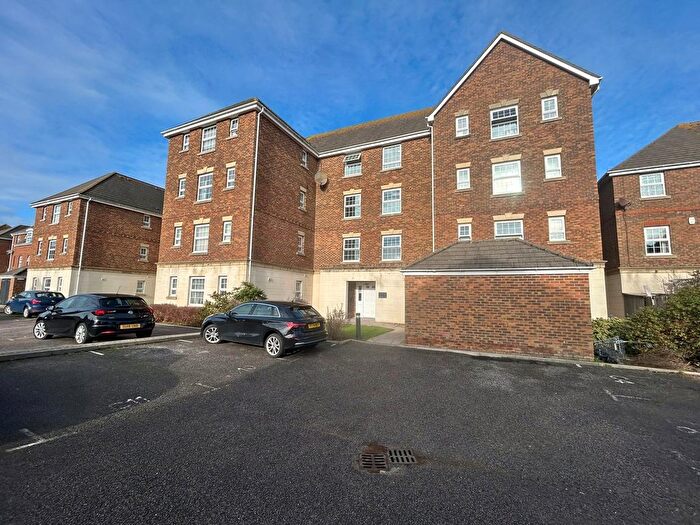
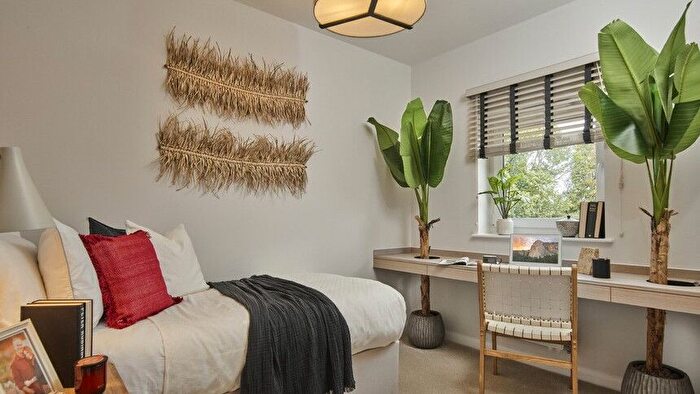
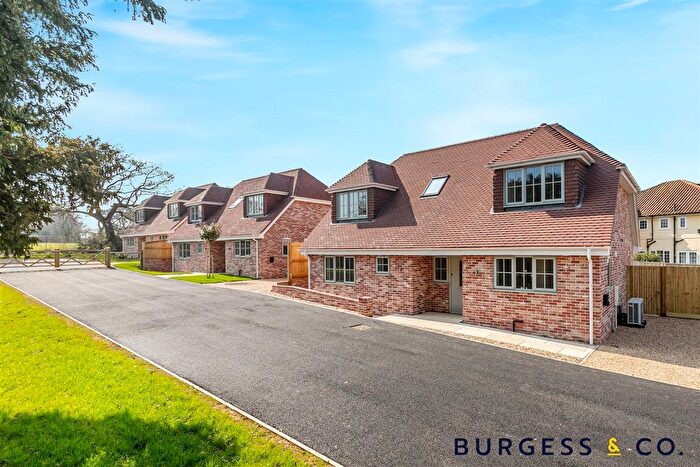
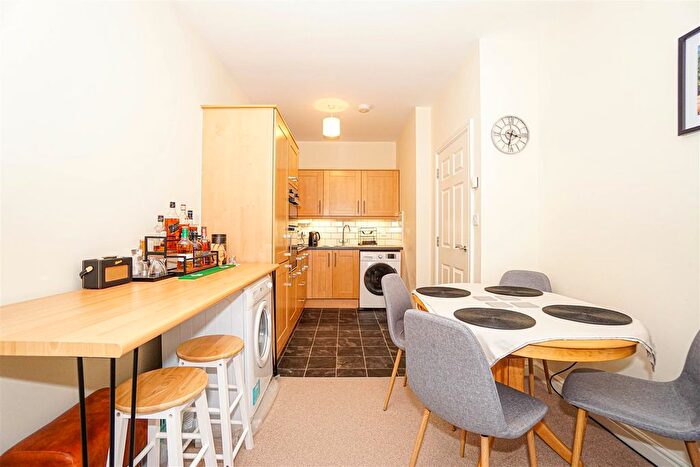
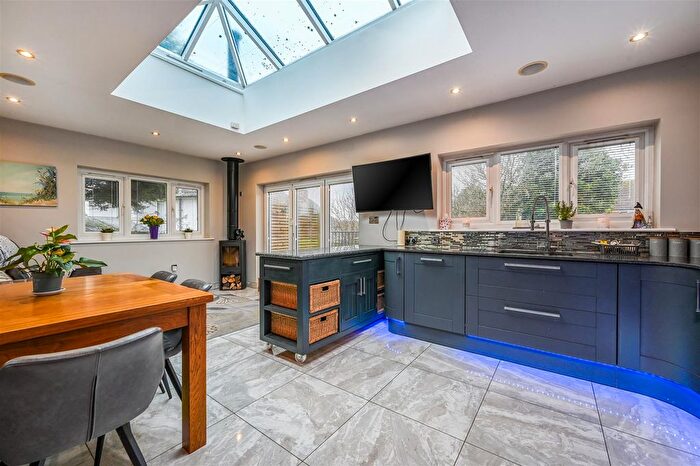
![]()
If you are looking to sell your house, let it out, or receive a property valuation, an expert can help you.
Click the button below to get started.

Roads and Postcodes in Sidley
Navigate through our locations to find the location of your next house in Sidley, Bexhill-on-sea for sale or to rent.
| Streets | Postcodes |
|---|---|
| All Saints Lane | TN39 5HA |
| Ashby Close | TN39 5DU |
| Bank Road | TN39 5AG |
| Beacon Hill | TN39 5DF |
| Birch View | TN39 4BB |
| Blackmill Close | TN39 5DY |
| Bodle Crescent | TN39 4BG |
| Buckholt Lane | TN39 5AU TN39 5AX |
| Buxton Drive | TN39 4AT TN39 4AU TN39 4BA TN39 4BD |
| Calgary Road | TN39 4BH |
| Camperdown Street | TN39 5BE |
| Canada Way | TN39 4BL |
| Carfax Close | TN39 5EG |
| Claremont Road | TN39 5BX |
| Clinch Green Avenue | TN39 5HN TN39 5HW |
| Cooper Drive | TN39 5EF |
| Crowhurst Lane | TN39 5AS |
| Cumberland Road | TN39 5BU |
| Cuthbert Close | TN39 5DX |
| Davis Close | TN39 5DT |
| Edmonton Road | TN39 4BJ |
| Faygate Close | TN39 5EE |
| Freezeland Lane | TN39 5JD |
| Glenburn Close | TN39 5JF |
| Glovers Lane | TN39 5AJ TN39 5AL TN39 5AW |
| Highfield Gardens | TN39 5AD |
| Highlands Close | TN39 5HP |
| Ingrams Avenue | TN39 5AT |
| Jubilee Road | TN39 5DR TN39 5DS |
| Langley Close | TN39 5EH |
| Mayo Lane | TN39 5EA |
| Mayo Rise | TN39 5DB |
| Meadow Crescent | TN39 5AR |
| Mill View Road | TN39 5HD |
| Mill Wood Road | TN39 5DG |
| Morgan Close | TN39 5EQ |
| Mount Idol View | TN39 5DH |
| Ninfield Road | TN39 5AA TN39 5AB TN39 5AE TN39 5AF TN39 5BA TN39 5BB TN39 5BD TN39 5DA TN39 5DD TN39 5DE TN39 5JG TN39 5JJ |
| Norfolk Close | TN39 5BS TN39 5BT |
| North Road | TN39 5BJ TN39 5BL |
| Pankhurst Close | TN39 5DL |
| Pankhurst Rise | TN39 5DN TN39 5DW |
| Paton Road | TN39 5DJ |
| Preston Road | TN39 5BN TN39 5BP TN39 5BY TN39 5BZ |
| Putlands Crescent | TN39 5DP |
| Redwell Avenue | TN39 5DQ |
| Ringwood Road | TN39 5AQ |
| Sidley Green | TN39 5AH |
| Sidley Street | TN39 5BG TN39 5BQ |
| Southlands Avenue | TN39 5HQ |
| Southlands Road | TN39 5HG |
| St Lawrence Road | TN39 4BP |
| St Marys Lane | TN39 5JE |
| Stevens Close | TN39 5AZ |
| Suffolk Road | TN39 5BH |
| The Highlands | TN39 5HJ TN39 5HL |
| The Ridings | TN39 5HU |
| Thorne Crescent | TN39 5JH |
| Turkey Road | TN39 5HB TN39 5HE TN39 5HH TN39 5HR TN39 5HT TN39 5HY |
| Watergate | TN39 5ED |
| Watermill Close | TN39 5EJ |
| Watermill Lane | TN39 5EB TN39 5EL TN39 5EW TN39 5JA TN39 5JB |
Transport near Sidley

- FAQ
- Price Paid By Year
- Property Type Price
Frequently asked questions about Sidley
What is the average price for a property for sale in Sidley?
The average price for a property for sale in Sidley is £312,616. This amount is 7% lower than the average price in Bexhill-on-sea. There are 3,994 property listings for sale in Sidley.
What streets have the most expensive properties for sale in Sidley?
The streets with the most expensive properties for sale in Sidley are St Marys Lane at an average of £680,000, Thorne Crescent at an average of £594,000 and The Highlands at an average of £552,390.
What streets have the most affordable properties for sale in Sidley?
The streets with the most affordable properties for sale in Sidley are Meadow Crescent at an average of £182,666, North Road at an average of £183,000 and Preston Road at an average of £191,115.
Which train stations are available in or near Sidley?
Some of the train stations available in or near Sidley are Bexhill, Collington and Cooden Beach.
Property Price Paid in Sidley by Year
The average sold property price by year was:
| Year | Average Sold Price | Price Change |
Sold Properties
|
|---|---|---|---|
| 2025 | £315,141 | -3% |
39 Properties |
| 2024 | £325,518 | 6% |
63 Properties |
| 2023 | £305,821 | -0,1% |
62 Properties |
| 2022 | £306,169 | 7% |
76 Properties |
| 2021 | £284,094 | 4% |
114 Properties |
| 2020 | £273,726 | 3% |
79 Properties |
| 2019 | £264,724 | 4% |
70 Properties |
| 2018 | £254,348 | 7% |
70 Properties |
| 2017 | £236,586 | 3% |
93 Properties |
| 2016 | £229,550 | 13% |
84 Properties |
| 2015 | £199,457 | 2% |
79 Properties |
| 2014 | £195,604 | 5% |
90 Properties |
| 2013 | £186,268 | 6% |
60 Properties |
| 2012 | £174,164 | 5% |
54 Properties |
| 2011 | £166,076 | -6% |
64 Properties |
| 2010 | £176,248 | 8% |
54 Properties |
| 2009 | £161,389 | -23% |
48 Properties |
| 2008 | £198,322 | 5% |
62 Properties |
| 2007 | £187,844 | 9% |
111 Properties |
| 2006 | £170,239 | 5% |
120 Properties |
| 2005 | £162,101 | 2% |
112 Properties |
| 2004 | £158,291 | 1% |
128 Properties |
| 2003 | £157,052 | 26% |
104 Properties |
| 2002 | £116,292 | 16% |
136 Properties |
| 2001 | £98,086 | 17% |
117 Properties |
| 2000 | £81,738 | 5% |
118 Properties |
| 1999 | £77,949 | 12% |
120 Properties |
| 1998 | £68,417 | 14% |
122 Properties |
| 1997 | £59,065 | -0,2% |
103 Properties |
| 1996 | £59,168 | 10% |
124 Properties |
| 1995 | £53,454 | - |
93 Properties |
Property Price per Property Type in Sidley
Here you can find historic sold price data in order to help with your property search.
The average Property Paid Price for specific property types in the last three years are:
| Property Type | Average Sold Price | Sold Properties |
|---|---|---|
| Semi Detached House | £293,895.00 | 66 Semi Detached Houses |
| Detached House | £446,849.00 | 70 Detached Houses |
| Terraced House | £252,756.00 | 78 Terraced Houses |
| Flat | £178,325.00 | 26 Flats |