
Houses for sale & to rent in TN39 3BU, Chelgates, St Marks, Bexhill-on-sea
House Prices in TN39 3BU, Chelgates, St Marks
Properties in TN39 3BU have no sales history available within the last 3 years. TN39 3BU is a postcode in Chelgates located in St Marks, an area in Bexhill-on-sea, East Sussex, with 6 households².
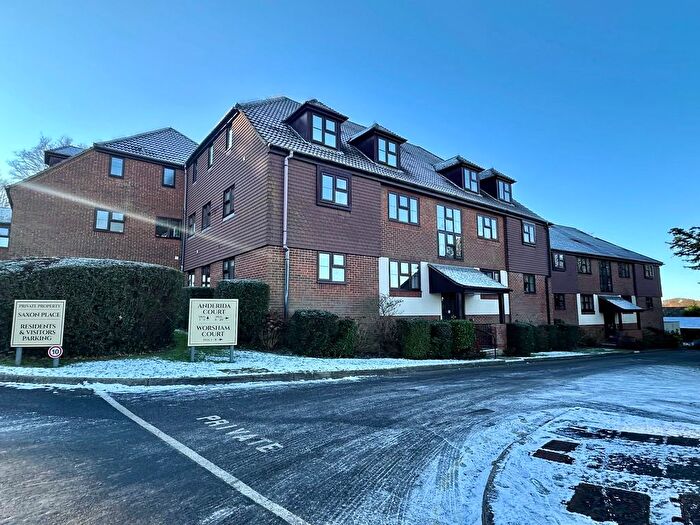
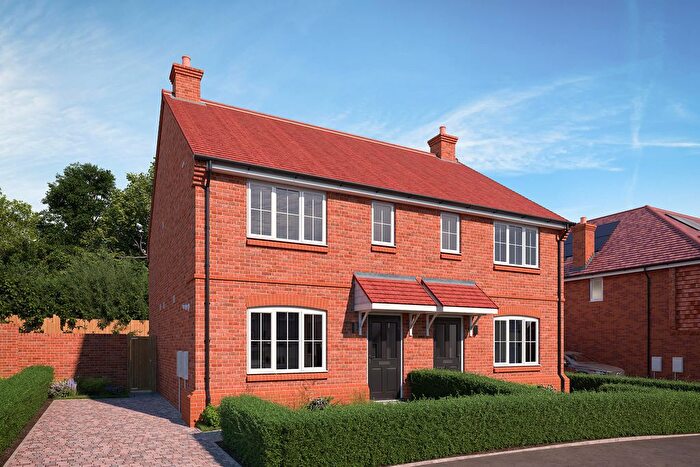
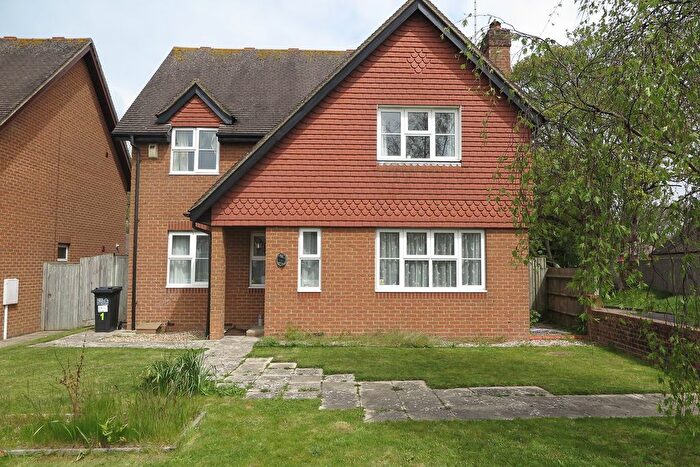
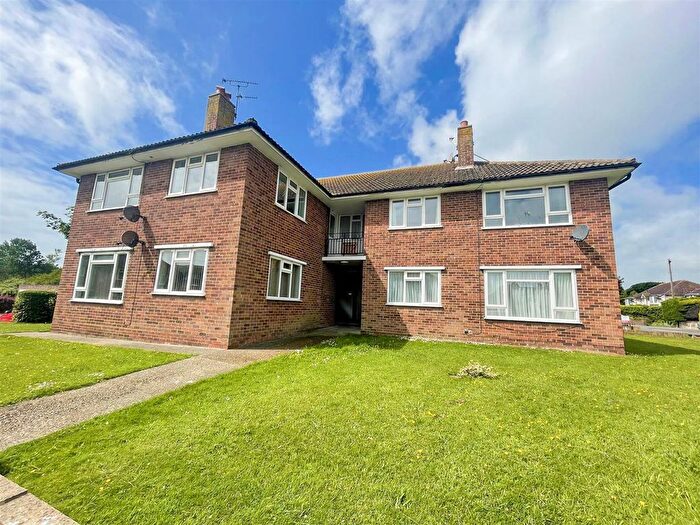
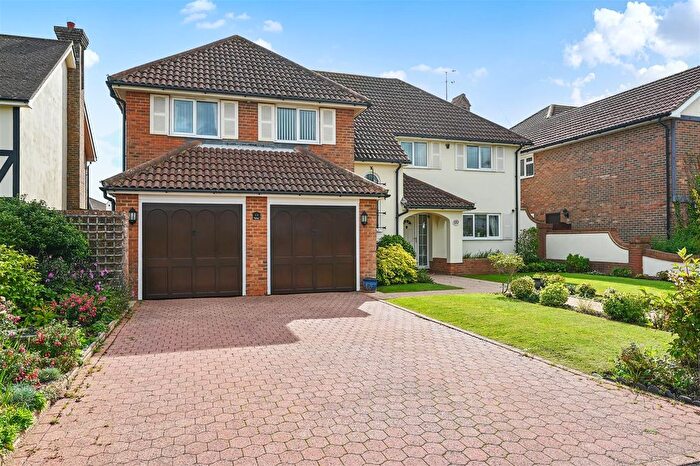
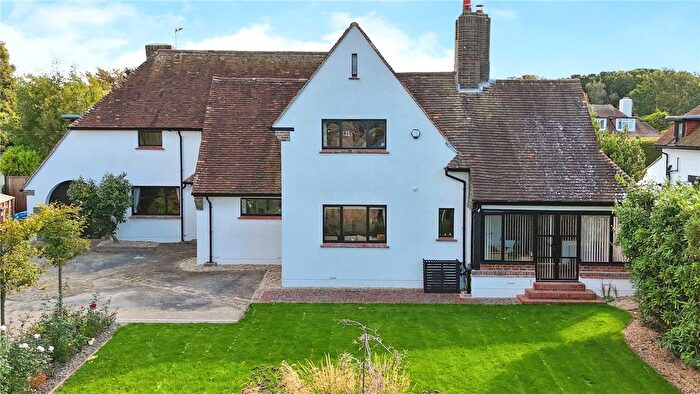
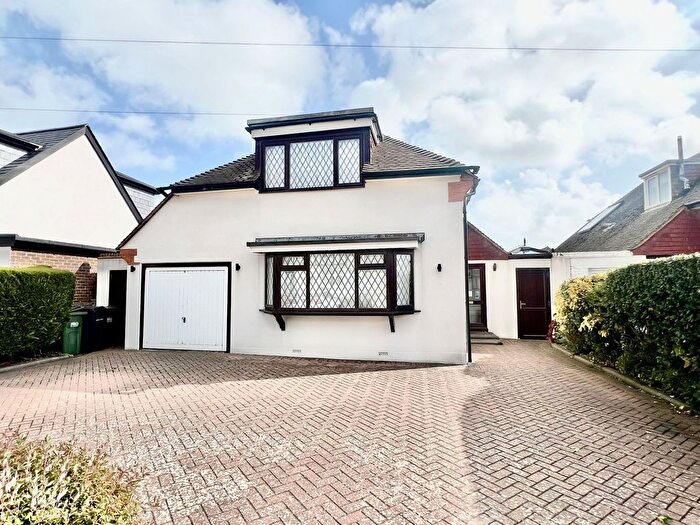
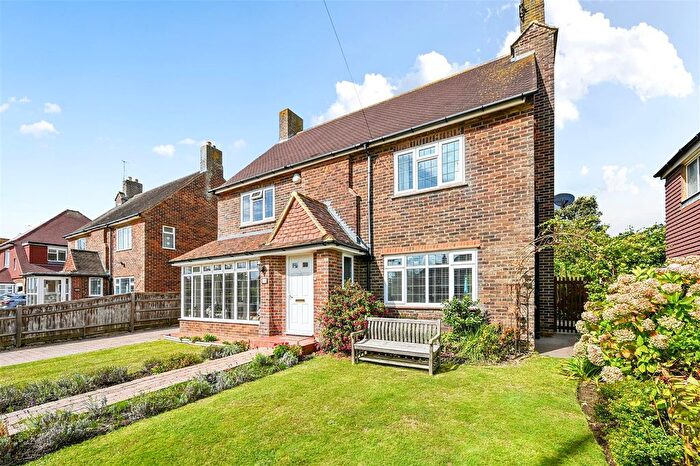
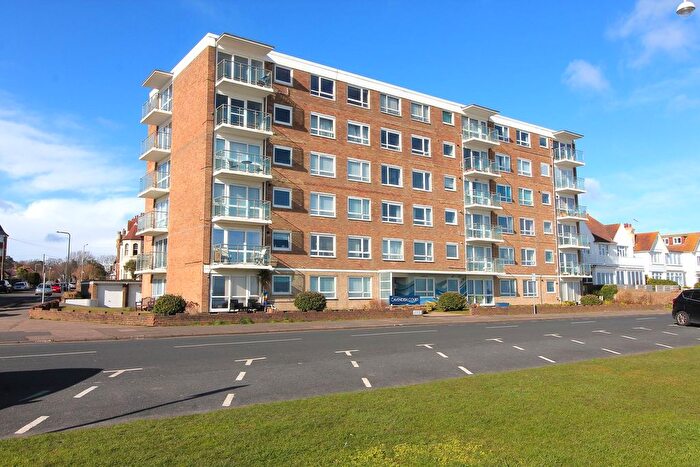
Properties for sale near TN39 3BU, Chelgates
![]()
If you are looking to sell your house, let it out, or receive a property valuation, an expert can help you.
Click the button below to get started.
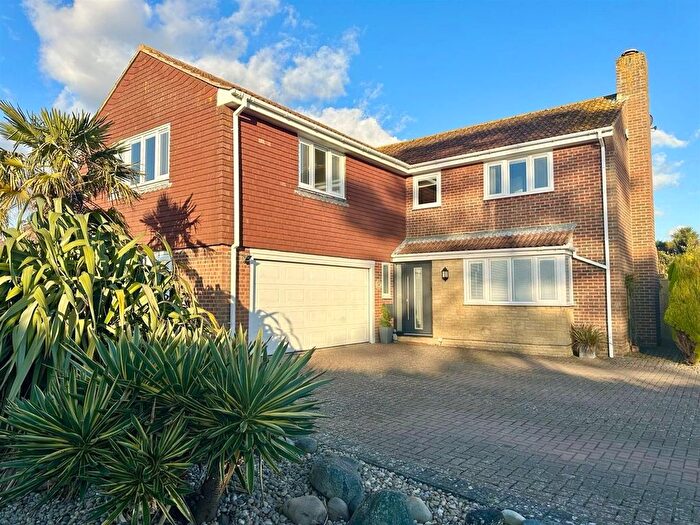
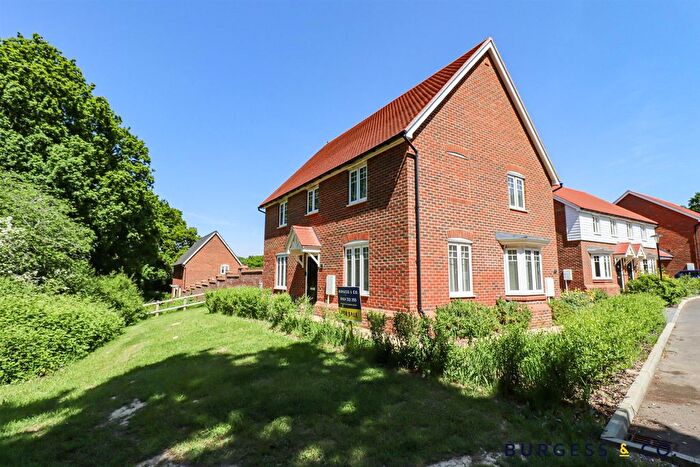
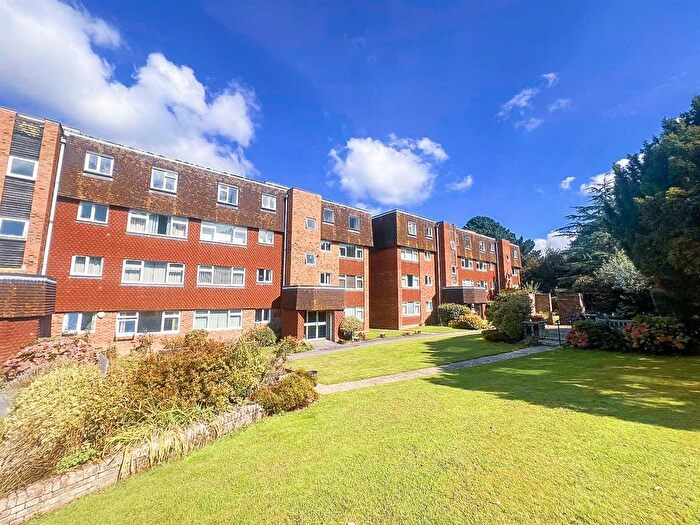
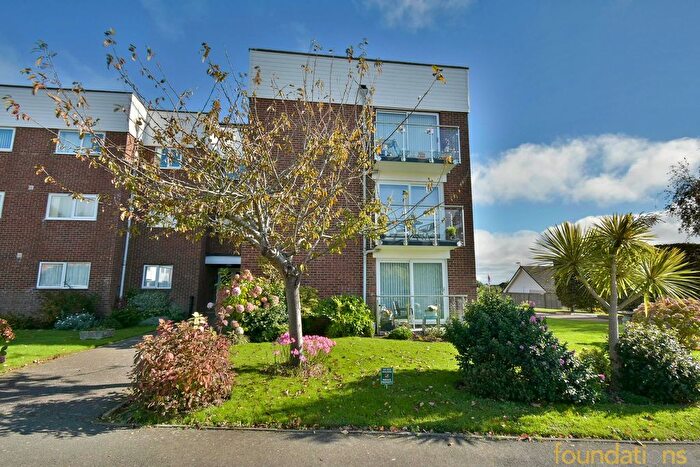
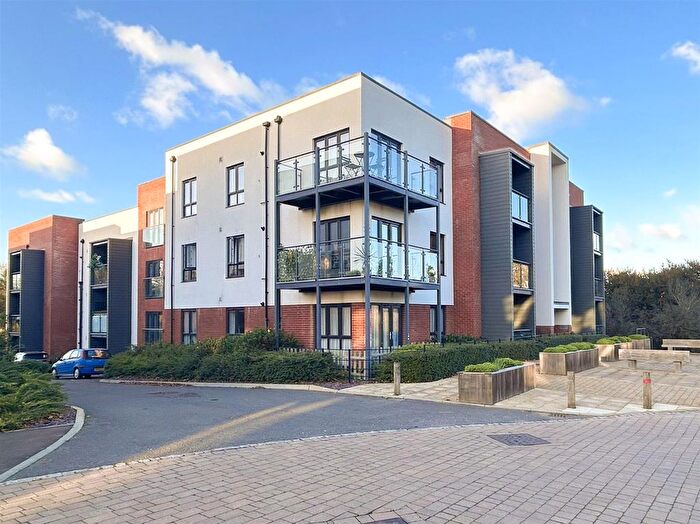
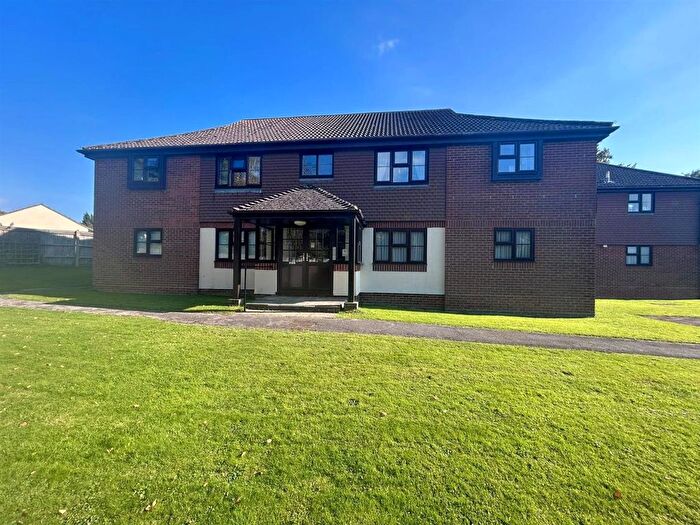
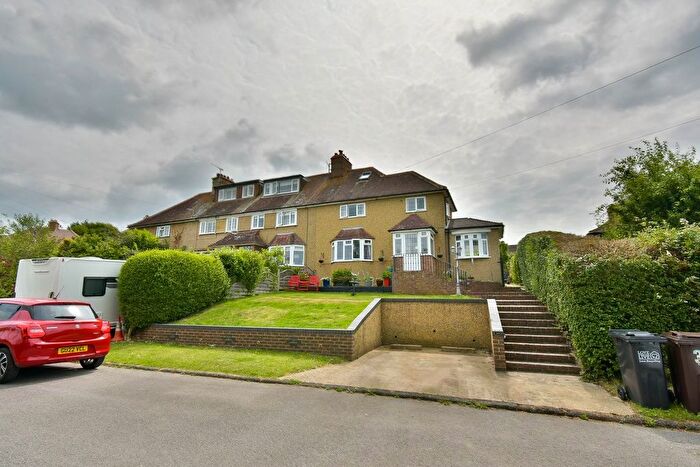
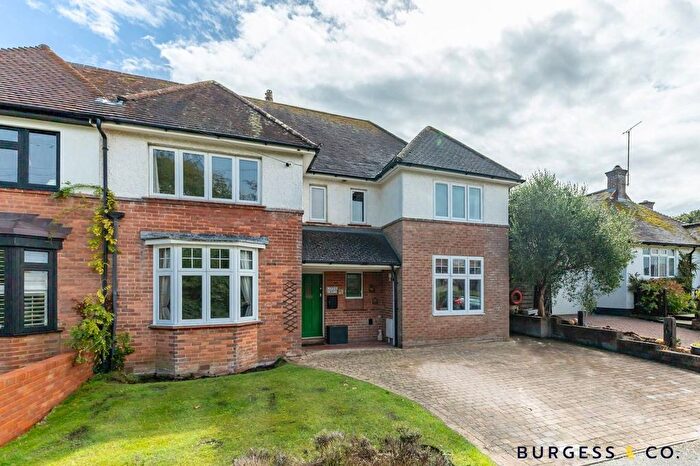
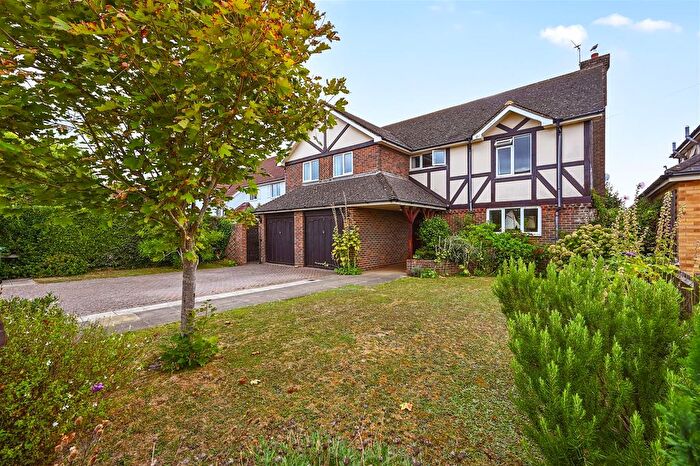
Previously listed properties near TN39 3BU, Chelgates


![]()
If you are looking to sell your house, let it out, or receive a property valuation, an expert can help you.
Click the button below to get started.
Price Paid in Chelgates, TN39 3BU, St Marks
6 Chelgates, TN39 3BU, St Marks Bexhill-on-sea
Property 6 has been sold 2 times. The last time it was sold was in 23/06/2021 and the sold price was £594,000.00.
This detached house, sold as a freehold on 23/06/2021, is a 140 sqm detached bungalow with an EPC rating of D.
| Date | Price | Property Type | Tenure | Classification |
|---|---|---|---|---|
| 23/06/2021 | £594,000.00 | Detached House | freehold | Established Building |
| 08/09/2016 | £400,000.00 | Detached House | freehold | Established Building |
5 Chelgates, TN39 3BU, St Marks Bexhill-on-sea
Property 5 has been sold 1 time. The last time it was sold was in 24/02/2021 and the sold price was £570,000.00.
This detached house, sold as a freehold on 24/02/2021, is a 130 sqm detached house with an EPC rating of C.
| Date | Price | Property Type | Tenure | Classification |
|---|---|---|---|---|
| 24/02/2021 | £570,000.00 | Detached House | freehold | Established Building |
1 Chelgates, TN39 3BU, St Marks Bexhill-on-sea
Property 1 has been sold 6 times. The last time it was sold was in 26/09/2014 and the sold price was £383,000.00.
This detached house, sold as a freehold on 26/09/2014, is a 86 sqm detached bungalow with an EPC rating of D.
| Date | Price | Property Type | Tenure | Classification |
|---|---|---|---|---|
| 26/09/2014 | £383,000.00 | Detached House | freehold | Established Building |
| 28/09/2011 | £350,000.00 | Detached House | freehold | Established Building |
| 25/07/2007 | £360,000.00 | Detached House | freehold | Established Building |
| 17/11/1999 | £158,000.00 | Detached House | freehold | Established Building |
| 28/08/1998 | £145,000.00 | Detached House | freehold | Established Building |
| 02/02/1995 | £110,000.00 | Detached House | freehold | Established Building |
3 Chelgates, TN39 3BU, St Marks Bexhill-on-sea
Property 3 has been sold 1 time. The last time it was sold was in 09/10/2013 and the sold price was £313,000.00.
This detached house, sold as a freehold on 09/10/2013, is a 140 sqm detached house with an EPC rating of F.
| Date | Price | Property Type | Tenure | Classification |
|---|---|---|---|---|
| 09/10/2013 | £313,000.00 | Detached House | freehold | Established Building |
4 Chelgates, TN39 3BU, St Marks Bexhill-on-sea
Property 4 has been sold 4 times. The last time it was sold was in 20/07/2011 and the sold price was £355,000.00.
This is a Detached House which was sold as a freehold in 20/07/2011
| Date | Price | Property Type | Tenure | Classification |
|---|---|---|---|---|
| 20/07/2011 | £355,000.00 | Detached House | freehold | Established Building |
| 15/08/2002 | £250,000.00 | Detached House | freehold | Established Building |
| 22/09/1998 | £136,000.00 | Detached House | freehold | Established Building |
| 30/01/1995 | £105,000.00 | Detached House | freehold | Established Building |
2 Chelgates, TN39 3BU, St Marks Bexhill-on-sea
Property 2 has been sold 3 times. The last time it was sold was in 02/05/2000 and the sold price was £155,000.00.
This detached house, sold as a freehold on 02/05/2000, is a 82 sqm detached bungalow with an EPC rating of D.
| Date | Price | Property Type | Tenure | Classification |
|---|---|---|---|---|
| 02/05/2000 | £155,000.00 | Detached House | freehold | Established Building |
| 11/10/1999 | £131,000.00 | Detached House | freehold | Established Building |
| 12/02/1996 | £113,000.00 | Detached House | freehold | Established Building |
Transport near TN39 3BU, Chelgates

House price paid reports for TN39 3BU, Chelgates
Click on the buttons below to see price paid reports by year or property price:
- Price Paid By Year
Property Price Paid in TN39 3BU, Chelgates by Year
The average sold property price by year was:
| Year | Average Sold Price | Price Change |
Sold Properties
|
|---|---|---|---|
| 2021 | £582,000 | 31% |
2 Properties |
| 2016 | £400,000 | 4% |
1 Property |
| 2014 | £383,000 | 18% |
1 Property |
| 2013 | £313,000 | -13% |
1 Property |
| 2011 | £352,500 | -2% |
2 Properties |
| 2007 | £360,000 | 31% |
1 Property |
| 2002 | £250,000 | 38% |
1 Property |
| 2000 | £155,000 | 7% |
1 Property |
| 1999 | £144,500 | 3% |
2 Properties |
| 1998 | £140,500 | 20% |
2 Properties |
| 1996 | £113,000 | 5% |
1 Property |
| 1995 | £107,500 | - |
2 Properties |