
Houses for sale & to rent in Collington, Bexhill-on-sea
House Prices in Collington
Properties in Collington have an average house price of £442,723.00 and had 366 Property Transactions within the last 3 years¹.
Collington is an area in Bexhill-on-sea, East Sussex with 2,097 households², where the most expensive property was sold for £2,500,000.00.
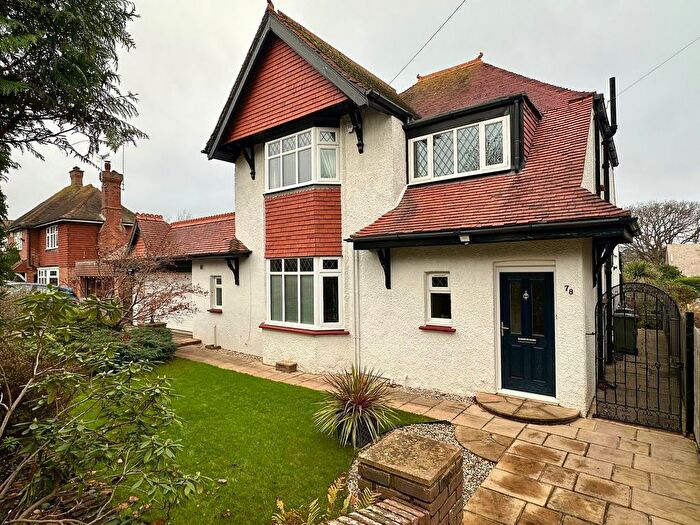
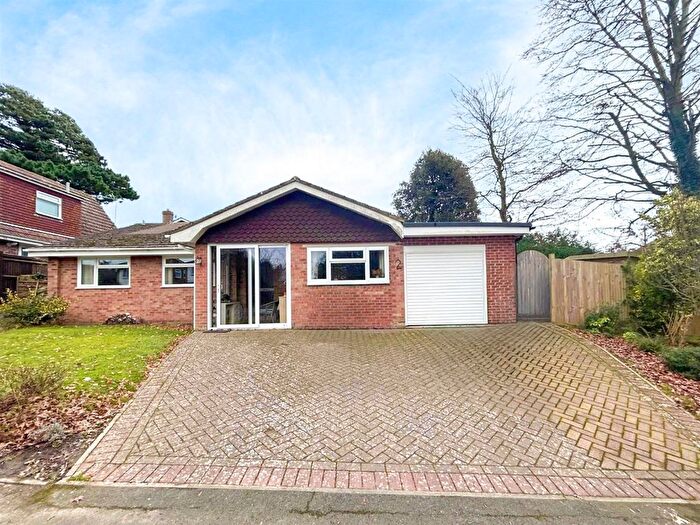
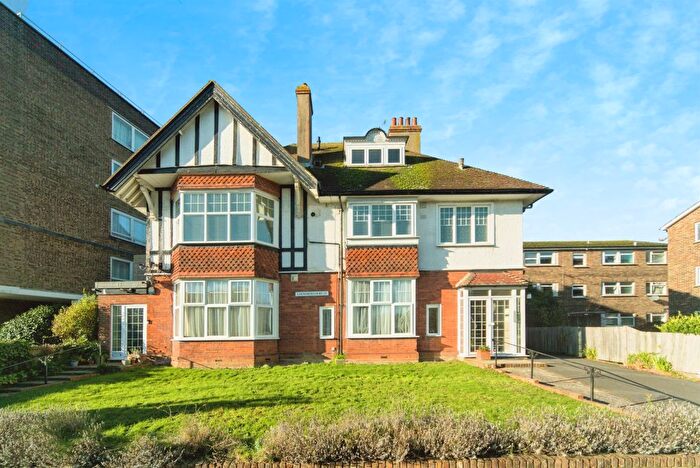
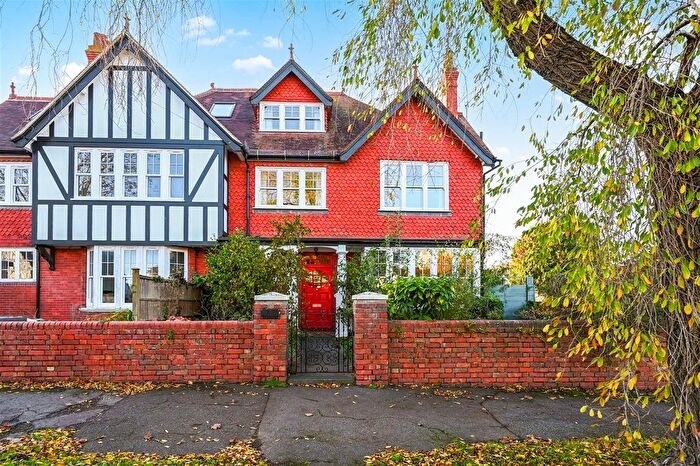
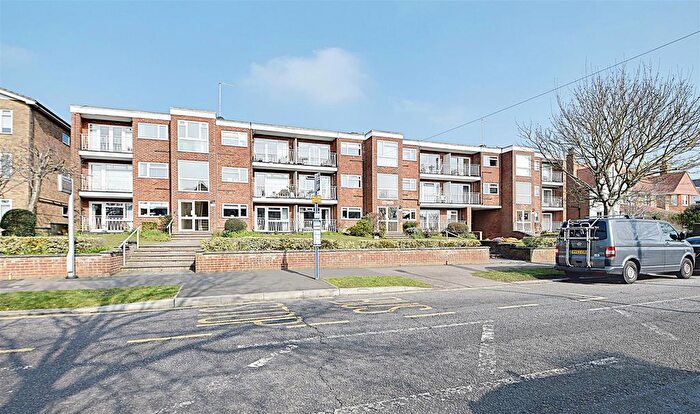
Properties for sale in Collington
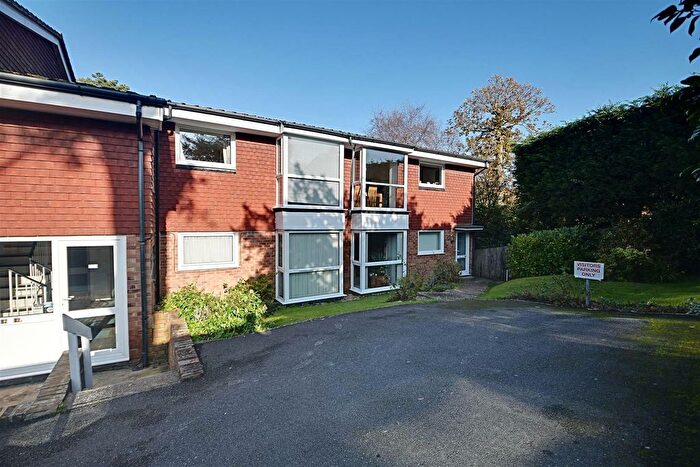

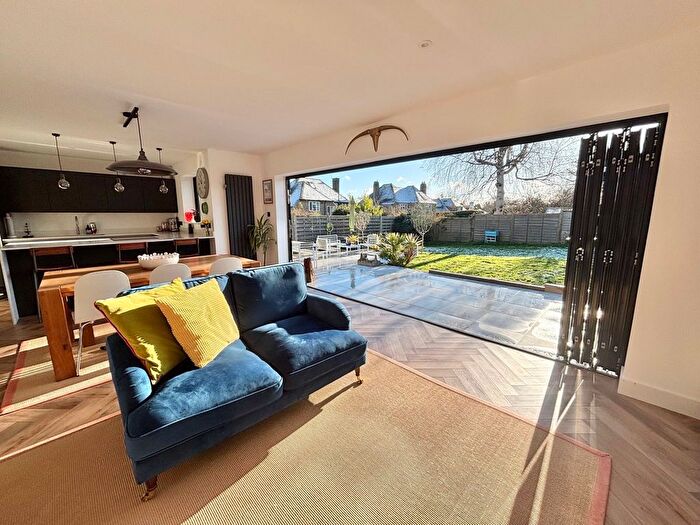

![]()
If you are looking to sell your house, let it out, or receive a property valuation, an expert can help you.
Click the button below to get started.
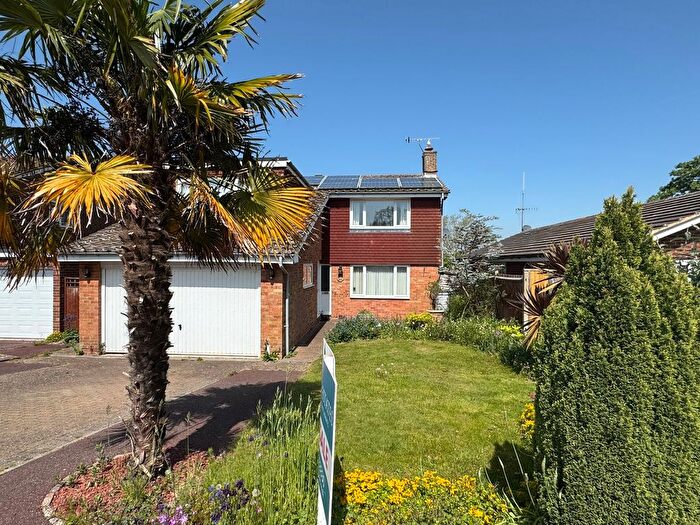
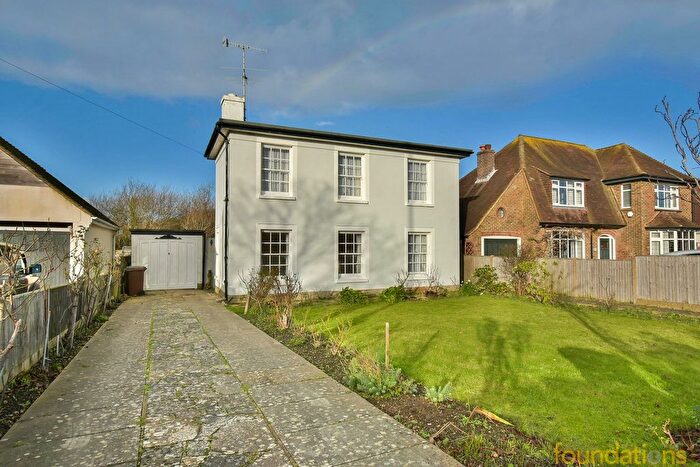
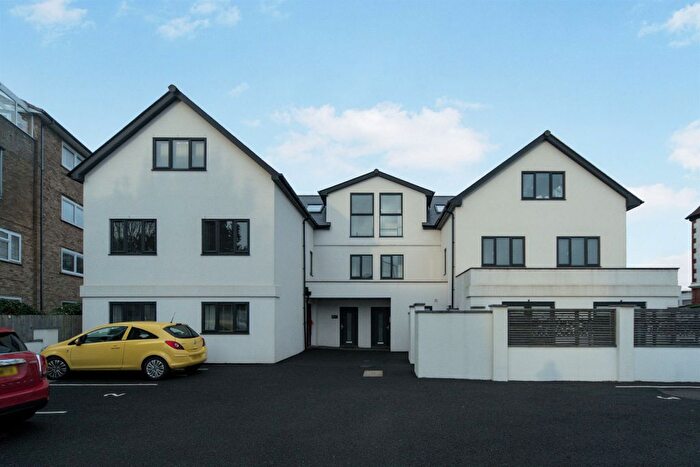
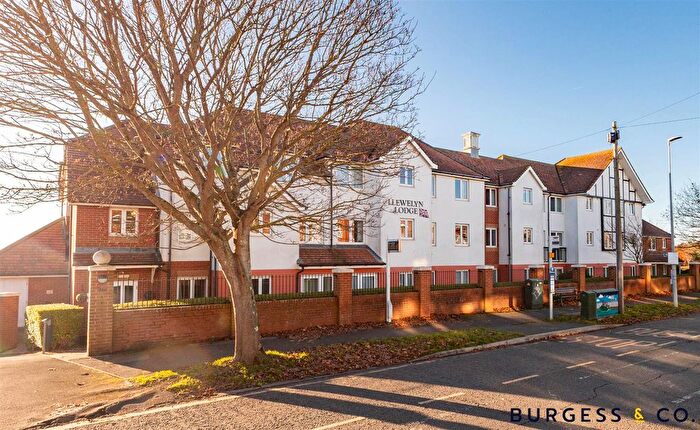
Previously listed properties in Collington
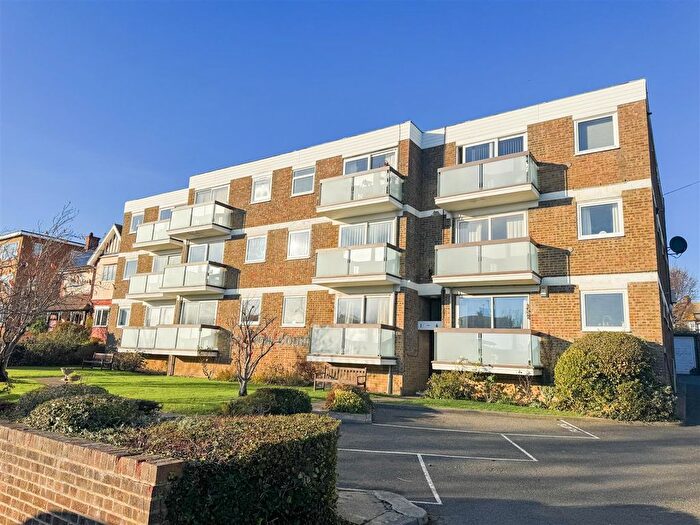
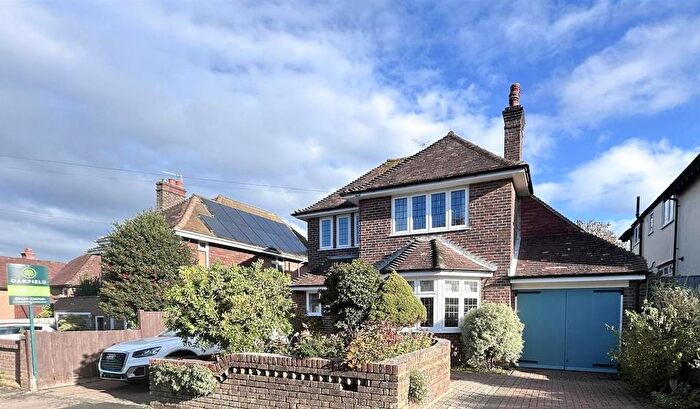
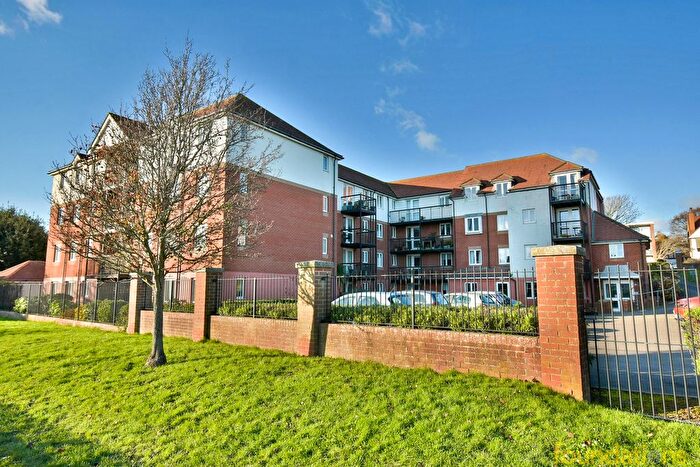
![]()
If you are looking to sell your house, let it out, or receive a property valuation, an expert can help you.
Click the button below to get started.

Roads and Postcodes in Collington
Navigate through our locations to find the location of your next house in Collington, Bexhill-on-sea for sale or to rent.
| Streets | Postcodes |
|---|---|
| Ashcombe Drive | TN39 3TZ TN39 3UJ TN39 3UL |
| Beaulieu Road | TN39 3AD |
| Brampton Avenue | TN39 3NG |
| Ceylon Walk | TN39 3UG |
| Colebrooke Road | TN39 3PY TN39 3PZ |
| Collington Avenue | TN39 3NB TN39 3NE TN39 3PU TN39 3PX TN39 3QA TN39 3RA TN39 3RB |
| Colwall Gardens | TN39 3FB |
| Cooden Drive | TN39 3AA TN39 3AB TN39 3AE TN39 3AG TN39 3AH TN39 3AJ TN39 3AN TN39 3AQ TN39 3AS TN39 3AT TN39 3AW TN39 3AX TN39 3AY TN39 3DB TN39 3DD TN39 3DE TN39 3DF TN39 3DG TN39 3DH TN39 3DL TN39 3DQ TN39 3GF |
| Cooden Sea Road | TN39 4TT |
| Cranleigh Close | TN39 3NF |
| Cranston Avenue | TN39 3QG |
| Cranston Rise | TN39 3NJ |
| Crofton Park Avenue | TN39 3SE |
| Eridge Close | TN39 3QX TN39 3QY TN39 3QZ |
| Falconbury Drive | TN39 3UW |
| Findon Close | TN39 3SH |
| Gatehouse Close | TN39 3DJ |
| Gillham Wood Avenue | TN39 3BW |
| Gillham Wood Road | TN39 3BN |
| Harewood Close | TN39 3LX |
| Hartfield Road | TN39 3EA |
| Hawkhurst Way | TN39 3SD TN39 3SG TN39 3SN |
| Holm Oak Close | TN39 3SF |
| Holmesdale Road | TN39 3QE |
| Insley Court | TN39 3NS |
| Jarvis Brook Close | TN39 3UQ |
| Jasmine Way | TN39 3GJ |
| Monterey Close | TN39 3SZ |
| Monterey Gardens | TN39 3SY |
| Normandale | TN39 3LU TN39 3NU TN39 3NZ |
| Pages Avenue | TN39 3AP TN39 3BF |
| Pages Lane | TN39 3RD |
| Richmond Avenue | TN39 3EG |
| Richmond Close | TN39 3DW |
| Richmond Grove | TN39 3EQ |
| Richmond Road | TN39 3DN |
| Saltdean Close | TN39 3ST |
| Saltdean Way | TN39 3SS |
| Shipley Lane | TN39 3SR |
| South Cliff | TN39 3ED TN39 3EE TN39 3EH TN39 3EJ TN39 3EL |
| South Cliff Avenue | TN39 3EB |
| Southcourt Avenue | TN39 3AR |
| St Augustines Close | TN39 3AZ |
| Sutherland Avenue | TN39 3FD TN39 3LT TN39 3QR TN39 3QS TN39 3QT TN39 3QU |
| Tanglewood Coppice | TN39 3SB |
| Tangmere Close | TN39 3SL |
| Terminus Avenue | TN39 3LS TN39 3LY TN39 3LZ |
| The Barnhams | TN39 3RE |
| The Saxons | TN39 3NT |
| The Shrublands | TN39 3SJ |
| The Spinney | TN39 3SW |
| Thornbank Crescent | TN39 3ND |
| Tilgate Drive | TN39 3UH |
| Walton Park | TN39 3NH |
| Warnham Gardens | TN39 3SP |
| Wellesley Close | TN39 3UX |
| West Ham Close | TN39 3SQ |
| West Parade | TN39 3DP TN39 3DR TN39 3DS TN39 3DT TN39 3YA TN39 3YB |
| Westaway Drive | TN39 3QF |
| Westcourt Drive | TN39 3NA |
| Westville Road | TN39 3QB |
| Winceby Close | TN39 3EF |
Transport near Collington

- FAQ
- Price Paid By Year
- Property Type Price
Frequently asked questions about Collington
What is the average price for a property for sale in Collington?
The average price for a property for sale in Collington is £442,723. This amount is 31% higher than the average price in Bexhill-on-sea. There are 1,070 property listings for sale in Collington.
What streets have the most expensive properties for sale in Collington?
The streets with the most expensive properties for sale in Collington are Beaulieu Road at an average of £1,456,000, Winceby Close at an average of £1,435,000 and South Cliff at an average of £1,221,428.
What streets have the most affordable properties for sale in Collington?
The streets with the most affordable properties for sale in Collington are Harewood Close at an average of £199,425, Brampton Avenue at an average of £222,333 and Tanglewood Coppice at an average of £241,000.
Which train stations are available in or near Collington?
Some of the train stations available in or near Collington are Collington, Cooden Beach and Bexhill.
Property Price Paid in Collington by Year
The average sold property price by year was:
| Year | Average Sold Price | Price Change |
Sold Properties
|
|---|---|---|---|
| 2025 | £424,791 | -1% |
41 Properties |
| 2024 | £428,623 | -16% |
100 Properties |
| 2023 | £495,560 | 13% |
75 Properties |
| 2022 | £430,606 | -10% |
150 Properties |
| 2021 | £472,145 | 15% |
149 Properties |
| 2020 | £402,657 | 5% |
97 Properties |
| 2019 | £384,200 | 15% |
114 Properties |
| 2018 | £327,172 | 1% |
105 Properties |
| 2017 | £323,194 | -9% |
120 Properties |
| 2016 | £351,281 | 13% |
119 Properties |
| 2015 | £304,634 | 3% |
129 Properties |
| 2014 | £293,987 | 6% |
150 Properties |
| 2013 | £277,392 | 2% |
127 Properties |
| 2012 | £271,685 | 5% |
117 Properties |
| 2011 | £258,826 | -8% |
100 Properties |
| 2010 | £278,812 | 8% |
109 Properties |
| 2009 | £255,181 | -3% |
145 Properties |
| 2008 | £263,322 | -6% |
93 Properties |
| 2007 | £279,216 | 14% |
175 Properties |
| 2006 | £240,155 | 4% |
197 Properties |
| 2005 | £230,442 | 2% |
118 Properties |
| 2004 | £226,681 | 2% |
143 Properties |
| 2003 | £222,868 | 10% |
168 Properties |
| 2002 | £199,517 | 22% |
148 Properties |
| 2001 | £155,609 | 8% |
159 Properties |
| 2000 | £143,680 | 17% |
133 Properties |
| 1999 | £119,616 | 12% |
163 Properties |
| 1998 | £105,811 | 10% |
123 Properties |
| 1997 | £95,623 | -1% |
153 Properties |
| 1996 | £96,172 | 9% |
139 Properties |
| 1995 | £87,502 | - |
113 Properties |
Property Price per Property Type in Collington
Here you can find historic sold price data in order to help with your property search.
The average Property Paid Price for specific property types in the last three years are:
| Property Type | Average Sold Price | Sold Properties |
|---|---|---|
| Semi Detached House | £459,768.00 | 11 Semi Detached Houses |
| Detached House | £663,308.00 | 158 Detached Houses |
| Terraced House | £335,533.00 | 12 Terraced Houses |
| Flat | £260,271.00 | 185 Flats |