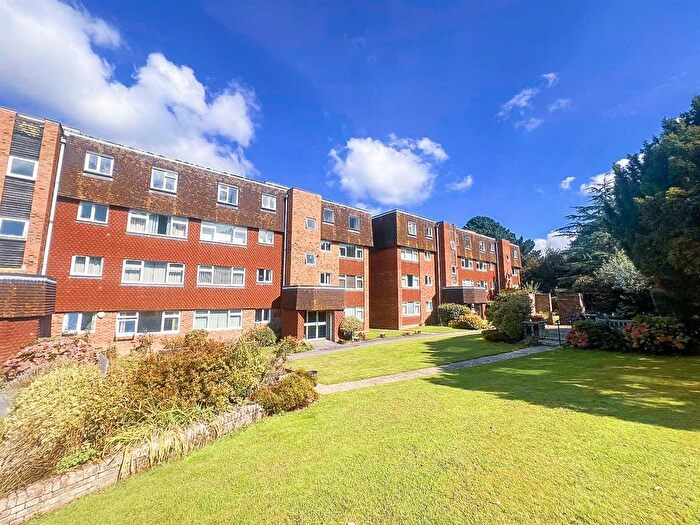
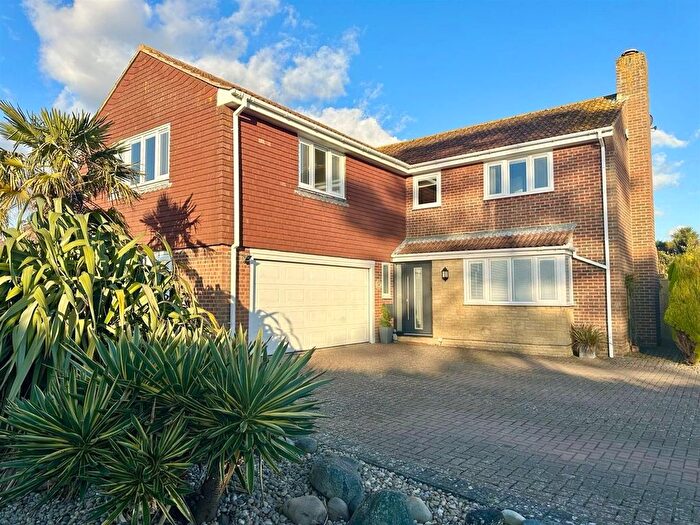
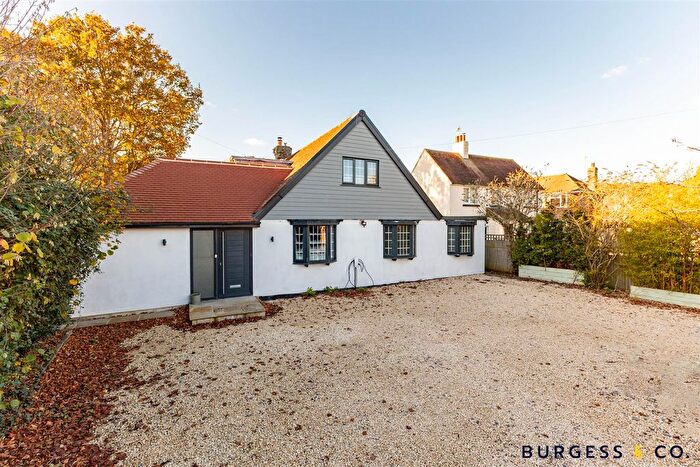
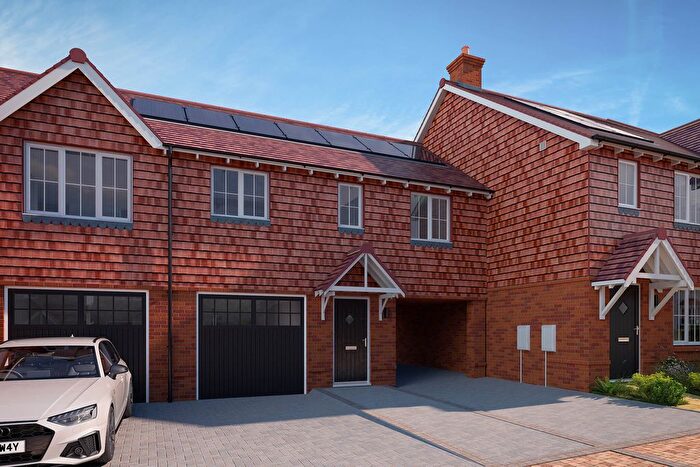
Houses for sale & to rent in St Marks, Bexhill-on-sea
House Prices in St Marks
Properties in St Marks have an average house price of £508,146.00 and had 312 Property Transactions within the last 3 years¹.
St Marks is an area in Bexhill-on-sea, East Sussex with 2,028 households², where the most expensive property was sold for £3,050,000.00.
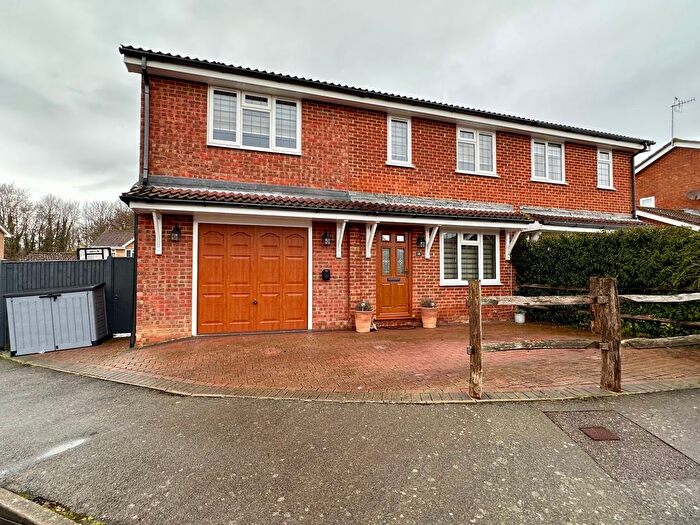
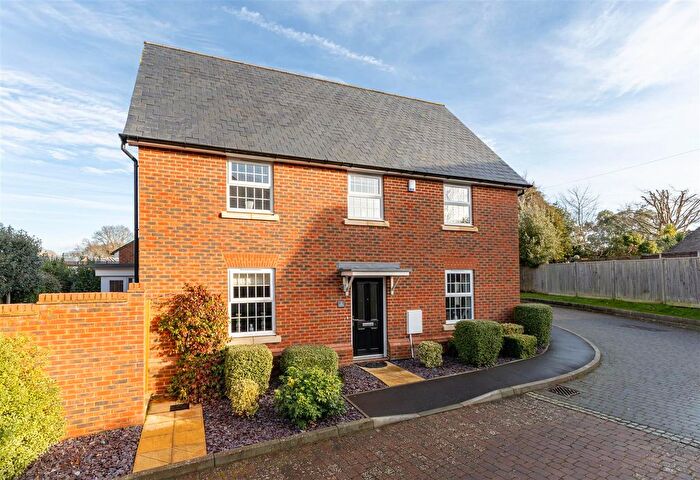
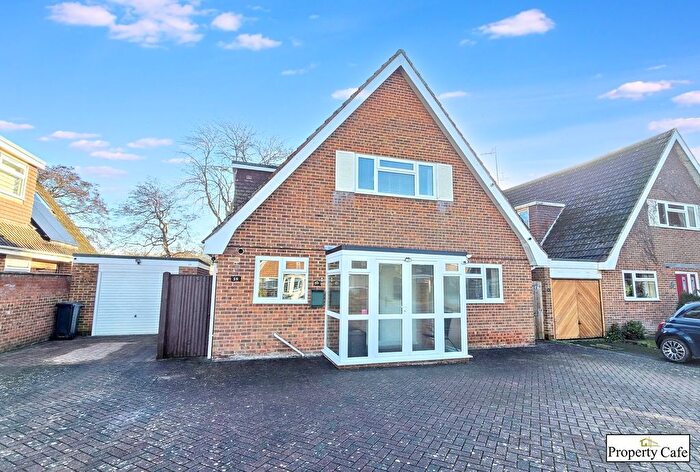
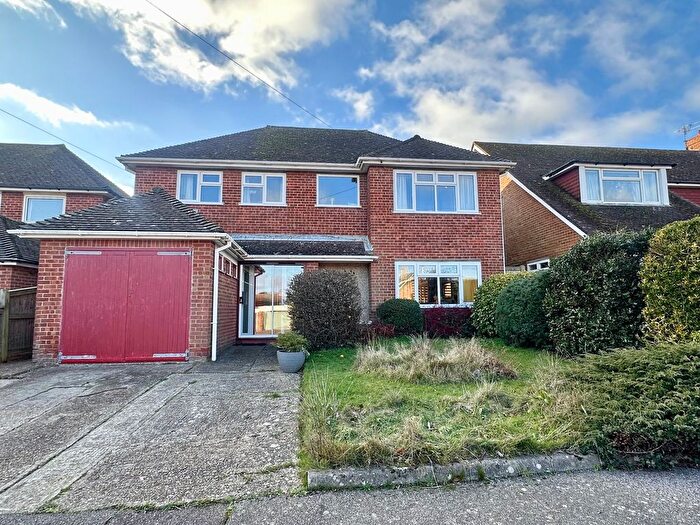
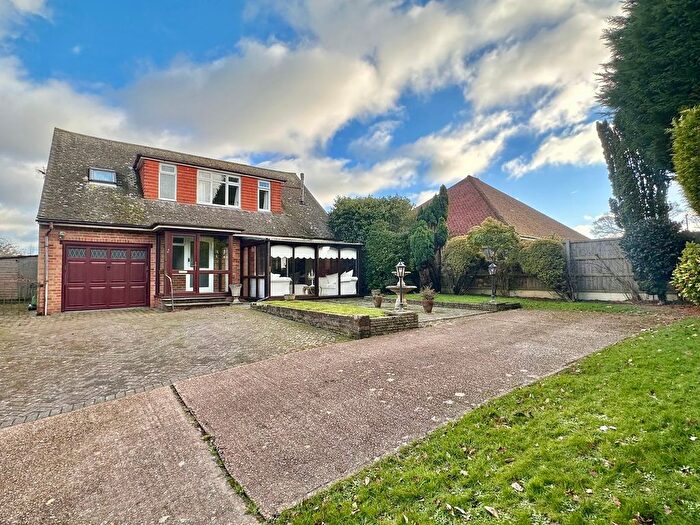
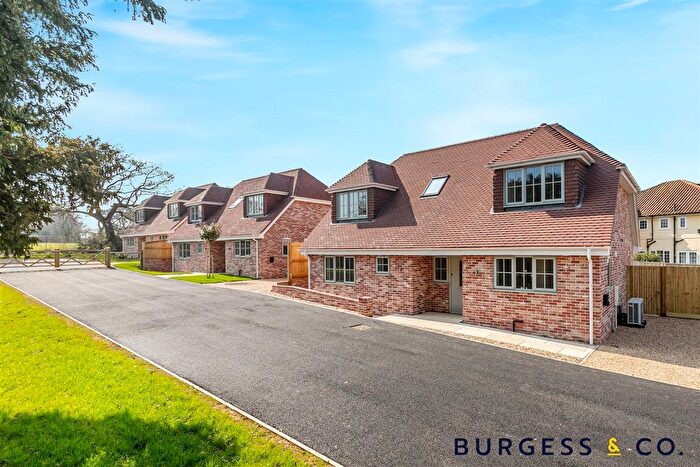
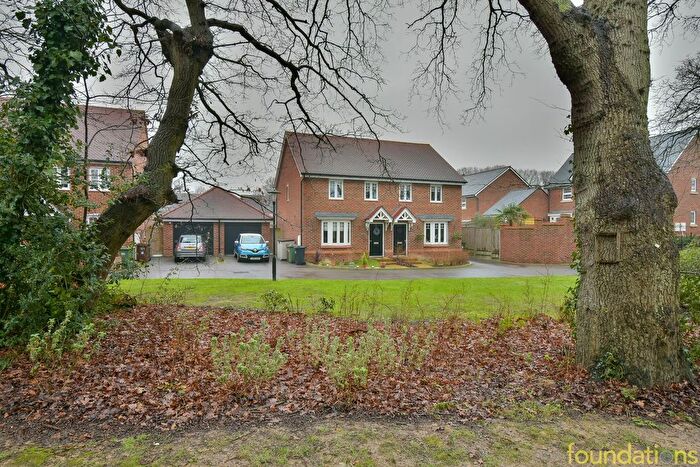
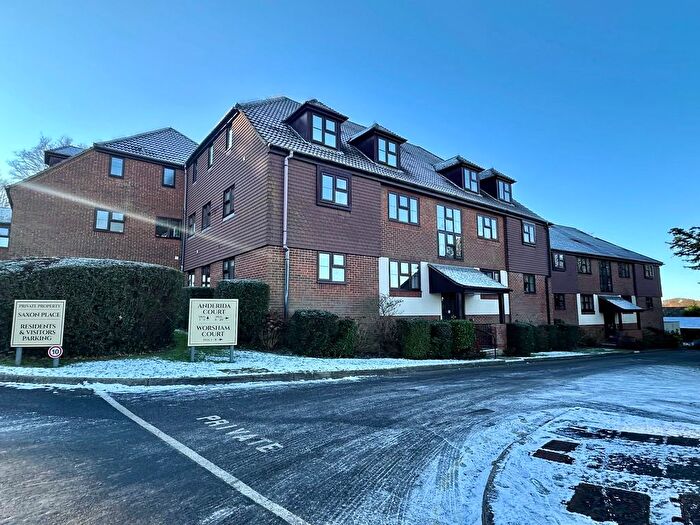
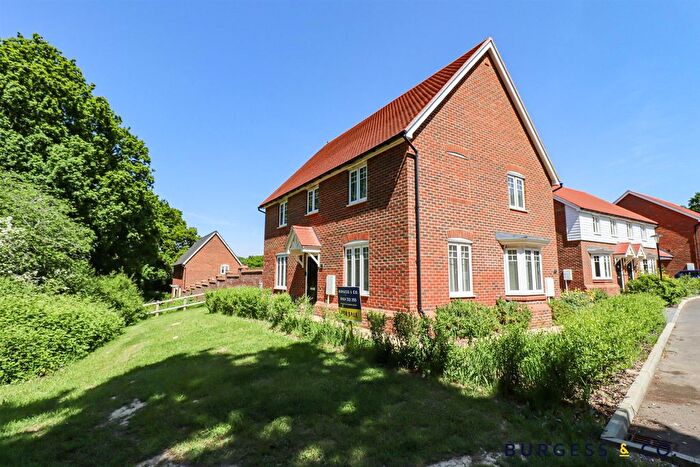
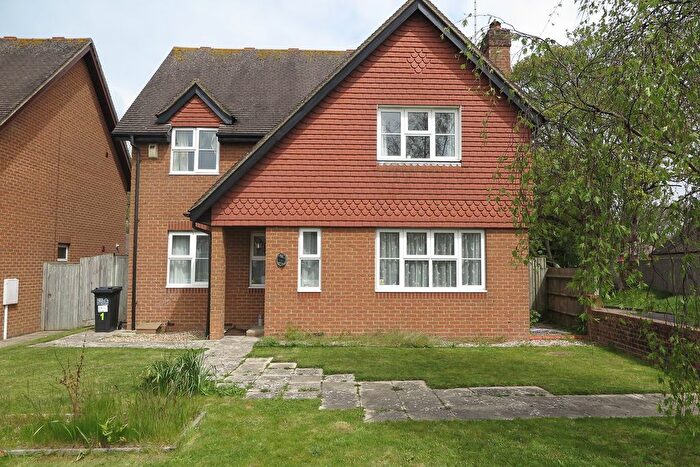
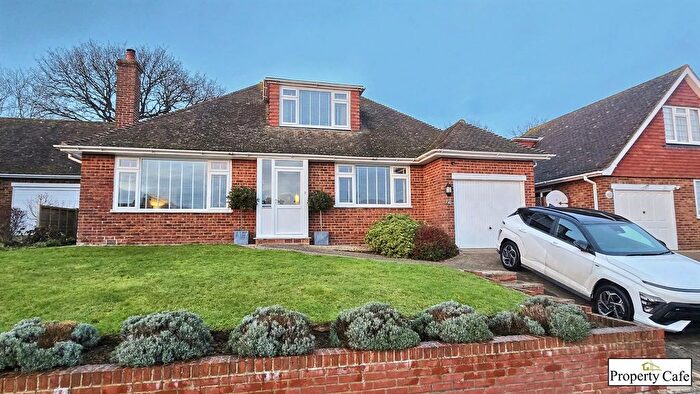
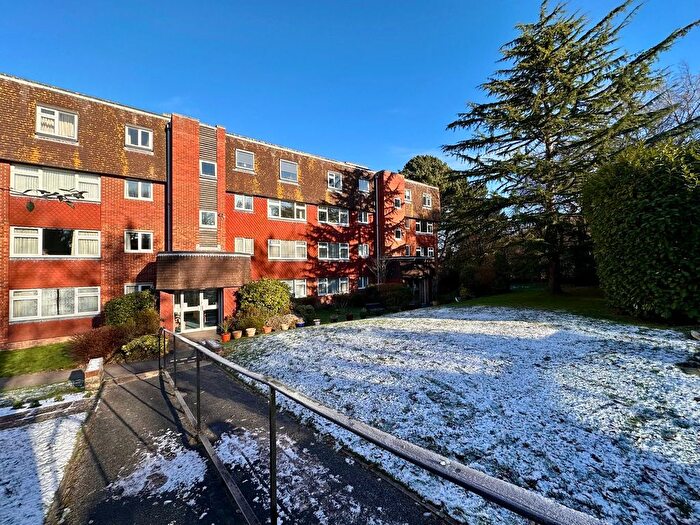
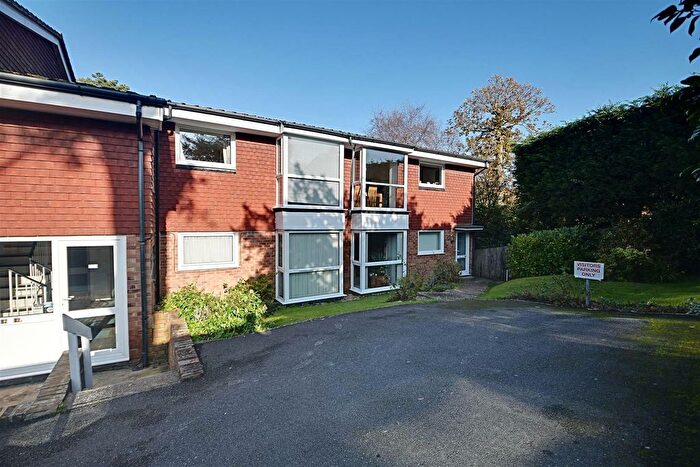
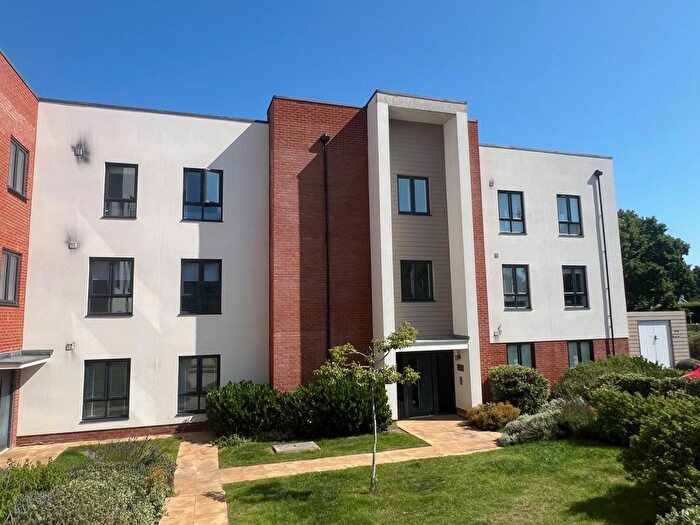
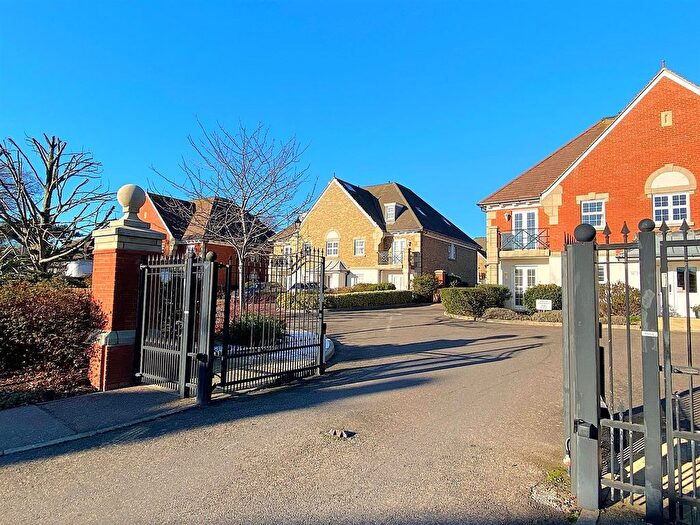
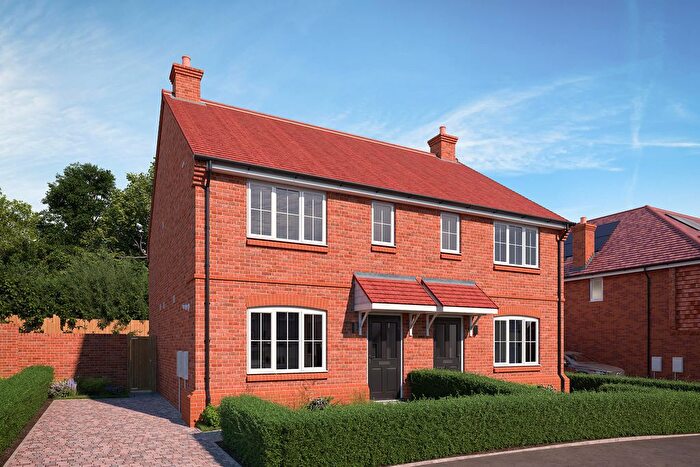
Properties for sale in St Marks
Roads and Postcodes in St Marks
Navigate through our locations to find the location of your next house in St Marks, Bexhill-on-sea for sale or to rent.
| Streets | Postcodes |
|---|---|
| Alfriston Close | TN39 4NH |
| Anderida Court | TN39 4XD |
| Antrona Close | TN39 4SW |
| Aspen Way | TN39 4RP |
| Barnhorn Close | TN39 4SE TN39 4SF TN39 4SH |
| Barnhorn Road | TN39 4QA TN39 4QB TN39 4QE TN39 4QG TN39 4QL TN39 4QQ TN39 4QR TN39 4QU |
| Beech Close | TN39 4NW |
| Berwick Close | TN39 4NB |
| Brackerne Close | TN39 3BT |
| Byworth Close | TN39 4NX |
| Chalden Place | TN39 4NF |
| Chelgates | TN39 3BU |
| Chestnut Walk | TN39 4PL TN39 4PS |
| Clavering Walk | TN39 4TN TN39 4TW |
| Coneyburrow Lane | TN39 4QP |
| Cooden Close | TN39 4TQ |
| Cooden Sea Road | TN39 4RW TN39 4SJ TN39 4SP TN39 4TA TN39 4TE TN39 4TH TN39 4TR |
| Coverdale Avenue | TN39 4TY |
| Cowdray Close | TN39 4NL |
| Cowdray Park Road | TN39 4EZ TN39 4ND |
| Eastergate | TN39 4NU |
| Elsted Road | TN39 3BG |
| Firtree Close | TN39 4TD |
| Fontwell Avenue | TN39 4ES TN39 4NE |
| Frant Avenue | TN39 4NG |
| Frant Close | TN39 4NT |
| Fyning Place | TN39 4NQ |
| Glynde Court | TN39 4XE |
| Grazebrook Close | TN39 4TB |
| Green Lane | TN39 4PH TN39 4PT |
| Hazelwood Close | TN39 4SX |
| Herbrand Walk | TN39 4BW TN39 4TX |
| Highwoods Avenue | TN39 4NN |
| Holland Avenue | TN39 4QD |
| Holly Close | TN39 4NP |
| Howards Crescent | TN39 4QH |
| Jevington Close | TN39 3BB |
| Kennel Lane | TN39 4RL |
| Kewhurst Avenue | TN39 3BH TN39 3BJ |
| Kites Nest Walk | TN39 4JX |
| Lavant Close | TN39 4NJ |
| Little Common Road | TN39 4SB |
| Little Twitten | TN39 4SS |
| Loxwood Close | TN39 4LX |
| Magpie Close | TN39 4EU |
| Mansell Close | TN39 4XA TN39 4XB |
| Maple Avenue | TN39 4ST |
| Maple Close | TN39 4SU |
| Maple Walk | TN39 4SN TN39 4SR |
| Meads Avenue | TN39 4SZ |
| Meads Road | TN39 4SY |
| Minsted Square | TN39 3BQ |
| Mulberry Close | TN39 4RX |
| Oakfield Way | TN39 4EY |
| Oakleigh Road | TN39 4PY |
| Ocklynge Close | TN39 4PF |
| Old Harrier Close | TN39 4FE |
| Osbern Close | TN39 4TJ TN39 4TL |
| Peartree Lane | TN39 4EA TN39 4NR TN39 4NS TN39 4PB TN39 4PD TN39 4PE TN39 4PG TN39 4PQ TN39 4QT TN39 4RQ |
| Pleyden Rise | TN39 4QZ |
| Popps Lane | TN39 3BL |
| Prowting Mead | TN39 4RY |
| Ravens Close | TN39 4TG |
| Sandhurst Lane | TN39 4RG TN39 4RH |
| Spindlewood Drive | TN39 4RR TN39 4RS TN39 4RT |
| Spring Lane | TN39 4ET |
| St Margarets Crescent | TN39 4RE |
| Sycamore Close | TN39 4PZ |
| The Broad Walk | TN39 4QJ |
| The Byeway | TN39 4PA |
| The Covert | TN39 4TP |
| The Gorses | TN39 3BE TN39 3BS |
| The Gorseway | TN39 4NA TN39 4PP TN39 4PR |
| The Twitten | TN39 4PJ |
| Ticehurst Avenue | TN39 4QY |
| Ticehurst Close | TN39 4QX |
| Tyndale Avenue | TN39 4TZ |
| Village Close | TN39 4TF |
| Village Mews | TN39 4RZ |
| Wartling Drive | TN39 4QN |
| Wealden Way | TN39 4NY TN39 4NZ |
| Whydown Cottages | TN39 4RD |
| Whydown Place | TN39 4RA |
| Whydown Road | TN39 4RB |
| Willow Drive | TN39 4PX |
| Withyham Road | TN39 3BA TN39 3BD |
| Woodlands | TN39 4RJ |
| Woodstock Road | TN39 4EX |
Transport near St Marks
- FAQ
- Price Paid By Year
- Property Type Price
Frequently asked questions about St Marks
What is the average price for a property for sale in St Marks?
The average price for a property for sale in St Marks is £508,146. This amount is 51% higher than the average price in Bexhill-on-sea. There are 1,543 property listings for sale in St Marks.
What streets have the most expensive properties for sale in St Marks?
The streets with the most expensive properties for sale in St Marks are Herbrand Walk at an average of £1,016,400, Clavering Walk at an average of £985,500 and Sandhurst Lane at an average of £865,000.
What streets have the most affordable properties for sale in St Marks?
The streets with the most affordable properties for sale in St Marks are Barnhorn Close at an average of £193,000, Glynde Court at an average of £198,333 and Osbern Close at an average of £213,833.
Which train stations are available in or near St Marks?
Some of the train stations available in or near St Marks are Cooden Beach, Collington and Bexhill.
Property Price Paid in St Marks by Year
The average sold property price by year was:
| Year | Average Sold Price | Price Change |
Sold Properties
|
|---|---|---|---|
| 2025 | £470,981 | -3% |
61 Properties |
| 2024 | £483,083 | -7% |
93 Properties |
| 2023 | £518,228 | -6% |
64 Properties |
| 2022 | £550,197 | 10% |
94 Properties |
| 2021 | £492,952 | 13% |
129 Properties |
| 2020 | £427,669 | 7% |
92 Properties |
| 2019 | £395,788 | 1% |
102 Properties |
| 2018 | £392,743 | 2% |
94 Properties |
| 2017 | £386,715 | 7% |
120 Properties |
| 2016 | £357,741 | 5% |
131 Properties |
| 2015 | £338,999 | 15% |
138 Properties |
| 2014 | £289,071 | 0,3% |
146 Properties |
| 2013 | £288,219 | 2% |
115 Properties |
| 2012 | £283,502 | -6% |
82 Properties |
| 2011 | £300,240 | 2% |
93 Properties |
| 2010 | £294,707 | 6% |
98 Properties |
| 2009 | £276,346 | -10% |
99 Properties |
| 2008 | £303,444 | -3% |
66 Properties |
| 2007 | £313,806 | 16% |
143 Properties |
| 2006 | £264,543 | 8% |
174 Properties |
| 2005 | £244,422 | -4% |
123 Properties |
| 2004 | £255,043 | 7% |
121 Properties |
| 2003 | £237,997 | 14% |
121 Properties |
| 2002 | £203,706 | 9% |
154 Properties |
| 2001 | £185,802 | 21% |
156 Properties |
| 2000 | £146,536 | 13% |
124 Properties |
| 1999 | £127,032 | 12% |
180 Properties |
| 1998 | £111,884 | 4% |
134 Properties |
| 1997 | £107,097 | 14% |
135 Properties |
| 1996 | £91,982 | -2% |
136 Properties |
| 1995 | £93,608 | - |
86 Properties |
Property Price per Property Type in St Marks
Here you can find historic sold price data in order to help with your property search.
The average Property Paid Price for specific property types in the last three years are:
| Property Type | Average Sold Price | Sold Properties |
|---|---|---|
| Semi Detached House | £418,831.00 | 36 Semi Detached Houses |
| Detached House | £590,425.00 | 220 Detached Houses |
| Terraced House | £331,187.00 | 8 Terraced Houses |
| Flat | £227,514.00 | 48 Flats |

