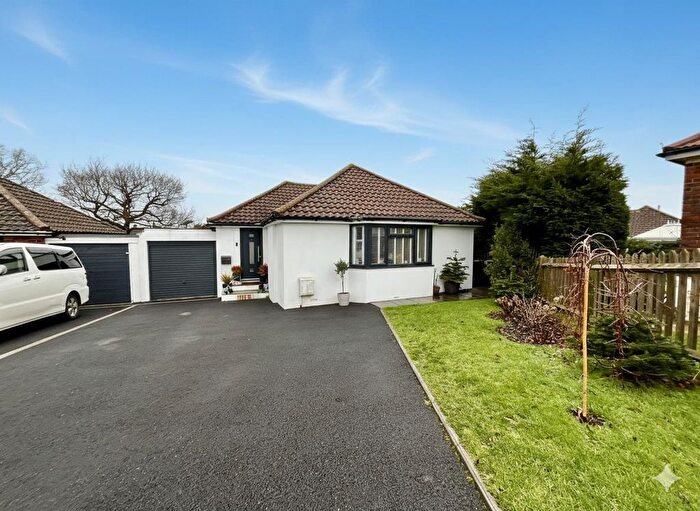
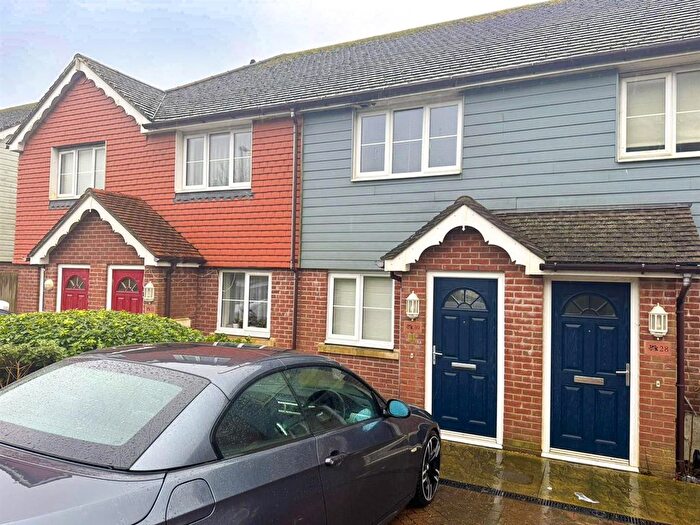
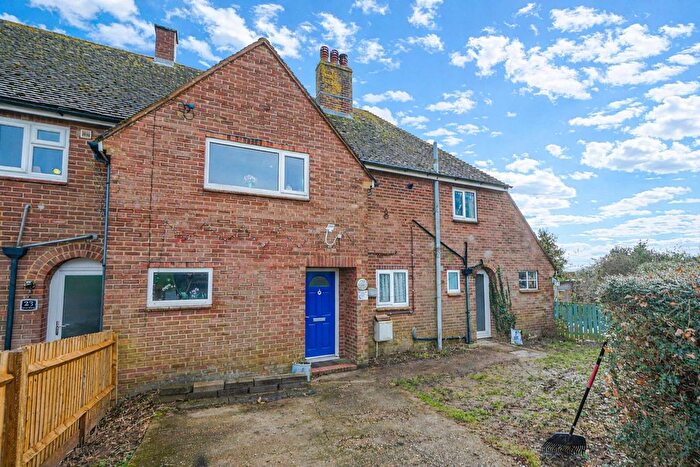
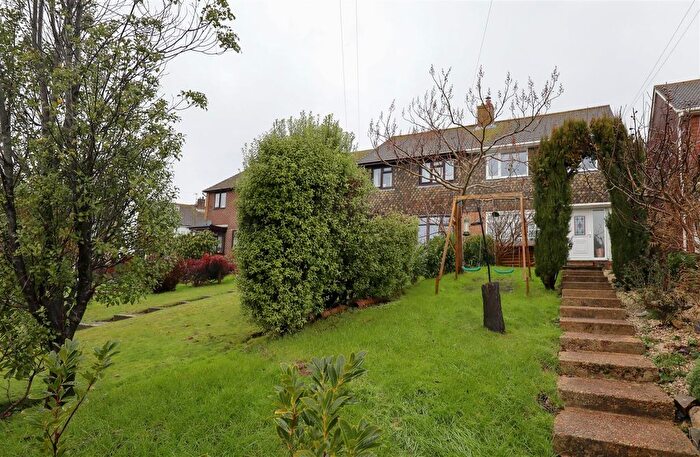
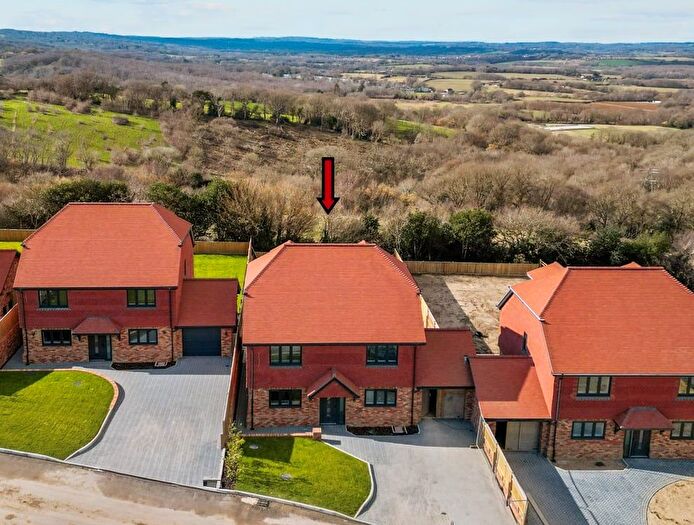
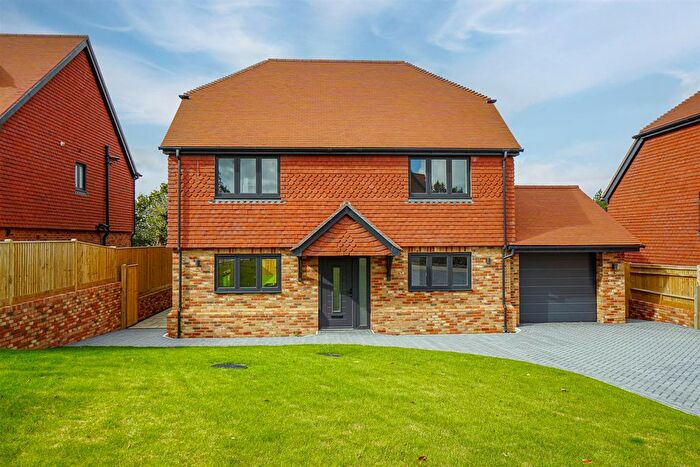
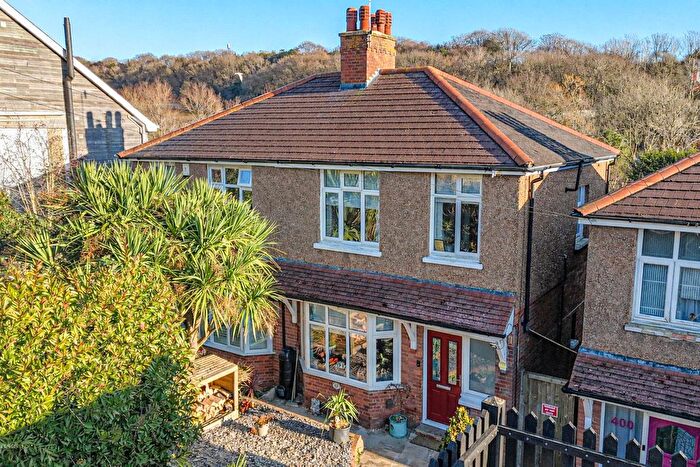
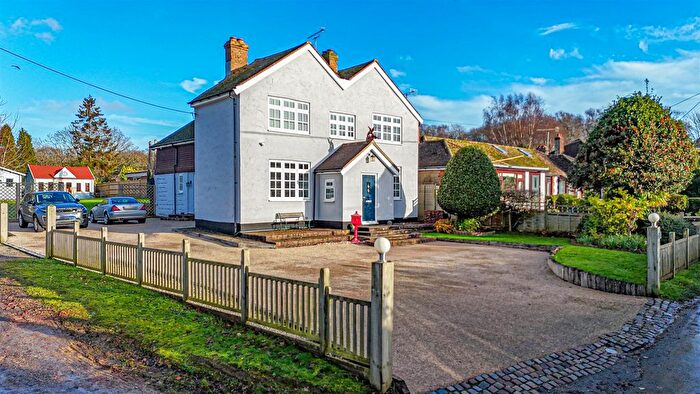
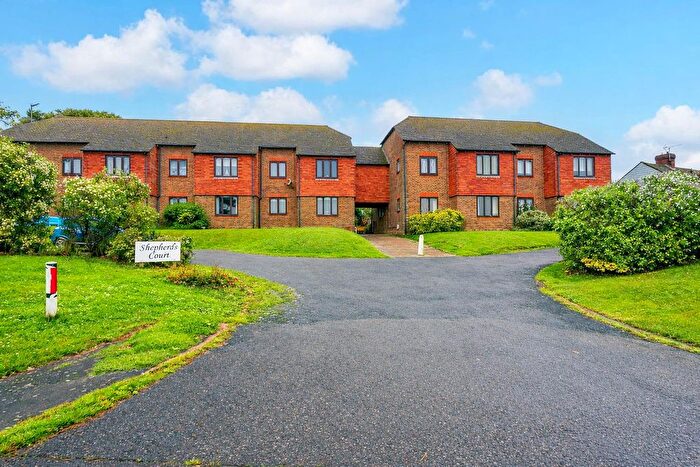
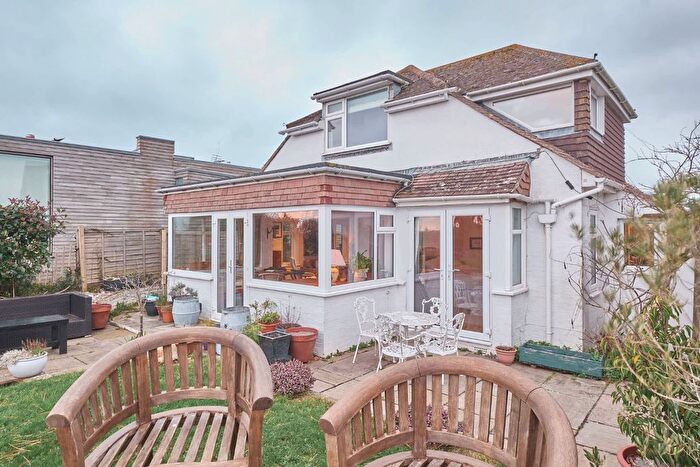
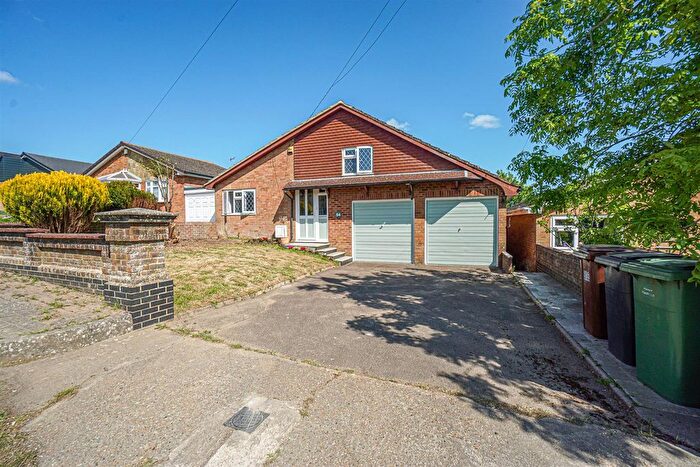
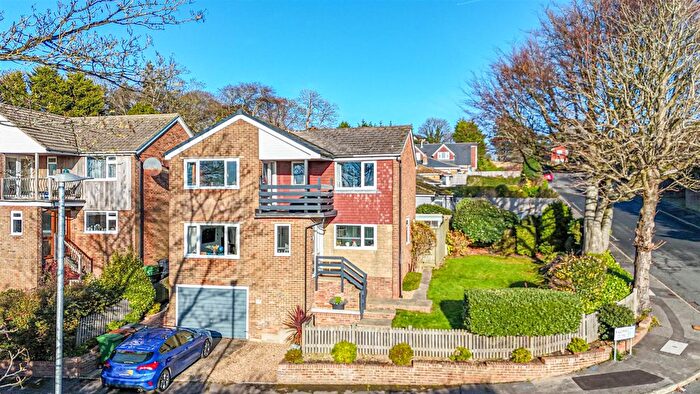
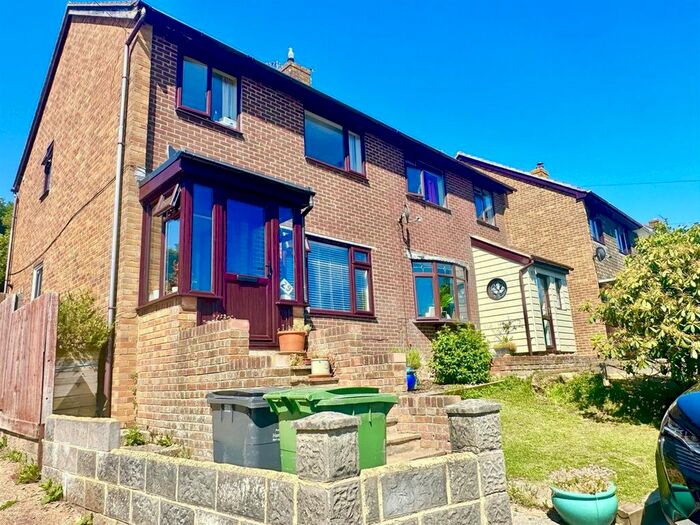
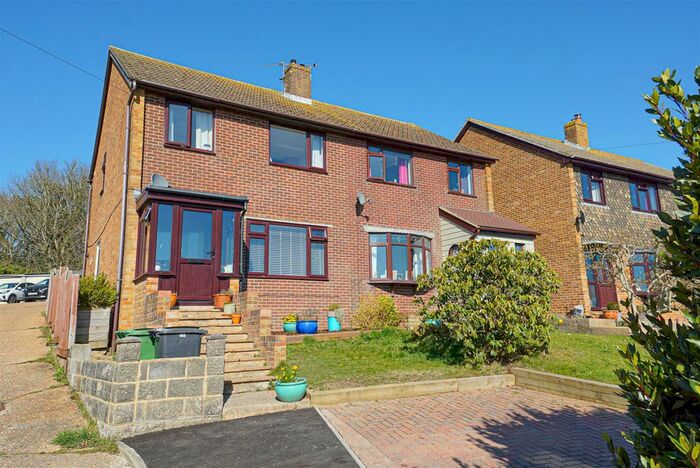
Houses for sale & to rent in Marsham, Hastings
House Prices in Marsham
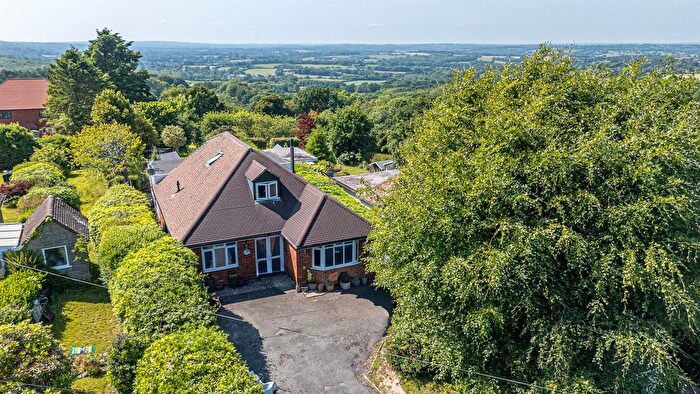
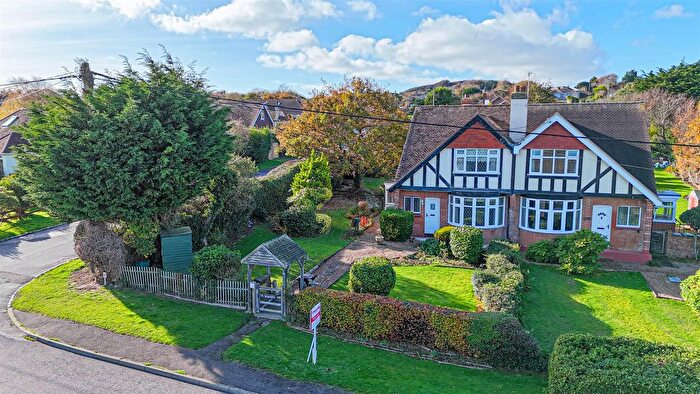
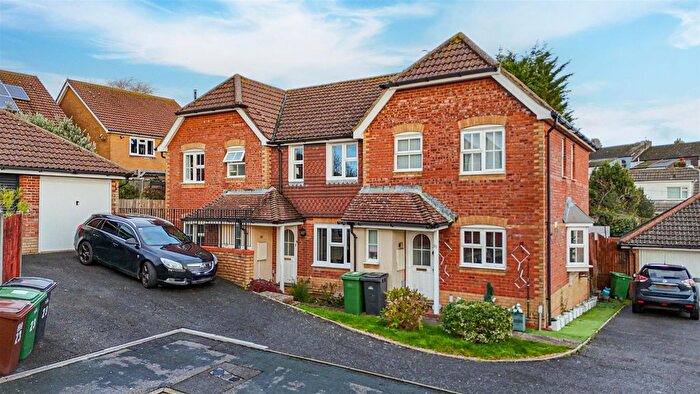
Properties in Marsham have an average house price of £531,112.00 and had 204 Property Transactions within the last 3 years¹.
Marsham is an area in Hastings, East Sussex with 1,754 households², where the most expensive property was sold for £1,750,000.00.
Properties for sale in Marsham
Roads and Postcodes in Marsham
Navigate through our locations to find the location of your next house in Marsham, Hastings for sale or to rent.
| Streets | Postcodes |
|---|---|
| Allards | TN35 4EZ |
| Arthurs Close | TN35 4DX |
| Austen Way | TN35 4JH |
| Battery Hill | TN35 4AL TN35 4AP |
| Blackthorn Way | TN35 4BJ |
| Bramble Way | TN35 4BH |
| Briar Close | TN35 4DP |
| Broadway | TN35 4DA |
| Butchers Lane | TN35 4NE TN35 4NG TN35 4NH TN35 4NQ |
| Channel Way | TN35 4BP |
| Chapel Lane | TN35 4HL TN35 4HN TN35 4HP |
| Chick Hill | TN35 4EG TN35 4EQ |
| Chowns Hill | TN35 4PA |
| Church Lane | TN35 4HS TN35 4HU |
| Cliff End Lane | TN35 4EF |
| Cliff Way | TN35 4DT |
| Clinton Way | TN35 4DL |
| Coastguard Lane | TN35 4AB |
| Commanders Walk | TN35 4BE |
| Denehurst Gardens | TN35 4PB |
| Doleham Hill | TN35 4NA |
| Eight Acre Lane | TN35 4NL |
| Eighteen Pounder Lane | TN35 4NU |
| Elm Lane | TN35 4JD TN35 4JF |
| Fairlight Gardens | TN35 4AY |
| Farley Way | TN35 4AS |
| Fourteen Acre Lane | TN35 4NB |
| Friars Bank | TN35 4EJ |
| Friars Crescent | TN35 4ES |
| Friars Hill | TN35 4EP TN35 4ET TN35 4HJ |
| Friars Hill Terrace | TN35 4ER |
| Fyrsway | TN35 4BG |
| Gorsethorn Way | TN35 4BQ |
| Heather Way | TN35 4BL |
| Higham Gardens | TN35 4HR |
| Hill Road | TN35 4AE |
| Ivyhouse Lane | TN35 4NP |
| Knowle Road | TN35 4AT |
| Lower Waites Lane | TN35 4DB TN35 4DD |
| Marsham Brook Lane | TN35 4HF |
| Maxfield Lane | TN35 4NJ |
| Meadow Way | TN35 4BN |
| Morgay Wood Lane | TN35 4NF |
| New Coastguard Cottages | TN35 4EW |
| North Lane | TN35 4LX TN35 4LY |
| Pannel Lane | TN35 4JB |
| Peter James Lane | TN35 4AH TN35 4AJ |
| Pett Level Road | TN35 4EA TN35 4ED TN35 4EE TN35 4EH |
| Pett Road | TN35 4EX TN35 4EY TN35 4HA TN35 4HB TN35 4HD TN35 4HE TN35 4HG TN35 4HH TN35 4JA TN35 4JG |
| Pinetree Hill | TN35 4BS |
| Primrose Hill | TN35 4DN |
| Rectory Park | TN35 4EU |
| Rock Lane | TN35 4JJ TN35 4NX TN35 4NY |
| Rockmead Road | TN35 4DJ |
| Rosemary Lane | TN35 4EB |
| Sawyers Row | TN35 4AF |
| Sea Road | TN35 4DR |
| Shepherds Way | TN35 4BB TN35 4BD |
| Smugglers Way | TN35 4DG TN35 4DH |
| Stockdale | TN35 4DQ |
| The Avenue | TN35 4DE |
| The Close | TN35 4AQ |
| The Thorne | TN35 4LU |
| Toot Rock | TN35 4EN |
| Waites Lane | TN35 4AR TN35 4AX |
| Warren Road | TN35 4AG TN35 4AN |
| Watermill Lane | TN35 4HX TN35 4HY TN35 4HZ |
| Willow Stream Close | TN35 4ND |
| Winchelsea Road | TN35 4LW |
| Woodland Way | TN35 4AU |
| TN35 4LP TN35 4LR TN35 4LS TN35 4LT |
Transport near Marsham
- FAQ
- Price Paid By Year
- Property Type Price
Frequently asked questions about Marsham
What is the average price for a property for sale in Marsham?
The average price for a property for sale in Marsham is £531,112. This amount is 69% higher than the average price in Hastings. There are 1,728 property listings for sale in Marsham.
What streets have the most expensive properties for sale in Marsham?
The streets with the most expensive properties for sale in Marsham are Pett Level Road at an average of £1,272,500, Eighteen Pounder Lane at an average of £960,000 and Warren Road at an average of £900,000.
What streets have the most affordable properties for sale in Marsham?
The streets with the most affordable properties for sale in Marsham are Fairlight Gardens at an average of £186,625, Doleham Hill at an average of £256,500 and Sea Road at an average of £342,666.
Which train stations are available in or near Marsham?
Some of the train stations available in or near Marsham are Three Oaks, Doleham and Ore.
Property Price Paid in Marsham by Year
The average sold property price by year was:
| Year | Average Sold Price | Price Change |
Sold Properties
|
|---|---|---|---|
| 2025 | £514,924 | -2% |
33 Properties |
| 2024 | £523,037 | 2% |
40 Properties |
| 2023 | £511,883 | -9% |
54 Properties |
| 2022 | £555,730 | 8% |
77 Properties |
| 2021 | £512,961 | 13% |
110 Properties |
| 2020 | £444,213 | 3% |
70 Properties |
| 2019 | £428,892 | 5% |
61 Properties |
| 2018 | £405,590 | 3% |
62 Properties |
| 2017 | £393,296 | 12% |
89 Properties |
| 2016 | £344,211 | -7% |
89 Properties |
| 2015 | £366,804 | 16% |
90 Properties |
| 2014 | £308,755 | 2% |
90 Properties |
| 2013 | £302,854 | -2% |
78 Properties |
| 2012 | £309,189 | 3% |
73 Properties |
| 2011 | £301,268 | 1% |
74 Properties |
| 2010 | £297,967 | 10% |
79 Properties |
| 2009 | £268,133 | -18% |
78 Properties |
| 2008 | £316,470 | 1% |
55 Properties |
| 2007 | £314,414 | 11% |
114 Properties |
| 2006 | £280,305 | 4% |
90 Properties |
| 2005 | £268,863 | 5% |
85 Properties |
| 2004 | £256,020 | 11% |
96 Properties |
| 2003 | £227,041 | 12% |
76 Properties |
| 2002 | £199,588 | 21% |
86 Properties |
| 2001 | £156,791 | 10% |
106 Properties |
| 2000 | £140,654 | 2% |
78 Properties |
| 1999 | £138,239 | 20% |
88 Properties |
| 1998 | £111,244 | 8% |
91 Properties |
| 1997 | £101,900 | 14% |
120 Properties |
| 1996 | £87,830 | 16% |
94 Properties |
| 1995 | £73,777 | - |
88 Properties |
Property Price per Property Type in Marsham
Here you can find historic sold price data in order to help with your property search.
The average Property Paid Price for specific property types in the last three years are:
| Property Type | Average Sold Price | Sold Properties |
|---|---|---|
| Semi Detached House | £415,865.00 | 26 Semi Detached Houses |
| Detached House | £583,790.00 | 156 Detached Houses |
| Terraced House | £346,248.00 | 13 Terraced Houses |
| Flat | £218,000.00 | 9 Flats |

