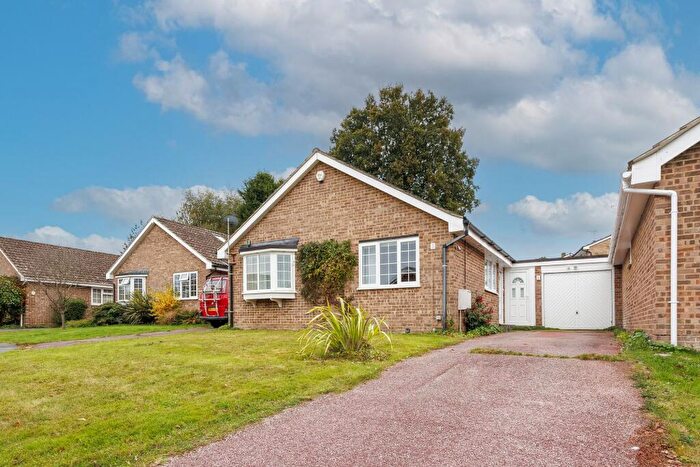
Houses for sale & to rent in Chailey And Wivelsfield, Lewes
House Prices in Chailey And Wivelsfield
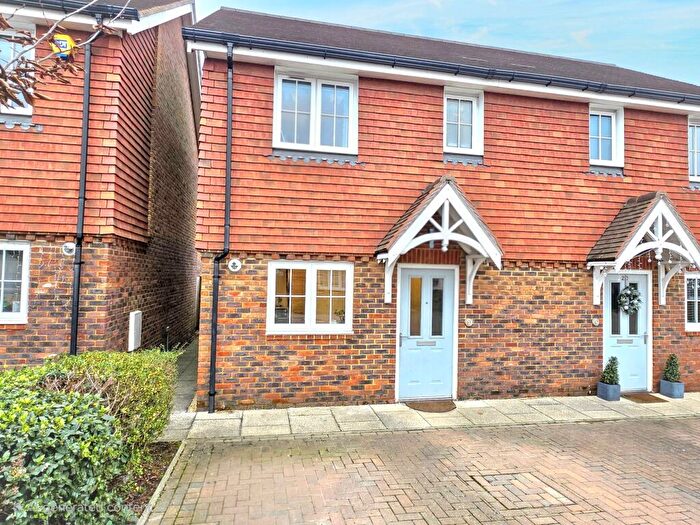
Properties in Chailey And Wivelsfield have an average house price of £662,058.00 and had 113 Property Transactions within the last 3 years¹.
Chailey And Wivelsfield is an area in Lewes, East Sussex with 1,044 households², where the most expensive property was sold for £2,661,100.00.
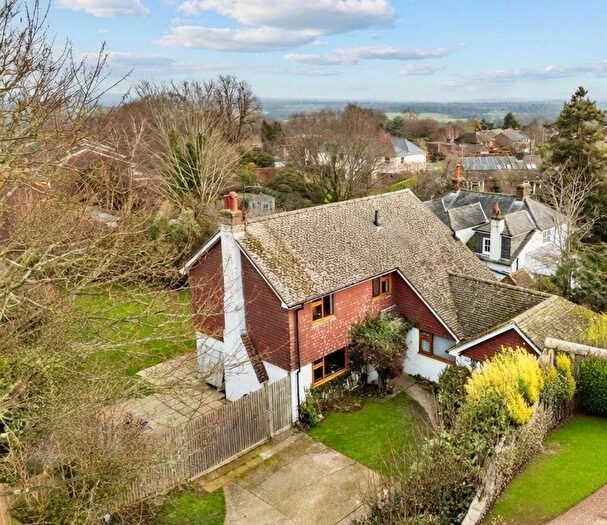
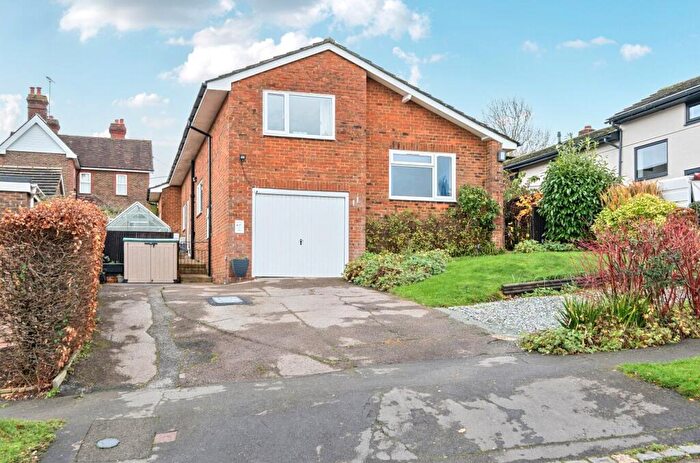
Properties for sale in Chailey And Wivelsfield
Roads and Postcodes in Chailey And Wivelsfield
Navigate through our locations to find the location of your next house in Chailey And Wivelsfield, Lewes for sale or to rent.
| Streets | Postcodes |
|---|---|
| Andros Close | BN8 4AT |
| Appledene Corner | BN8 4AF |
| Banks Road | BN8 4JG |
| Beggars Wood Lane | BN8 4DZ |
| Broomfields | BN8 4AG |
| Caveridge Lane | BN8 4BA |
| Chailey Green | BN8 4DA |
| Cinder Hill | BN8 4HP BN8 4HR BN8 4HS |
| Coldharbour Lane | BN8 4HJ |
| Cornwells Bank | BN8 4RH |
| Downs View | BN8 4HB |
| Downs View Close | BN8 4HA |
| East Grinstead Road | BN8 4DB BN8 4DD BN8 4DH BN8 4HX BN8 4JA BN8 4JB BN8 4JD |
| Great Rough | BN8 4HY |
| Green Lane | BN8 4BT |
| Haywards Heath Road | BN8 4DL BN8 4DP BN8 4DR BN8 4DS BN8 4DT BN8 4ES BN8 4ET BN8 4EU BN8 4EX BN8 4EY BN8 4EZ |
| Hazeldene Lane | BN8 4HH |
| Hornbuckles Close | BN8 4AH |
| Jackies Lane | BN8 4QX |
| Kilnwood Lane | BN8 4AU |
| Lane End Common | BN8 4JH |
| Lower Station Road | BN8 4HT BN8 4HU |
| Markstakes Corner | BN8 4BP |
| Markstakes Lane | BN8 4BS |
| Mill Brooks | BN8 4AW |
| Mill Close | BN8 4QA |
| Mill Lane | BN8 4AY BN8 4AZ BN8 4EG BN8 4PU |
| New Heritage Way | BN8 4GD BN8 4GE BN8 4GF |
| North Common Road | BN8 4EB BN8 4ED BN8 4EH |
| Old Foord Close | BN8 4HL |
| Oxbottom Close | BN8 4NQ |
| Plumpton Road | BN8 4EJ |
| Setfords Field | BN8 4BX |
| South Common Cottages | BN8 4AN |
| South Street | BN8 4BB BN8 4BD BN8 4BG BN8 4BH BN8 4BJ BN8 4BQ |
| St James Walk | BN8 4BU |
| St Johns Close | BN8 4AX |
| Station Road | BN8 4HD BN8 4HE BN8 4HG BN8 4HQ BN8 4PJ |
| Swan Close | BN8 4AQ |
| Swan Court | BN8 4BN |
| The Martlets | BN8 4QG |
| Warrenwood | BN8 4JR |
| Warrs Hill Road | BN8 4JE |
| Whitegates Close | BN8 4AE |
| Willow Gardens | BN8 4BY |
| BN8 4AB BN8 4AD BN8 4AJ BN8 4AP BN8 4QH BN8 4RA BN8 4RS |
Transport near Chailey And Wivelsfield
-
Plumpton Station
-
Cooksbridge Station
-
Wivelsfield Station
-
Burgess Hill Station
-
Haywards Heath Station
- FAQ
- Price Paid By Year
- Property Type Price
Frequently asked questions about Chailey And Wivelsfield
What is the average price for a property for sale in Chailey And Wivelsfield?
The average price for a property for sale in Chailey And Wivelsfield is £662,058. This amount is 16% higher than the average price in Lewes. There are 566 property listings for sale in Chailey And Wivelsfield.
What streets have the most expensive properties for sale in Chailey And Wivelsfield?
The streets with the most expensive properties for sale in Chailey And Wivelsfield are Warrenwood at an average of £2,200,000, Cinder Hill at an average of £1,385,257 and Lower Station Road at an average of £1,371,220.
What streets have the most affordable properties for sale in Chailey And Wivelsfield?
The streets with the most affordable properties for sale in Chailey And Wivelsfield are Downs View at an average of £245,000, Markstakes Corner at an average of £267,500 and Whitegates Close at an average of £268,017.
Which train stations are available in or near Chailey And Wivelsfield?
Some of the train stations available in or near Chailey And Wivelsfield are Plumpton, Cooksbridge and Wivelsfield.
Property Price Paid in Chailey And Wivelsfield by Year
The average sold property price by year was:
| Year | Average Sold Price | Price Change |
Sold Properties
|
|---|---|---|---|
| 2025 | £503,533 | -38% |
15 Properties |
| 2024 | £692,372 | 14% |
36 Properties |
| 2023 | £598,391 | -22% |
22 Properties |
| 2022 | £729,240 | 20% |
40 Properties |
| 2021 | £580,265 | 20% |
43 Properties |
| 2020 | £465,123 | 18% |
34 Properties |
| 2019 | £380,303 | -58% |
33 Properties |
| 2018 | £602,233 | 24% |
30 Properties |
| 2017 | £458,905 | 5% |
26 Properties |
| 2016 | £435,629 | -9% |
39 Properties |
| 2015 | £475,631 | 0,2% |
41 Properties |
| 2014 | £474,767 | -5% |
41 Properties |
| 2013 | £497,435 | 10% |
40 Properties |
| 2012 | £449,778 | 5% |
32 Properties |
| 2011 | £425,806 | -4% |
27 Properties |
| 2010 | £440,723 | 33% |
43 Properties |
| 2009 | £294,221 | -26% |
37 Properties |
| 2008 | £369,368 | -16% |
35 Properties |
| 2007 | £427,775 | 20% |
54 Properties |
| 2006 | £342,574 | 9% |
49 Properties |
| 2005 | £312,034 | -2% |
42 Properties |
| 2004 | £318,316 | 11% |
48 Properties |
| 2003 | £283,796 | 3% |
50 Properties |
| 2002 | £275,143 | 20% |
59 Properties |
| 2001 | £219,272 | 17% |
47 Properties |
| 2000 | £182,848 | 15% |
44 Properties |
| 1999 | £154,570 | -8% |
46 Properties |
| 1998 | £166,684 | 7% |
57 Properties |
| 1997 | £155,660 | 12% |
62 Properties |
| 1996 | £136,566 | 13% |
47 Properties |
| 1995 | £118,558 | - |
26 Properties |
Property Price per Property Type in Chailey And Wivelsfield
Here you can find historic sold price data in order to help with your property search.
The average Property Paid Price for specific property types in the last three years are:
| Property Type | Average Sold Price | Sold Properties |
|---|---|---|
| Semi Detached House | £505,725.00 | 20 Semi Detached Houses |
| Detached House | £861,490.00 | 64 Detached Houses |
| Terraced House | £364,255.00 | 20 Terraced Houses |
| Flat | £253,067.00 | 9 Flats |

