Houses for sale & to rent in Newick, Lewes
House Prices in Newick
Properties in Newick have an average house price of £650,111.00 and had 115 Property Transactions within the last 3 years¹.
Newick is an area in Lewes, East Sussex with 971 households², where the most expensive property was sold for £2,600,000.00.
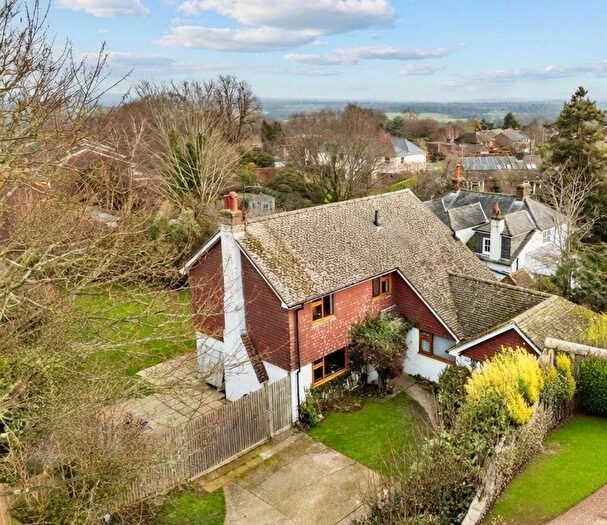
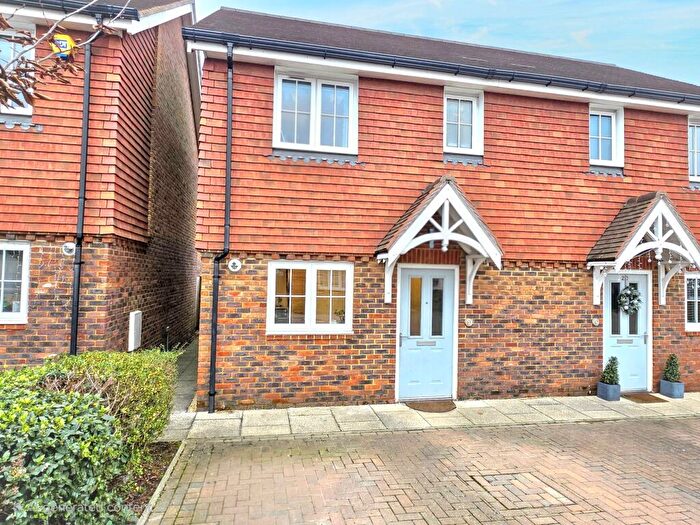
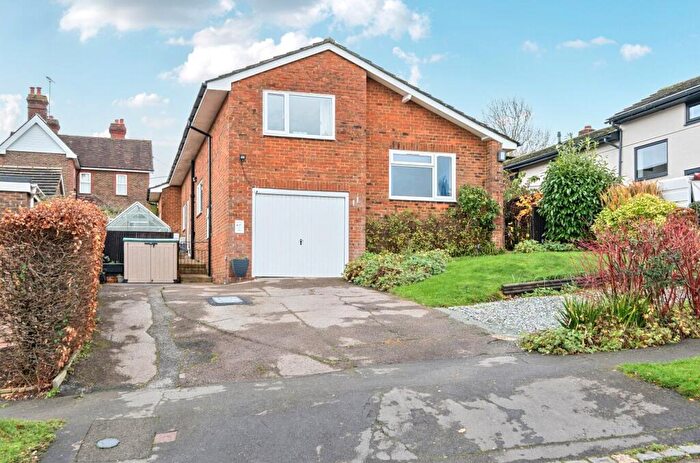
Properties for sale in Newick
Roads and Postcodes in Newick
Navigate through our locations to find the location of your next house in Newick, Lewes for sale or to rent.
| Streets | Postcodes |
|---|---|
| Acerlands | BN8 4LU |
| Alexander Mead | BN8 4LX |
| Allington Crescent | BN8 4NT |
| Allington Place | BN8 4RF |
| Allington Road | BN8 4NA BN8 4NB BN8 4ND BN8 4NH |
| Badens Close | BN8 4NL |
| Bannisters Field | BN8 4JS |
| Blind Lane | BN8 4JT |
| Brooks Gardens | BN8 4NN |
| Chailey Lane | BN8 4SD |
| Church Road | BN8 4JU BN8 4JX BN8 4JY BN8 4JZ |
| Cockfield Lane | BN8 4RP |
| Cornwells Bank | BN8 4RD BN8 4RJ BN8 4RL BN8 4RX |
| Cricketfield | BN8 4LL BN8 4PE |
| East Grinstead Road | TN22 3FB |
| Fletching Common | BN8 4JJ |
| Fletching Lane | BN8 4JP |
| Font Hill | BN8 4RT |
| Godden Road | BN8 4NE |
| Goldbridge Road | BN8 4LD BN8 4QP |
| Growers End | BN8 4NG |
| Harmers Hill | BN8 4LJ BN8 4QU |
| High Hurst Close | BN8 4NJ |
| High Street | BN8 4LG BN8 4LQ |
| Jackies Lane | BN8 4QT BN8 4FB |
| Langridges Close | BN8 4LZ |
| Leveller End | BN8 4PN |
| Leveller Road | BN8 4PL |
| Mantell Close | BN8 4FA |
| Marbles Road | BN8 4LR BN8 4LT |
| Millfield Close | BN8 4NP |
| Newick Drive | BN8 4NY BN8 4NZ BN8 4PA BN8 4PB |
| Newick Hill | BN8 4QR |
| Newlands Park Way | BN8 4PG |
| North Lodge | BN8 4LY |
| Oldaker Road | BN8 4LN BN8 4LP BN8 4LW |
| Oxbottom | BN8 4RB |
| Oxbottom Lane | BN8 4FD |
| Paynters Way | BN8 4PH |
| Powell Road | BN8 4LS |
| Ridgelands Lane | BN8 4RR |
| South Rough | BN8 4NW |
| Springfields | BN8 4PQ |
| The Green | BN8 4LA BN8 4LB |
| The Pagets | BN8 4PW |
| The Ridings | BN8 4SH |
| The Rough | BN8 4NS |
| Vernons Road | BN8 4NF |
| West Point | BN8 4NU |
| Western Road | BN8 4LE BN8 4LF BN8 4NX |
| Windyacre Drive | BN8 4PD |
| Woodbine Lane | BN8 4LH |
| BN8 4SB |
Transport near Newick
- FAQ
- Price Paid By Year
- Property Type Price
Frequently asked questions about Newick
What is the average price for a property for sale in Newick?
The average price for a property for sale in Newick is £650,111. This amount is 14% higher than the average price in Lewes. There are 261 property listings for sale in Newick.
What streets have the most expensive properties for sale in Newick?
The streets with the most expensive properties for sale in Newick are Newick Hill at an average of £2,600,000, Cockfield Lane at an average of £2,250,000 and Allington Place at an average of £1,350,000.
What streets have the most affordable properties for sale in Newick?
The streets with the most affordable properties for sale in Newick are Allington Crescent at an average of £345,750, Leveller Road at an average of £381,000 and Cricketfield at an average of £402,166.
Which train stations are available in or near Newick?
Some of the train stations available in or near Newick are Uckfield, Plumpton and Cooksbridge.
Property Price Paid in Newick by Year
The average sold property price by year was:
| Year | Average Sold Price | Price Change |
Sold Properties
|
|---|---|---|---|
| 2025 | £607,911 | -14% |
17 Properties |
| 2024 | £690,660 | -6% |
41 Properties |
| 2023 | £729,126 | 24% |
26 Properties |
| 2022 | £553,353 | 2% |
31 Properties |
| 2021 | £539,812 | 19% |
53 Properties |
| 2020 | £436,159 | -22% |
22 Properties |
| 2019 | £530,376 | 3% |
42 Properties |
| 2018 | £515,924 | 17% |
39 Properties |
| 2017 | £428,477 | -15% |
40 Properties |
| 2016 | £490,607 | 4% |
28 Properties |
| 2015 | £471,825 | -2% |
34 Properties |
| 2014 | £483,316 | 20% |
36 Properties |
| 2013 | £384,908 | -9% |
42 Properties |
| 2012 | £421,259 | 19% |
48 Properties |
| 2011 | £339,921 | -17% |
19 Properties |
| 2010 | £398,178 | -13% |
33 Properties |
| 2009 | £450,774 | 11% |
36 Properties |
| 2008 | £399,526 | -15% |
17 Properties |
| 2007 | £460,168 | 22% |
48 Properties |
| 2006 | £360,444 | 10% |
47 Properties |
| 2005 | £323,028 | 8% |
42 Properties |
| 2004 | £296,202 | -0,3% |
37 Properties |
| 2003 | £297,181 | 11% |
54 Properties |
| 2002 | £265,364 | 7% |
46 Properties |
| 2001 | £245,635 | 15% |
38 Properties |
| 2000 | £209,270 | 17% |
27 Properties |
| 1999 | £173,821 | 29% |
48 Properties |
| 1998 | £122,806 | -14% |
29 Properties |
| 1997 | £139,860 | 13% |
50 Properties |
| 1996 | £122,304 | -6% |
43 Properties |
| 1995 | £130,131 | - |
36 Properties |
Property Price per Property Type in Newick
Here you can find historic sold price data in order to help with your property search.
The average Property Paid Price for specific property types in the last three years are:
| Property Type | Average Sold Price | Sold Properties |
|---|---|---|
| Semi Detached House | £427,986.00 | 36 Semi Detached Houses |
| Detached House | £842,352.00 | 62 Detached Houses |
| Terraced House | £429,968.00 | 16 Terraced Houses |
| Flat | £250,000.00 | 1 Flat |

