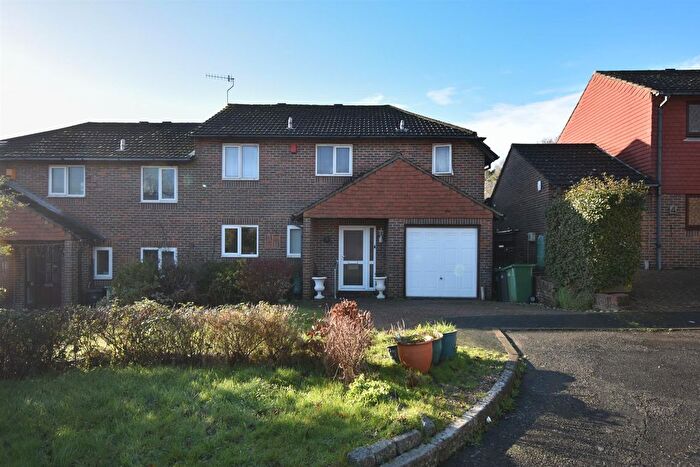
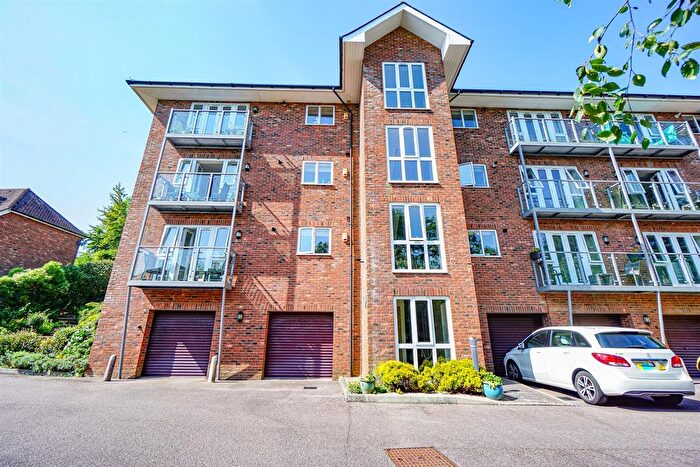
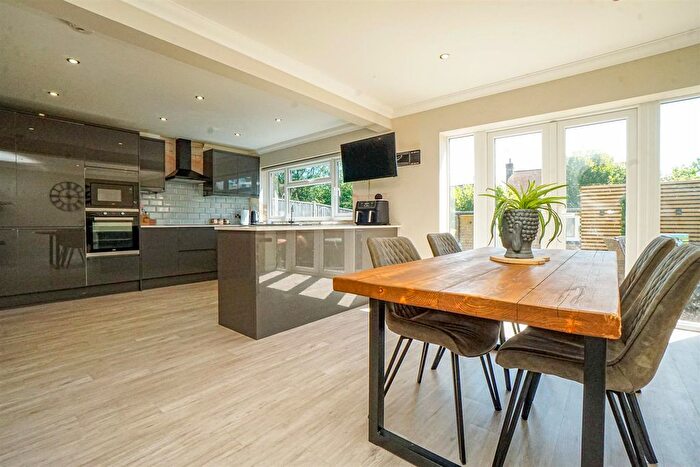
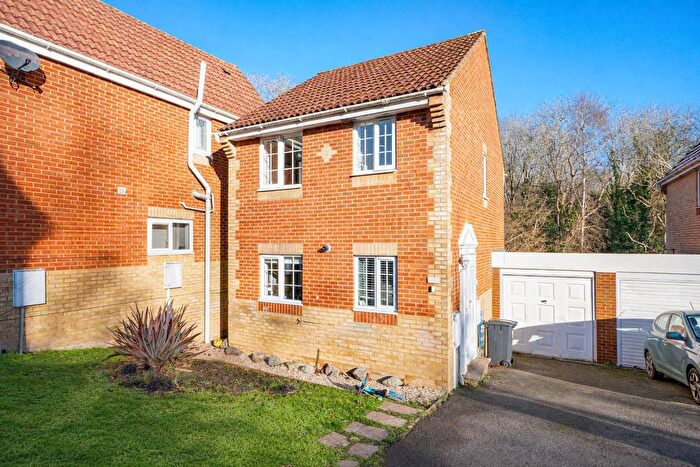
Houses for sale & to rent in Hollington, St Leonards-on-sea
House Prices in Hollington
Properties in Hollington have an average house price of £272,321.00 and had 237 Property Transactions within the last 3 years¹.
Hollington is an area in St Leonards-on-sea, East Sussex with 2,415 households², where the most expensive property was sold for £600,000.00.
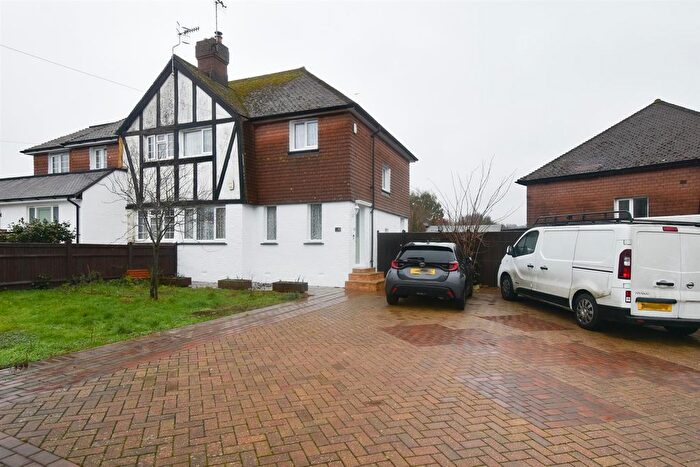
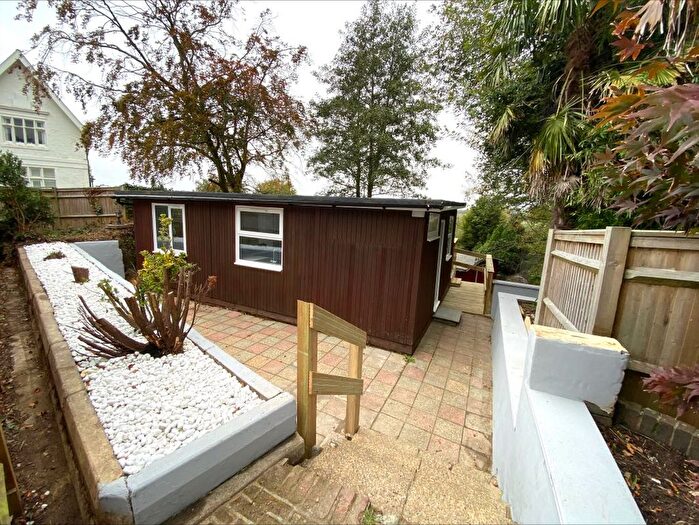
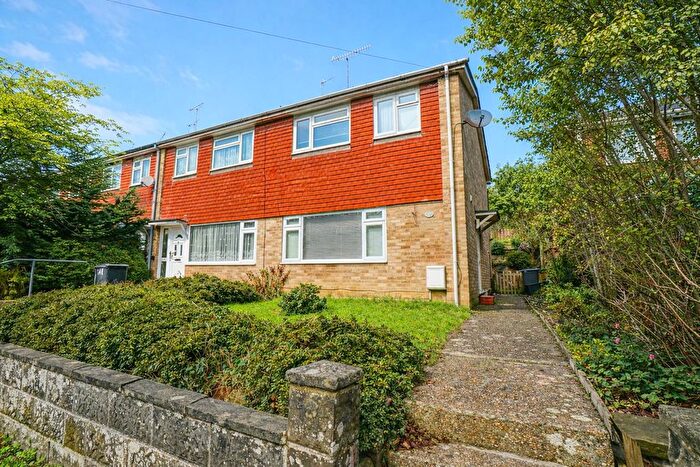
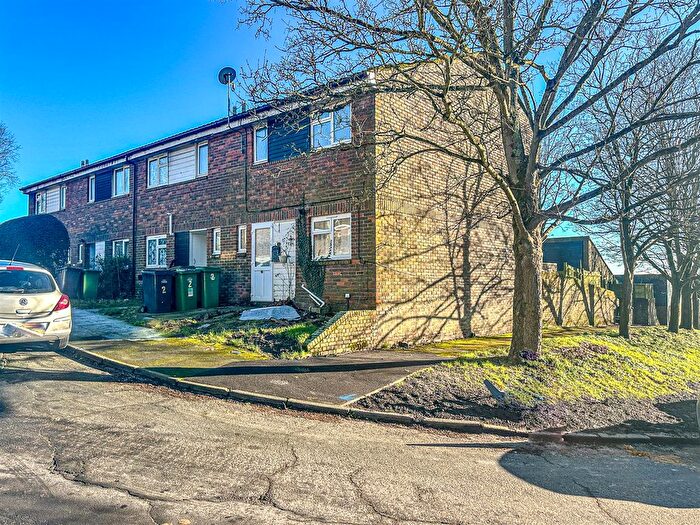
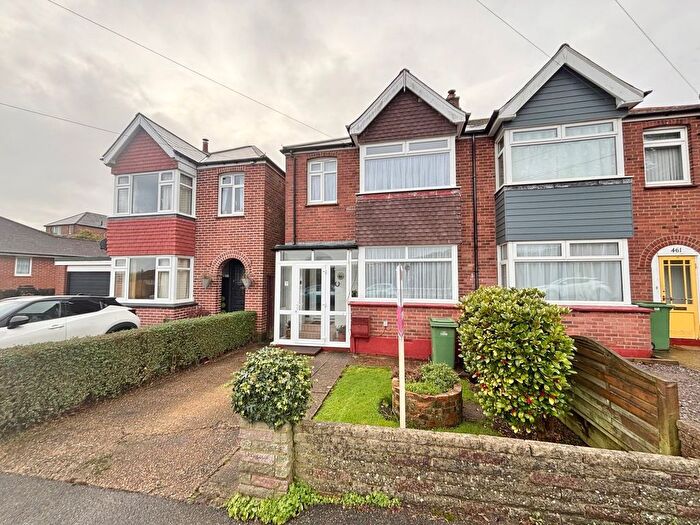
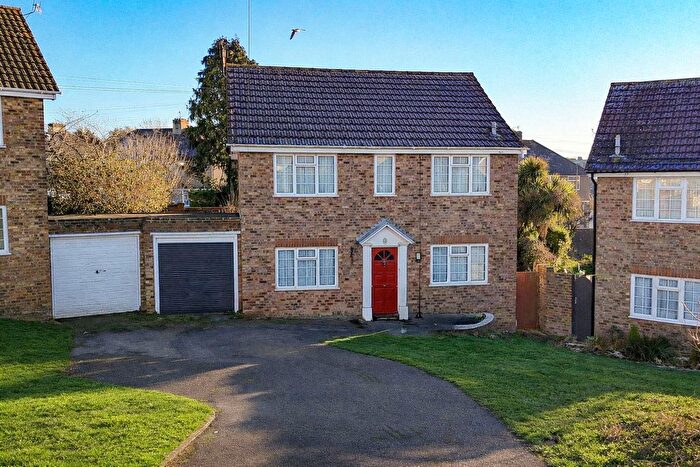
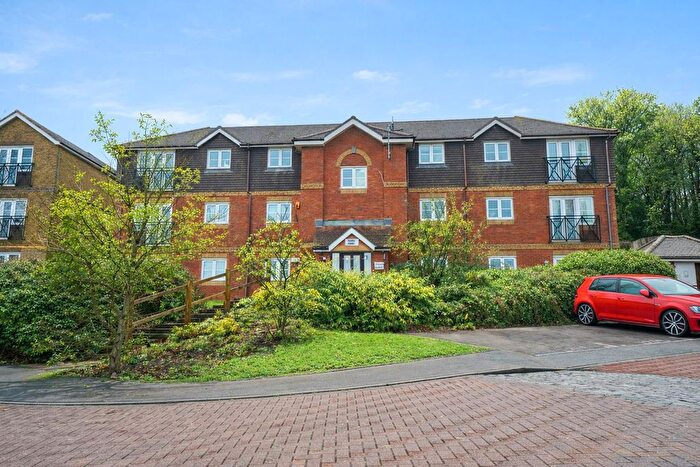
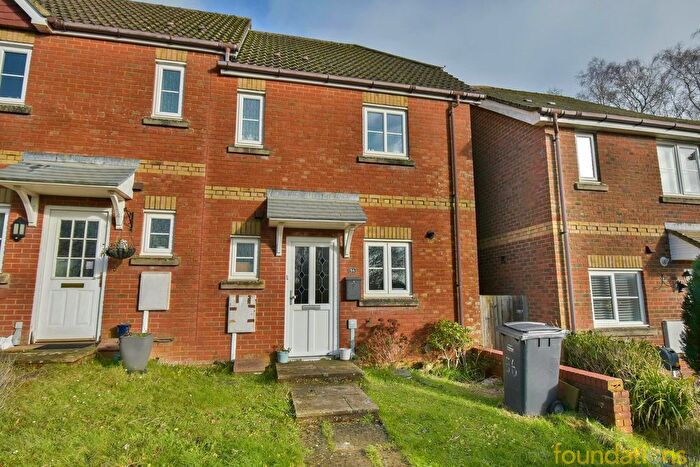
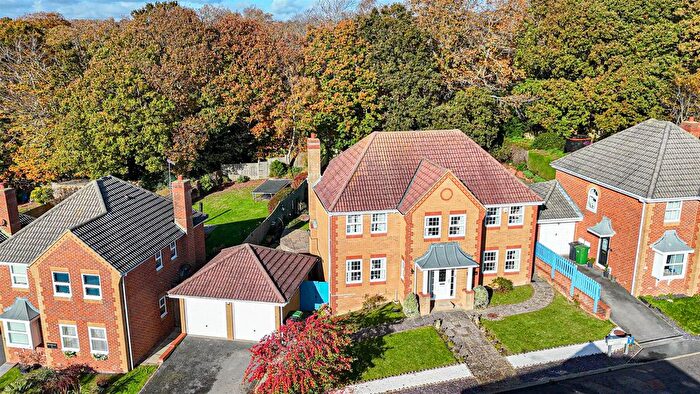
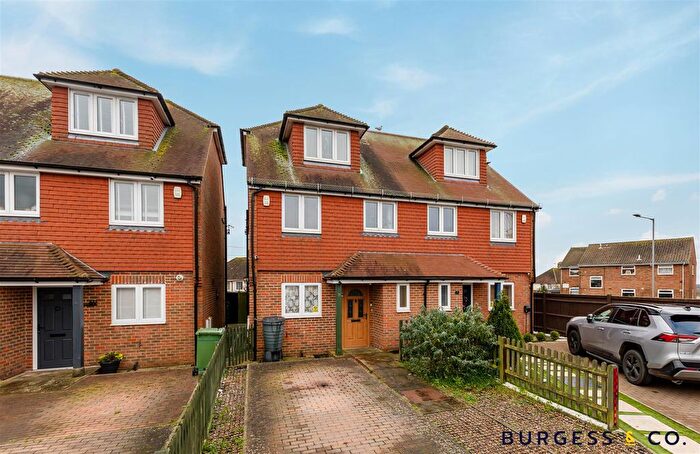
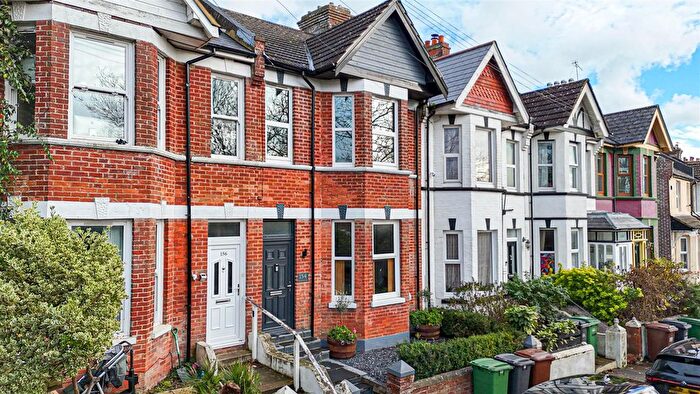
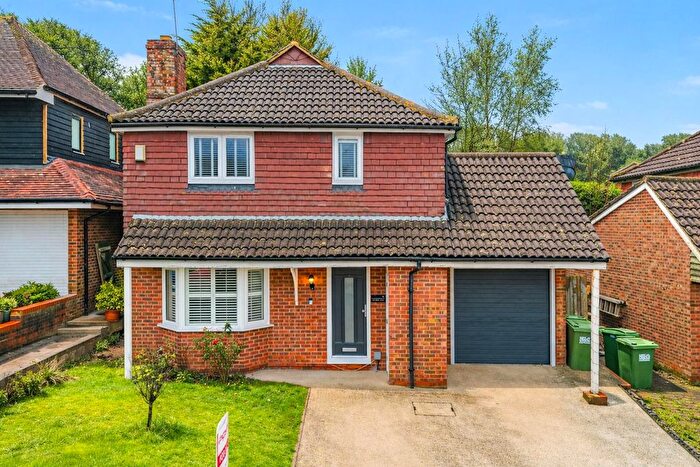
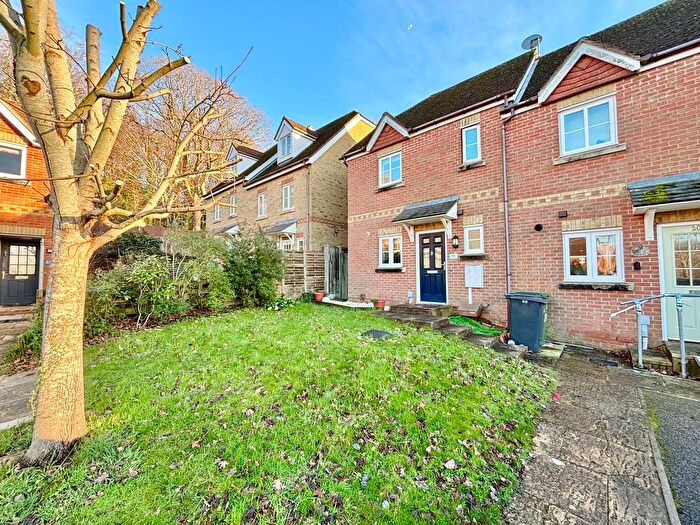
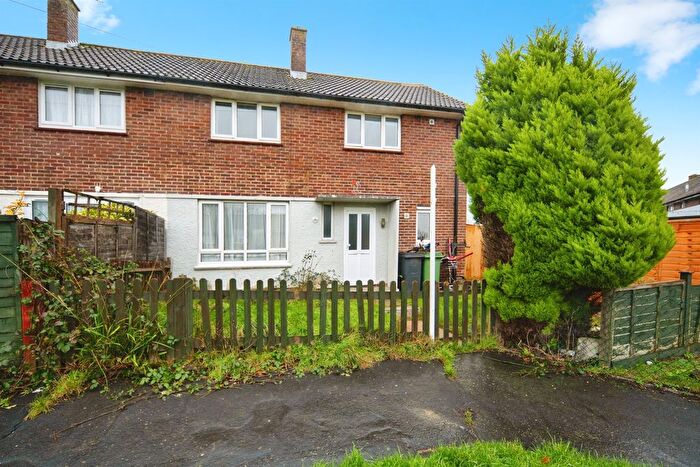
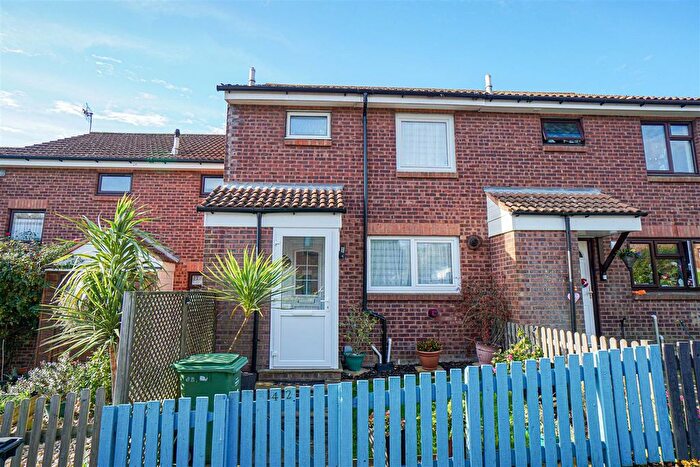
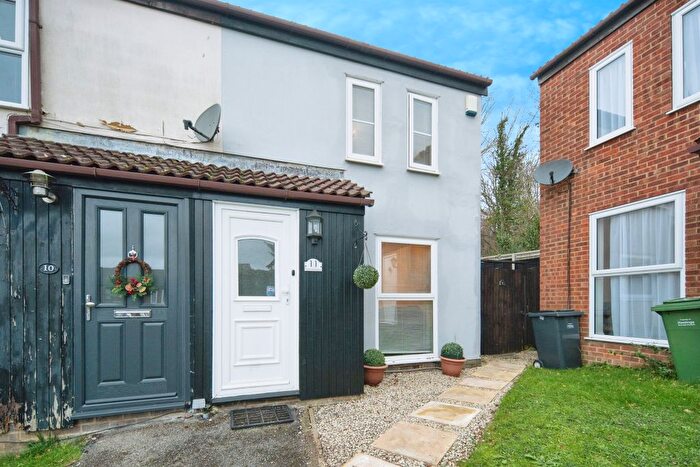
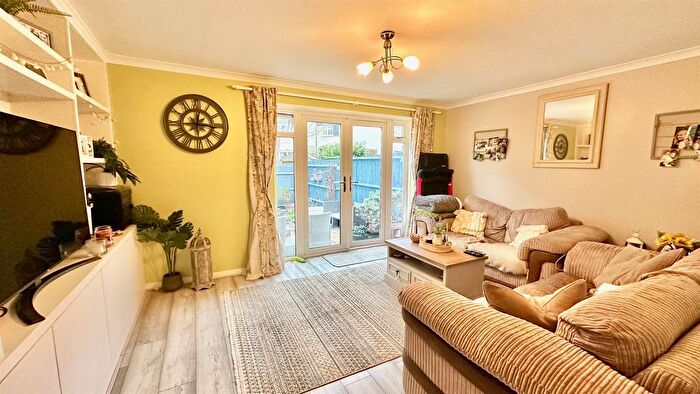
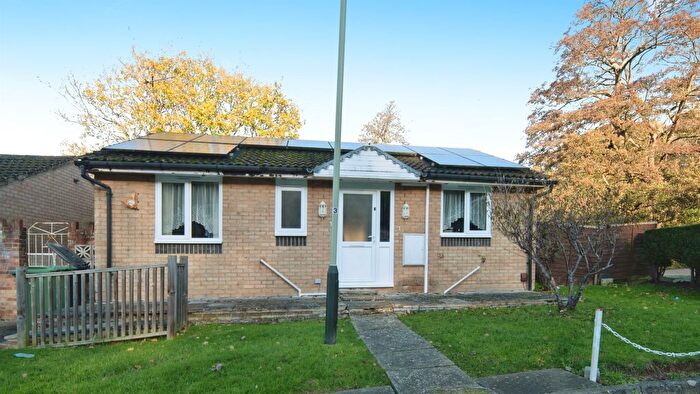
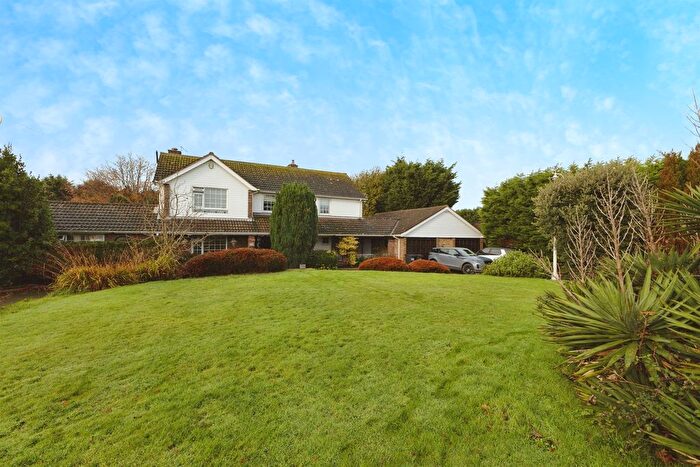
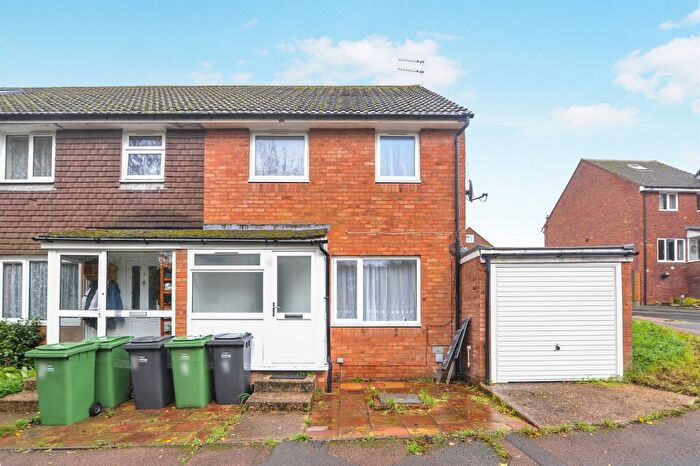
Properties for sale in Hollington
Roads and Postcodes in Hollington
Navigate through our locations to find the location of your next house in Hollington, St Leonards-on-sea for sale or to rent.
| Streets | Postcodes |
|---|---|
| Adam Close | TN38 9QW |
| Armstrong Close | TN38 9ST |
| Ashdown Close | TN38 9SP |
| Battle Road | TN37 7AN TN37 7BB TN37 7BD TN37 7BE TN37 7BQ TN37 7AP TN37 7QZ |
| Beauchamp Road | TN38 9HN TN38 9HW TN38 9JU |
| Beckley Close | TN38 9TA |
| Bedgebury Close | TN38 9SN |
| Beecham Place | TN38 9BP |
| Bodiam Drive | TN38 9TW |
| Brunel Road | TN38 9RT |
| Buckingham Road | TN38 9QE |
| Carpenter Drive | TN38 9RX TN38 9SB |
| Castleham Road | TN38 9NJ TN38 9NR TN38 9NS TN38 9NT TN38 9NU |
| Catsfield Close | TN38 9TB TN38 9AJ |
| Chatfield Close | TN38 9SF |
| Church In The Wood Lane | TN38 9PB |
| Church Wood Drive | TN38 9AN TN38 9QQ TN38 9RB |
| Churchfields Industrial Estate | TN38 9PU |
| Collett Close | TN38 9QS |
| Coneyburrow Gardens | TN38 9RZ TN38 9RY |
| Cooper Rise | TN37 7TX |
| Copse Close | TN38 9UE |
| Cubitt Way | TN38 9SU |
| Curlew Court | TN38 9RQ |
| Denham Close | TN38 9RS |
| Dittons Mews | TN38 9TQ |
| Edward Terrace | TN38 9LP |
| Essex Road | TN38 9QH |
| Etchingham Drive | TN38 9AB |
| Flimwell Close | TN38 9FB |
| Frewyn Close | TN38 9RG |
| Gresley Road | TN38 9PL |
| Hartfield Meadow | TN38 9UD |
| Harvey Close | TN38 9SG |
| Hertford Close | TN38 9QG |
| Highfield Business Park | TN38 9TG TN38 9UB |
| Highfield Drive | TN38 9UH |
| Hollington Old Lane | TN38 9DS TN38 9DR |
| Howlett Close | TN38 9QR |
| Icklesham Drive | TN38 9TZ |
| Inglewood Gardens | TN38 9SA |
| Jameson Crescent | TN38 9JA |
| Kensington Close | TN38 9TL |
| Kent Road | TN38 9QJ |
| Lancaster Road | TN38 9LU TN38 9AT |
| Laurel Walk | TN38 9RH |
| Lincoln Close | TN38 9QL |
| Lydd Close | TN38 9AD |
| Marline Avenue | TN38 9HP TN38 9HS |
| Marline Road | TN38 9HL TN38 9HR |
| Maunsell Road | TN38 9NL TN38 9NN |
| Meadow Close | TN38 9QD |
| Michelson Close | TN38 9SE TN38 9SD |
| Moorhurst Road | TN38 9NA TN38 9NB |
| Napier Road | TN38 9NY |
| Norfolk Drive | TN38 9QP |
| Northampton Way | TN38 9QN |
| Northiam Rise | TN38 9FA |
| Old Church Road | TN38 9HA TN38 9LR TN38 9HB TN38 9HD TN38 9LT |
| Ormerod Avenue | TN38 9LN |
| Parsons Close | TN38 9QT |
| Paxhill Close | TN38 9RE |
| Pinewood Way | TN38 9RR |
| Plover Court | TN38 9RJ |
| Quebec Road | TN38 9HH TN38 9HJ TN38 9HU TN38 9HT |
| Queensway Avenue North | TN38 9AL |
| Radnor Mews | TN38 9SX |
| Raven Court | TN38 9RL |
| Robsack Avenue | TN38 9SH TN38 9SJ TN38 9SL TN38 9SQ |
| Rossetti Gardens | TN38 9AP |
| Salcey Close | TN38 9SS |
| Salehurst Gardens | TN38 9FD |
| Sandringham Heights | TN38 9UA |
| Sidney Little Road | TN38 9AU |
| Silvan Road | TN38 9RD |
| Stanier Road | TN38 9RP |
| Stirling Road | TN38 9NP TN38 9NW |
| Swynford Drive | TN38 9NE TN38 9NQ |
| Taylor Close | TN38 9RU |
| Teal Court | TN38 9RW |
| Telford Road | TN38 9LY |
| The Finches | TN38 9LQ |
| The Kestrels | TN38 9LW |
| The Slides | TN38 9LE |
| Tile Barn Road | TN38 9AS |
| Tilebarn Road | TN38 9QU TN38 9PA |
| Wainwright Close | TN38 9PP |
| Warwick Place | TN38 9PX |
| Watermill Drive | TN38 8WD |
| Whatlington Way | TN38 9TE |
| Whittlewood Close | TN38 9SR |
| Willingdon Avenue | TN38 9HE TN38 9HF |
| Willingdon Close | TN38 9HG |
| Willingdon Way | TN38 9HQ |
| Wishing Tree Road | TN38 9LG TN38 9LJ TN38 9LH |
| Wishing Tree Road North | TN38 9LL TN38 9QA TN38 9QB |
| Wittersham Rise | TN38 9PT TN38 9PW |
| Wren Court | TN38 9RN |
Transport near Hollington
-
West St Leonards Station
-
St.Leonards Warrior Square Station
-
Crowhurst Station
-
Hastings Station
-
Ore Station
- FAQ
- Price Paid By Year
- Property Type Price
Frequently asked questions about Hollington
What is the average price for a property for sale in Hollington?
The average price for a property for sale in Hollington is £272,321. This amount is 7% lower than the average price in St Leonards-on-sea. There are 882 property listings for sale in Hollington.
What streets have the most expensive properties for sale in Hollington?
The streets with the most expensive properties for sale in Hollington are Telford Road at an average of £600,000, Ashdown Close at an average of £585,000 and Robsack Avenue at an average of £490,250.
What streets have the most affordable properties for sale in Hollington?
The streets with the most affordable properties for sale in Hollington are Northampton Way at an average of £100,000, Denham Close at an average of £196,666 and Chatfield Close at an average of £205,000.
Which train stations are available in or near Hollington?
Some of the train stations available in or near Hollington are West St Leonards, St.Leonards Warrior Square and Crowhurst.
Property Price Paid in Hollington by Year
The average sold property price by year was:
| Year | Average Sold Price | Price Change |
Sold Properties
|
|---|---|---|---|
| 2025 | £285,311 | 3% |
45 Properties |
| 2024 | £275,474 | 6% |
58 Properties |
| 2023 | £258,780 | -5% |
60 Properties |
| 2022 | £272,929 | 6% |
74 Properties |
| 2021 | £256,827 | 11% |
85 Properties |
| 2020 | £227,940 | 1% |
79 Properties |
| 2019 | £225,308 | -0,4% |
68 Properties |
| 2018 | £226,098 | -2% |
86 Properties |
| 2017 | £230,267 | 17% |
95 Properties |
| 2016 | £191,921 | 8% |
89 Properties |
| 2015 | £176,834 | 6% |
79 Properties |
| 2014 | £166,404 | -3% |
93 Properties |
| 2013 | £171,042 | 9% |
77 Properties |
| 2012 | £155,420 | 4% |
55 Properties |
| 2011 | £148,988 | -4% |
70 Properties |
| 2010 | £155,586 | 13% |
51 Properties |
| 2009 | £135,186 | -11% |
53 Properties |
| 2008 | £149,639 | -0,1% |
73 Properties |
| 2007 | £149,723 | 1% |
124 Properties |
| 2006 | £148,496 | 3% |
134 Properties |
| 2005 | £143,440 | 8% |
107 Properties |
| 2004 | £132,039 | 15% |
93 Properties |
| 2003 | £112,497 | 13% |
97 Properties |
| 2002 | £97,521 | 19% |
131 Properties |
| 2001 | £79,446 | 10% |
152 Properties |
| 2000 | £71,582 | 19% |
94 Properties |
| 1999 | £57,635 | -0,1% |
102 Properties |
| 1998 | £57,680 | -12% |
101 Properties |
| 1997 | £64,314 | 30% |
126 Properties |
| 1996 | £44,981 | 8% |
89 Properties |
| 1995 | £41,477 | - |
38 Properties |
Property Price per Property Type in Hollington
Here you can find historic sold price data in order to help with your property search.
The average Property Paid Price for specific property types in the last three years are:
| Property Type | Average Sold Price | Sold Properties |
|---|---|---|
| Semi Detached House | £272,863.00 | 73 Semi Detached Houses |
| Detached House | £394,494.00 | 35 Detached Houses |
| Terraced House | £245,574.00 | 118 Terraced Houses |
| Flat | £166,909.00 | 11 Flats |

