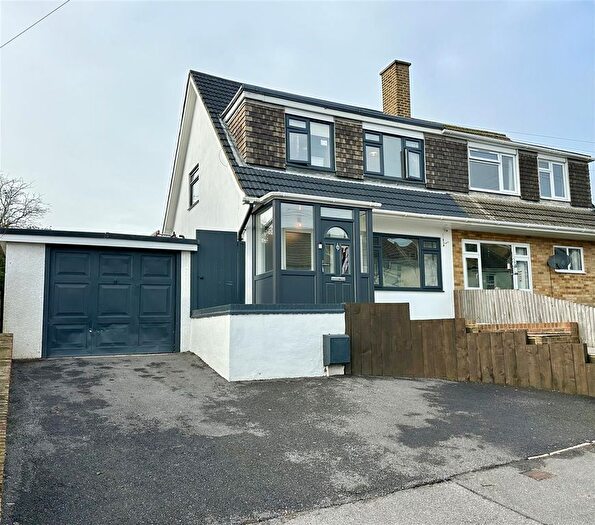
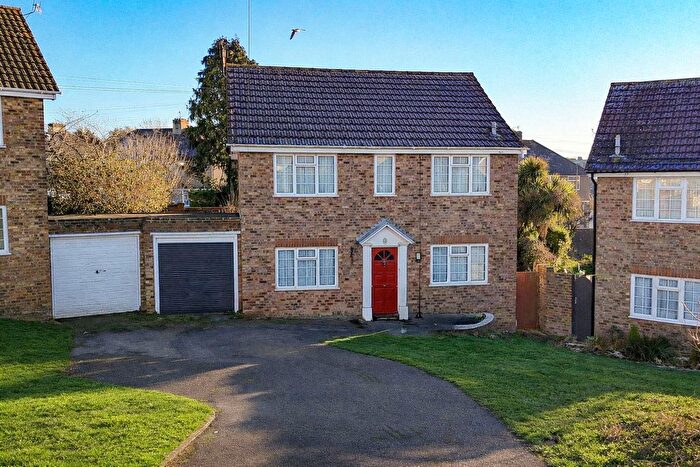
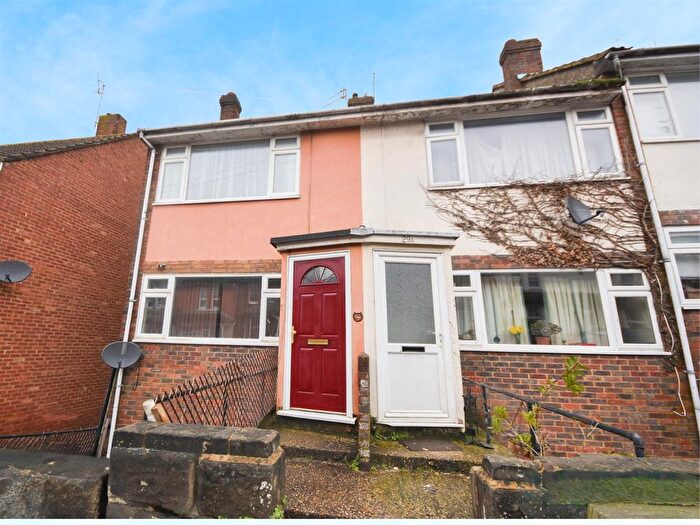
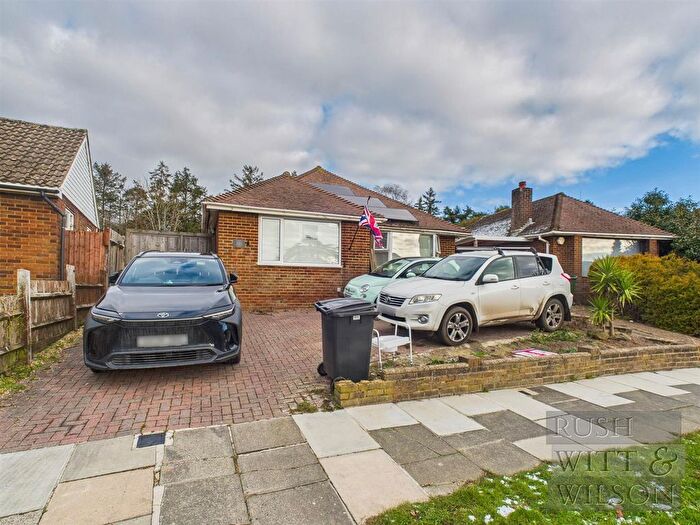
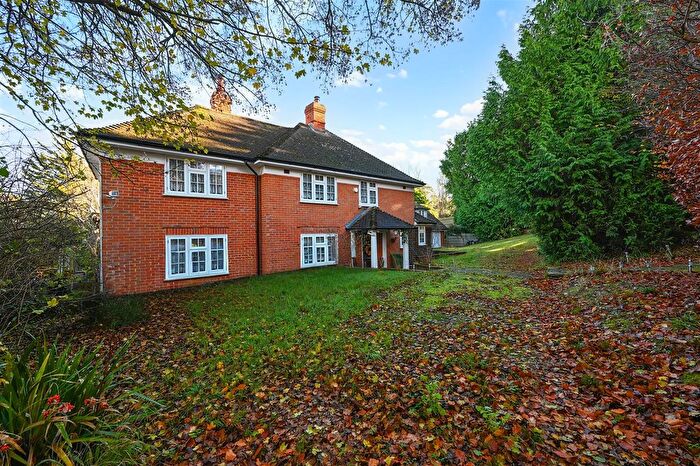
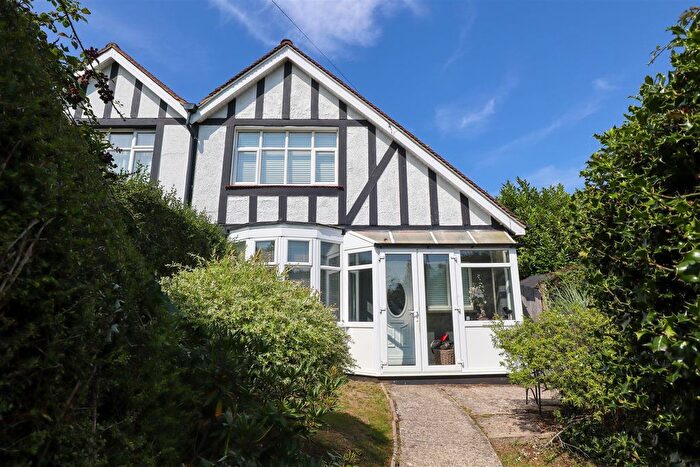
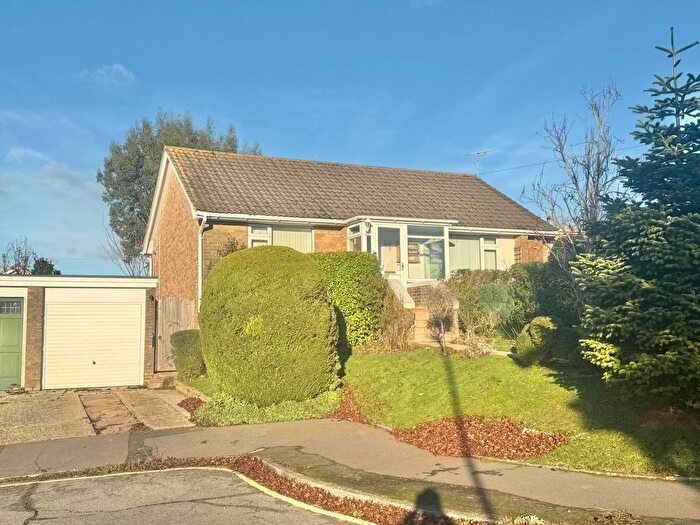
Houses for sale & to rent in Conquest, St Leonards-on-sea
House Prices in Conquest
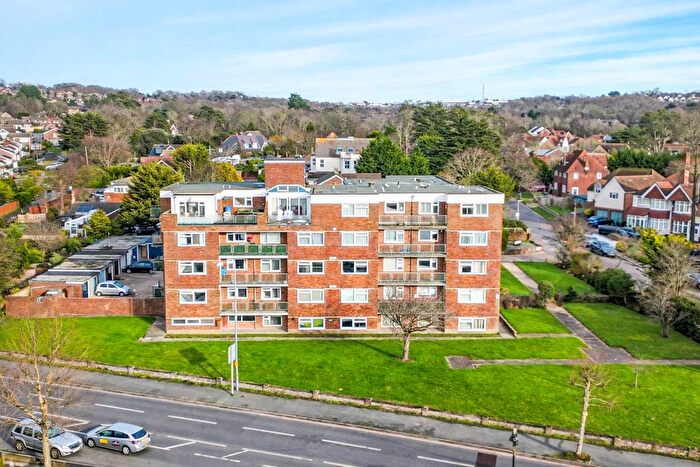
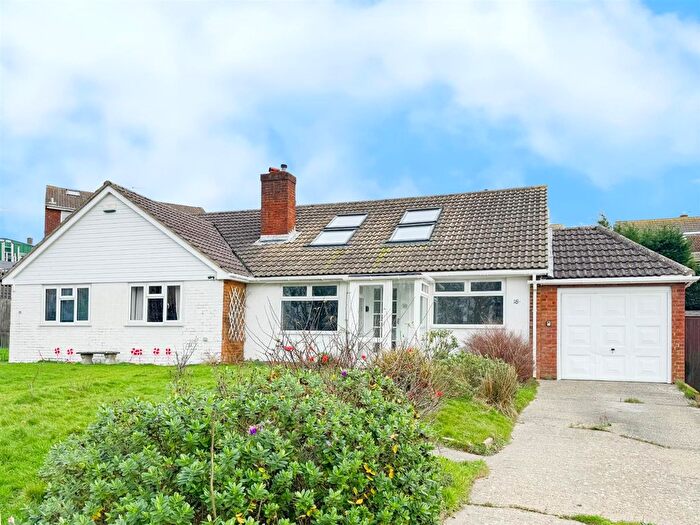
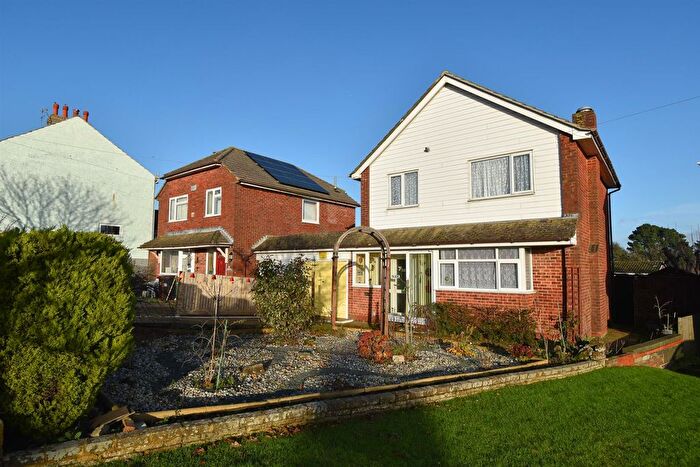
Properties in Conquest have an average house price of £330,969.00 and had 174 Property Transactions within the last 3 years¹.
Conquest is an area in St Leonards-on-sea, East Sussex with 1,165 households², where the most expensive property was sold for £875,000.00.
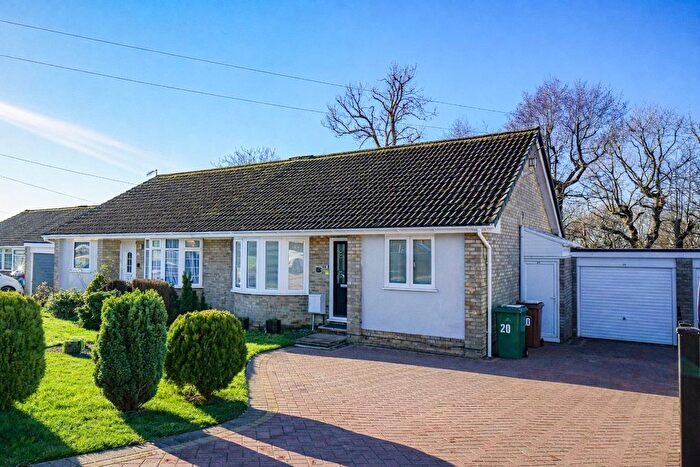
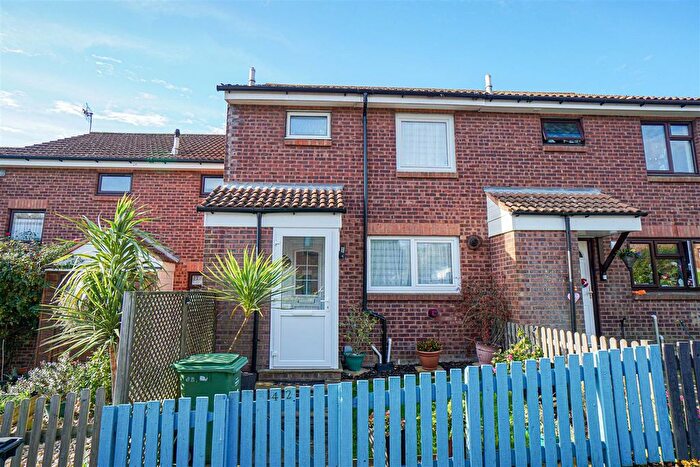
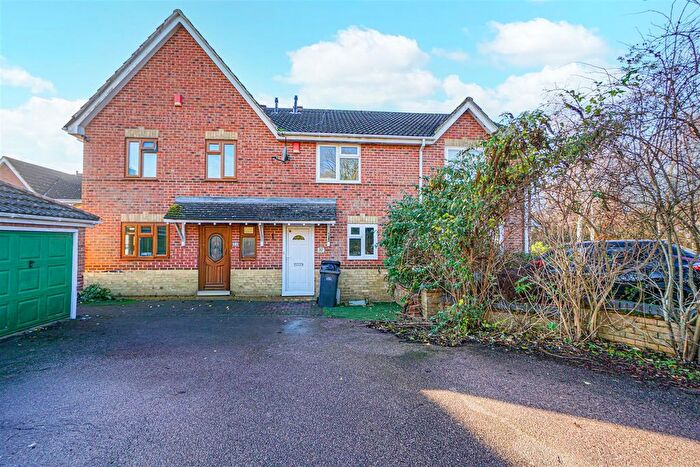
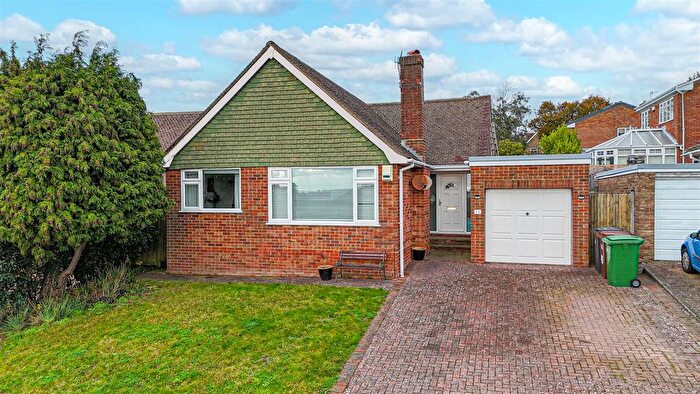
Properties for sale in Conquest
Previously listed properties in Conquest
Roads and Postcodes in Conquest
Navigate through our locations to find the location of your next house in Conquest, St Leonards-on-sea for sale or to rent.
| Streets | Postcodes |
|---|---|
| Acorn Close | TN37 7RH |
| Alder Close | TN37 7LU |
| Anvil Court | TN37 7EZ |
| Barn Court | TN37 7UJ |
| Barrow Rise | TN37 7ST |
| Beaulieu Gardens | TN37 7QE |
| Beechwood Gardens | TN37 7HP |
| Blackthorn Close | TN37 7XR |
| Cedar Close | TN37 7HR |
| Chalvington Drive | TN37 7SA TN37 7SB |
| Cockcrow Wood | TN37 7HW |
| Copper Beeches | TN37 7RR |
| Fairfield Road | TN37 7UA |
| Farmlands Close | TN37 7UE |
| Folkington Gardens | TN37 7SG |
| Forge Way | TN37 7SZ |
| Foxcote | TN37 7HJ |
| Francis Bird Place | TN37 7GJ |
| Glyndebourne Gardens | TN37 7SD TN37 7SJ |
| Greenfields Close | TN37 7LP |
| Hare Way | TN37 7UG TN37 7UH |
| Harvest Way | TN37 7SL |
| Hazelwood Gardens | TN37 7HL |
| Highlea Close | TN37 7SS |
| Highview Close | TN37 7HY |
| Honeysuckle Close | TN37 7LX |
| Kings Wood Gate | TN37 7FB |
| Kingsdale Close | TN37 7UD |
| Leybourne Gardens | TN37 7HU |
| Little Ridge Avenue | TN37 7HN TN37 7LR TN37 7LS TN37 7SP |
| Long Acre Close | TN37 7UB |
| Lullington Gardens | TN37 7SH |
| Lynwood Close | TN37 7HT |
| Martingale Close | TN37 7SW |
| Mulberry Walk | TN37 7LY |
| Oaklea Close | TN37 7HB |
| Oast House Close | TN37 7UX TN37 7UY |
| Old Roar Road | TN37 7HA TN37 7HD TN37 7HH |
| Penhurst Close | TN37 7HF |
| Pentland Close | TN37 7SR |
| Rowan Close | TN37 7HS |
| Senlac Way | TN37 7JG |
| Silverhill Avenue | TN37 7HG TN37 7HQ |
| Smithys Close | TN37 7SU |
| Stable Mews | TN37 7SY |
| Tall Ash Drive | TN37 7RJ TN37 7RL TN37 7RN TN37 7RW |
| The Meadows | TN37 7SN |
| The Oaks | TN37 7UW |
| The Poplars | TN37 7PU |
| The Ridge | TN37 7RE TN37 7PT TN37 7RD |
| The Ridings | TN37 7SX |
| The Roundel | TN37 7HE |
| Westdean Close | TN37 7SE |
| Wheatfield Court | TN37 7EY |
| Woodspring Close | TN37 7LT |
Transport near Conquest
-
Ore Station
-
Hastings Station
-
St.Leonards Warrior Square Station
-
West St Leonards Station
-
Three Oaks Station
-
Crowhurst Station
- FAQ
- Price Paid By Year
- Property Type Price
Frequently asked questions about Conquest
What is the average price for a property for sale in Conquest?
The average price for a property for sale in Conquest is £330,969. This amount is 13% higher than the average price in St Leonards-on-sea. There are 1,144 property listings for sale in Conquest.
What streets have the most expensive properties for sale in Conquest?
The streets with the most expensive properties for sale in Conquest are The Ridge at an average of £875,000, Leybourne Gardens at an average of £615,000 and Beaulieu Gardens at an average of £495,000.
What streets have the most affordable properties for sale in Conquest?
The streets with the most affordable properties for sale in Conquest are Senlac Way at an average of £170,100, Kings Wood Gate at an average of £188,500 and Farmlands Close at an average of £222,000.
Which train stations are available in or near Conquest?
Some of the train stations available in or near Conquest are Ore, Hastings and St.Leonards Warrior Square.
Property Price Paid in Conquest by Year
The average sold property price by year was:
| Year | Average Sold Price | Price Change |
Sold Properties
|
|---|---|---|---|
| 2025 | £312,928 | -7% |
38 Properties |
| 2024 | £334,593 | -1% |
48 Properties |
| 2023 | £339,271 | 1% |
35 Properties |
| 2022 | £335,139 | 6% |
53 Properties |
| 2021 | £314,239 | 1% |
51 Properties |
| 2020 | £310,778 | 19% |
40 Properties |
| 2019 | £251,383 | -11% |
48 Properties |
| 2018 | £280,242 | 14% |
62 Properties |
| 2017 | £241,655 | -2% |
60 Properties |
| 2016 | £246,278 | 14% |
58 Properties |
| 2015 | £211,031 | 8% |
56 Properties |
| 2014 | £193,478 | 1% |
69 Properties |
| 2013 | £191,427 | 6% |
49 Properties |
| 2012 | £179,914 | 6% |
47 Properties |
| 2011 | £169,528 | -9% |
53 Properties |
| 2010 | £184,961 | 11% |
53 Properties |
| 2009 | £165,332 | -6% |
49 Properties |
| 2008 | £175,216 | -5% |
37 Properties |
| 2007 | £184,229 | 5% |
92 Properties |
| 2006 | £174,278 | 4% |
97 Properties |
| 2005 | £167,027 | 2% |
104 Properties |
| 2004 | £164,214 | 4% |
104 Properties |
| 2003 | £158,466 | 16% |
109 Properties |
| 2002 | £133,696 | 25% |
126 Properties |
| 2001 | £99,812 | 15% |
93 Properties |
| 2000 | £85,000 | 13% |
114 Properties |
| 1999 | £74,209 | 6% |
109 Properties |
| 1998 | £69,913 | 13% |
93 Properties |
| 1997 | £60,970 | 4% |
121 Properties |
| 1996 | £58,404 | 2% |
122 Properties |
| 1995 | £57,386 | - |
86 Properties |
Property Price per Property Type in Conquest
Here you can find historic sold price data in order to help with your property search.
The average Property Paid Price for specific property types in the last three years are:
| Property Type | Average Sold Price | Sold Properties |
|---|---|---|
| Semi Detached House | £294,884.00 | 39 Semi Detached Houses |
| Detached House | £403,696.00 | 81 Detached Houses |
| Terraced House | £286,036.00 | 36 Terraced Houses |
| Flat | £171,747.00 | 18 Flats |

