
Houses for sale & to rent in TN37 7PU, The Poplars, Conquest, St Leonards-on-sea
House Prices in TN37 7PU, The Poplars, Conquest
Properties in TN37 7PU have no sales history available within the last 3 years. TN37 7PU is a postcode in The Poplars located in Conquest, an area in St Leonards-on-sea, East Sussex, with 3 households².
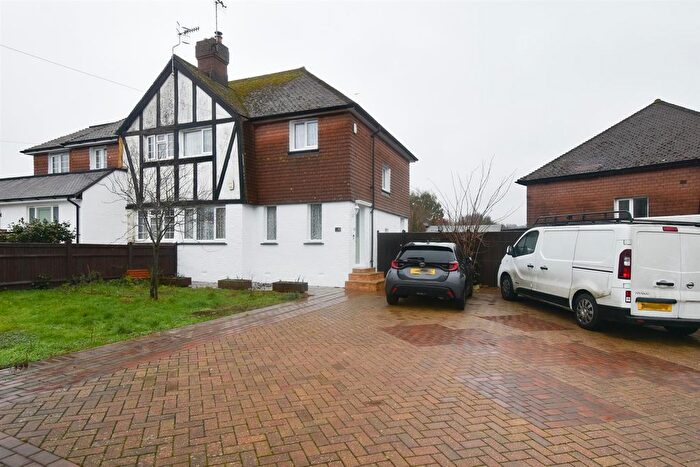
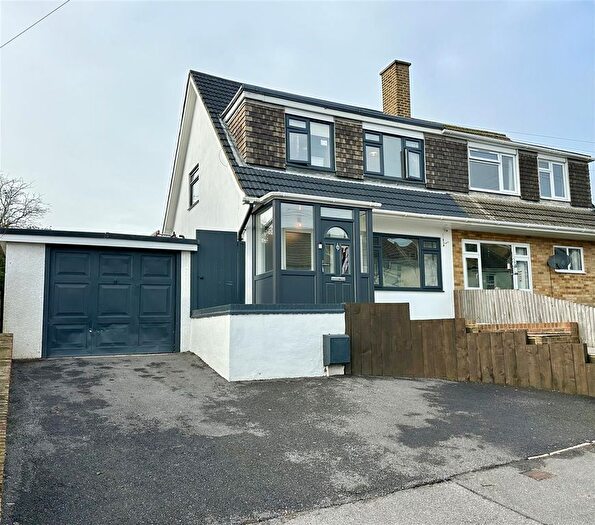
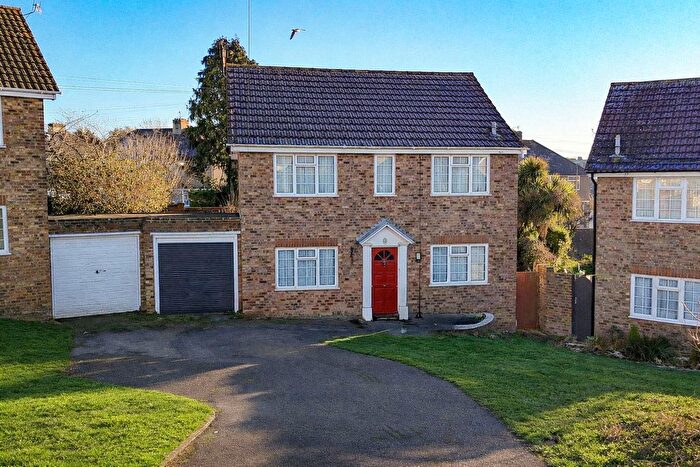
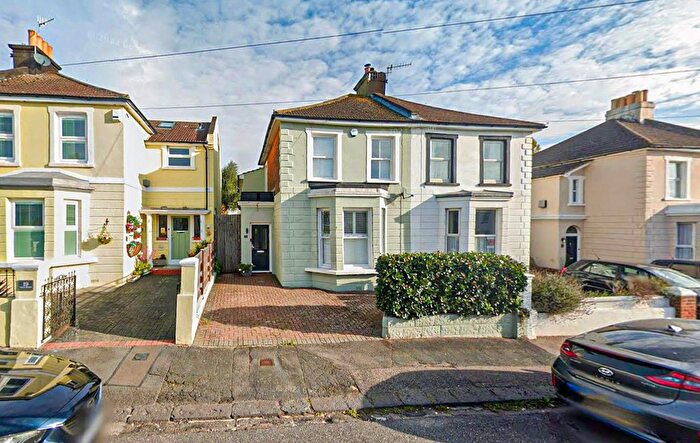
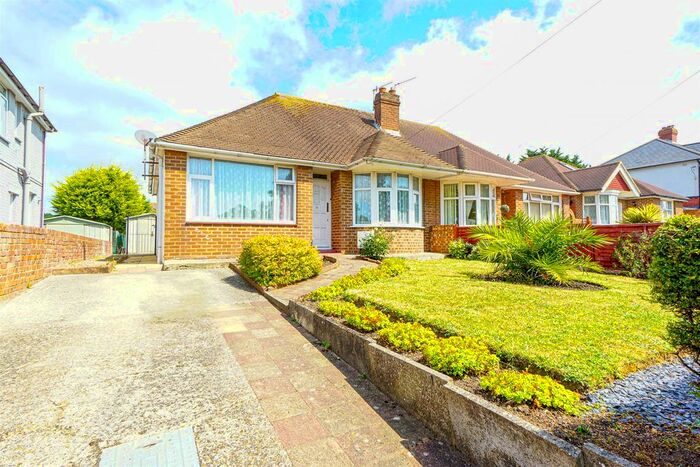
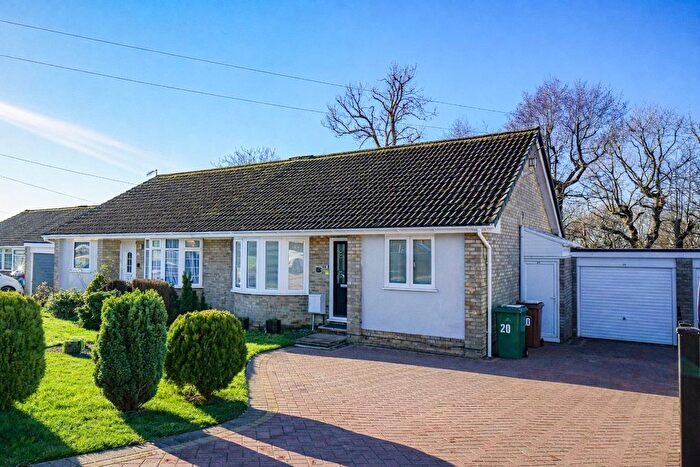
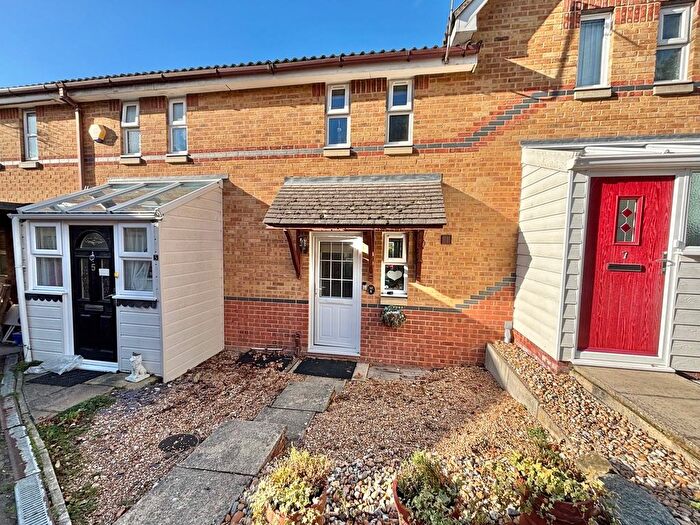
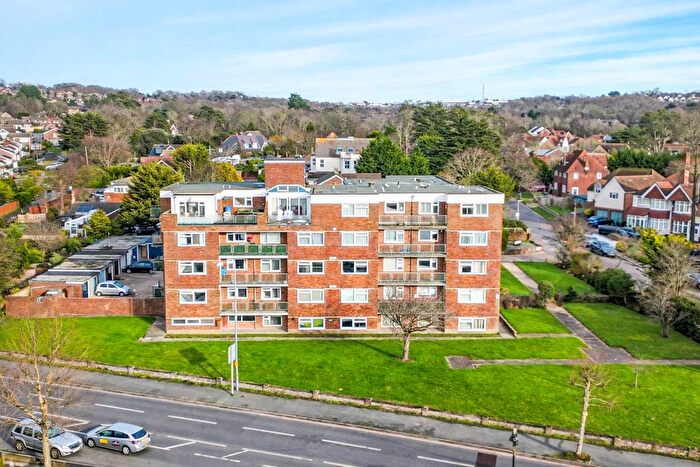
Properties for sale near TN37 7PU, The Poplars
![]()
If you are looking to sell your house, let it out, or receive a property valuation, an expert can help you.
Click the button below to get started.
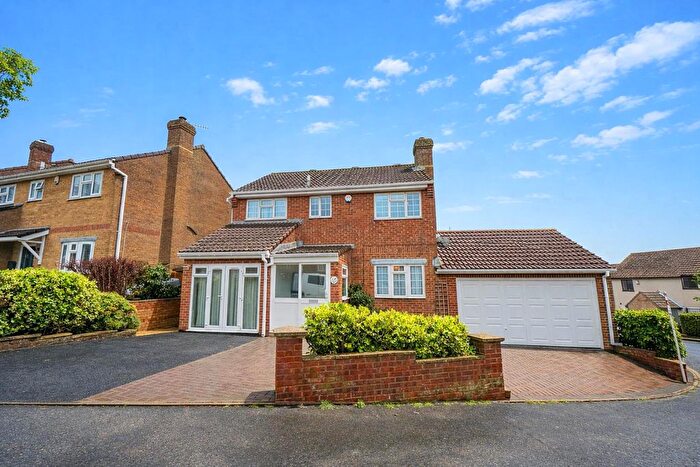
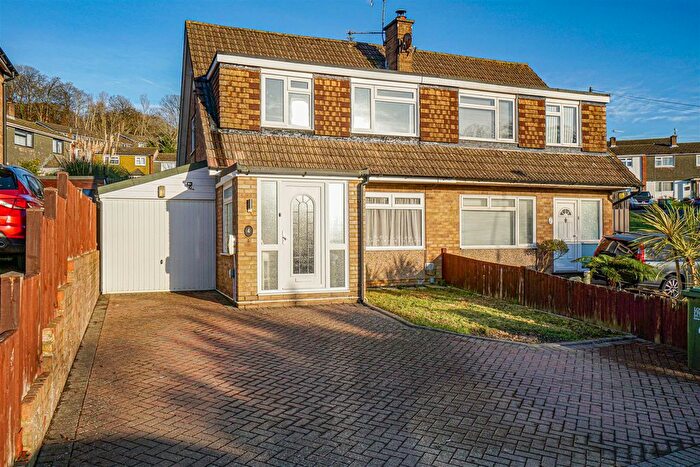
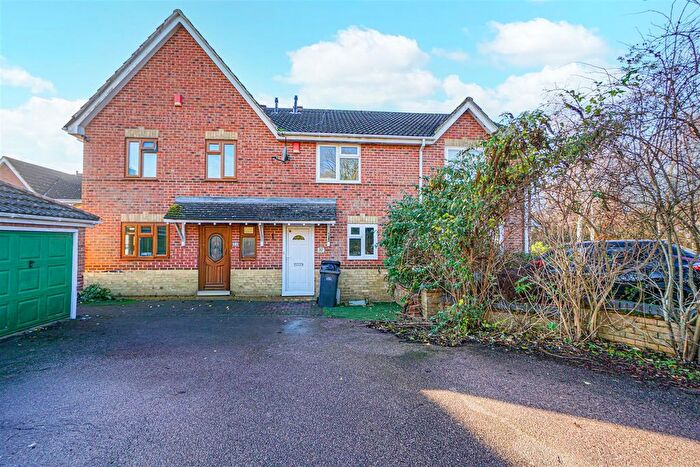
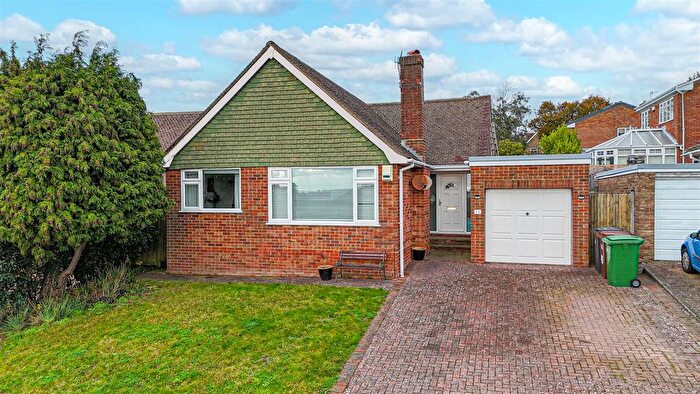
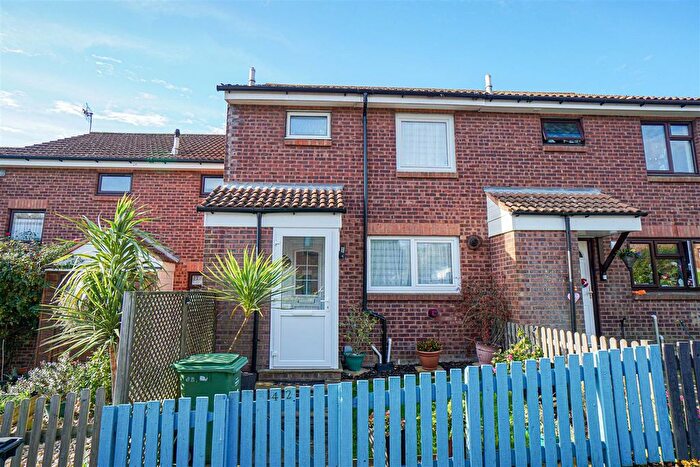

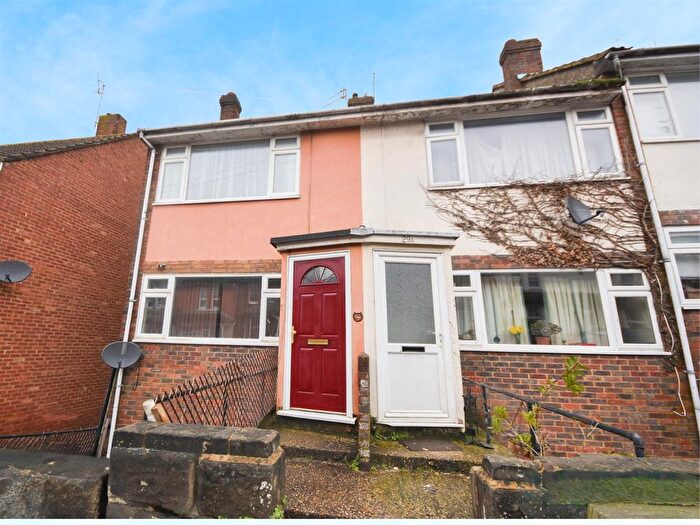
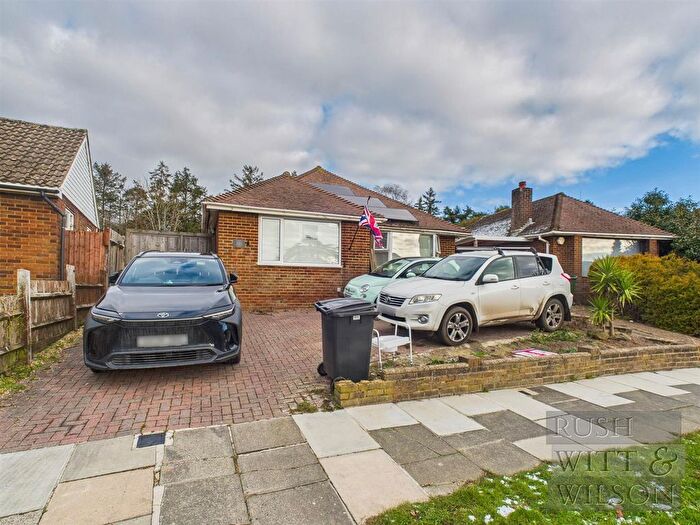
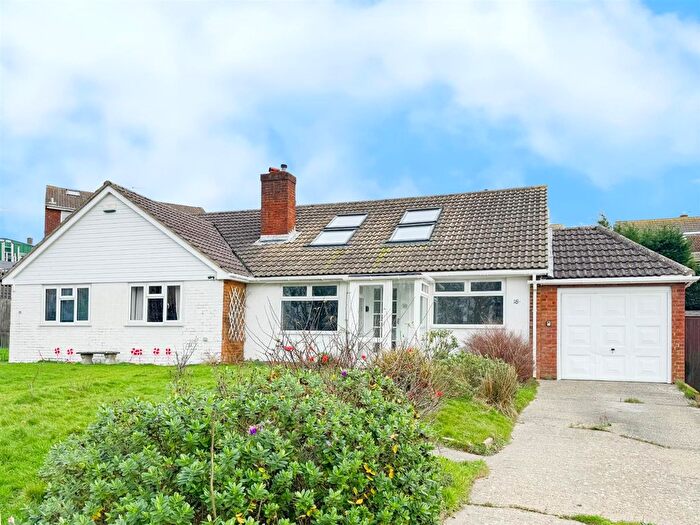
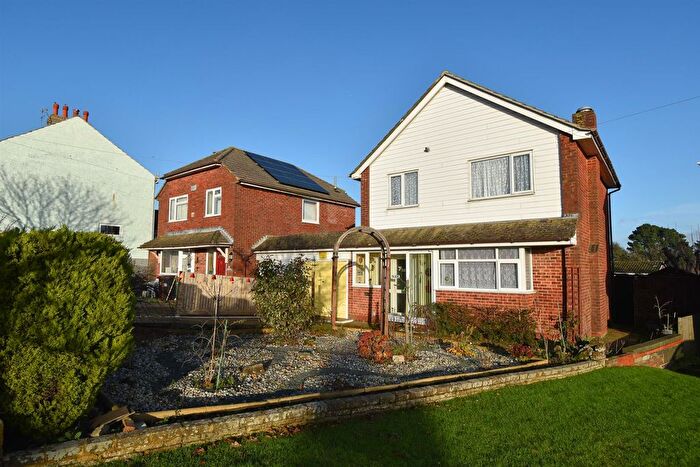
Previously listed properties near TN37 7PU, The Poplars
![]()
If you are looking to sell your house, let it out, or receive a property valuation, an expert can help you.
Click the button below to get started.
Price Paid in The Poplars, TN37 7PU, Conquest
3 The Poplars, TN37 7PU, Conquest St Leonards-on-sea
Property 3 has been sold 3 times. The last time it was sold was in 23/09/2021 and the sold price was £475,000.00.
This detached house, sold as a freehold on 23/09/2021, is a 123 sqm detached house with an EPC rating of D.
| Date | Price | Property Type | Tenure | Classification |
|---|---|---|---|---|
| 23/09/2021 | £475,000.00 | Detached House | freehold | Established Building |
| 14/05/2004 | £250,000.00 | Detached House | freehold | Established Building |
| 07/04/1998 | £133,000.00 | Detached House | freehold | Established Building |
2 The Poplars, TN37 7PU, Conquest St Leonards-on-sea
Property 2 has been sold 3 times. The last time it was sold was in 11/03/2016 and the sold price was £267,500.00.
This detached house, sold as a freehold on 11/03/2016, is a 102 sqm detached house with an EPC rating of D.
| Date | Price | Property Type | Tenure | Classification |
|---|---|---|---|---|
| 11/03/2016 | £267,500.00 | Detached House | freehold | Established Building |
| 07/07/2014 | £249,999.00 | Detached House | freehold | Established Building |
| 27/04/2012 | £220,000.00 | Detached House | freehold | Established Building |
Transport near TN37 7PU, The Poplars
-
 St.Leonards Warrior Square Station
 -
Ore Station
-
Hastings Station
-
West St Leonards Station
-
Crowhurst Station
-
Three Oaks Station
House price paid reports for TN37 7PU, The Poplars
Click on the buttons below to see price paid reports by year or property price:
- Price Paid By Year
Property Price Paid in TN37 7PU, The Poplars by Year
The average sold property price by year was:
| Year | Average Sold Price | Price Change |
Sold Properties
|
|---|---|---|---|
| 2021 | £475,000 | 44% |
1 Property |
| 2016 | £267,500 | 7% |
1 Property |
| 2014 | £249,999 | 12% |
1 Property |
| 2012 | £220,000 | -14% |
1 Property |
| 2004 | £250,000 | 47% |
1 Property |
| 1998 | £133,000 | - |
1 Property |