
Houses for sale & to rent in Gensing, St Leonards-on-sea
House Prices in Gensing
Properties in Gensing have an average house price of £261,442.00 and had 551 Property Transactions within the last 3 years¹.
Gensing is an area in St Leonards-on-sea, East Sussex with 3,177 households², where the most expensive property was sold for £1,295,000.00.
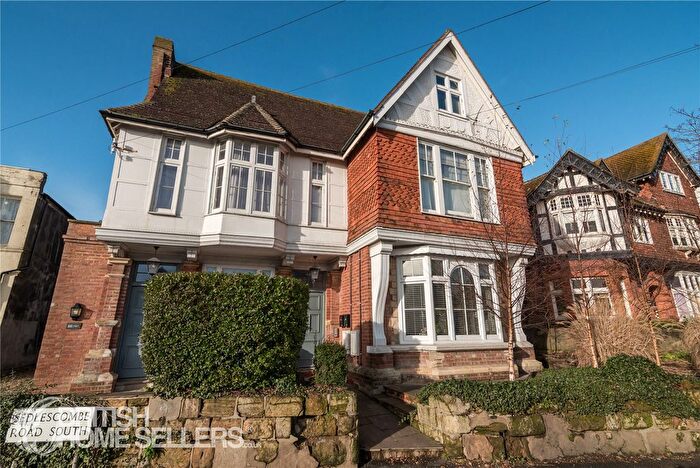
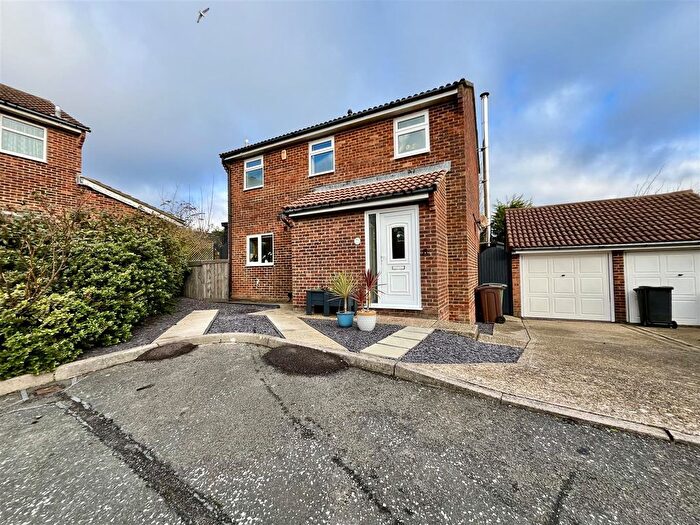
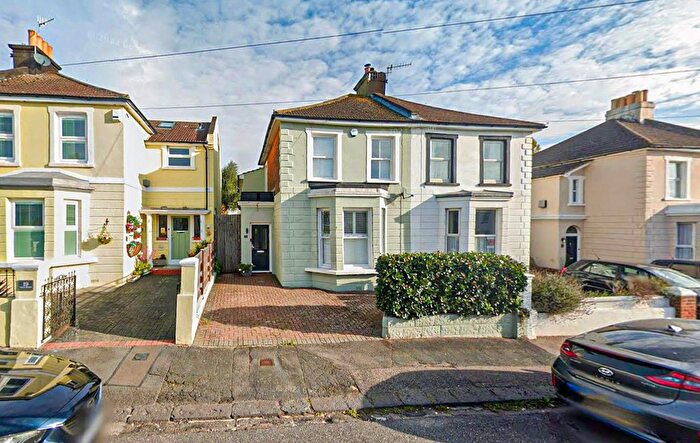
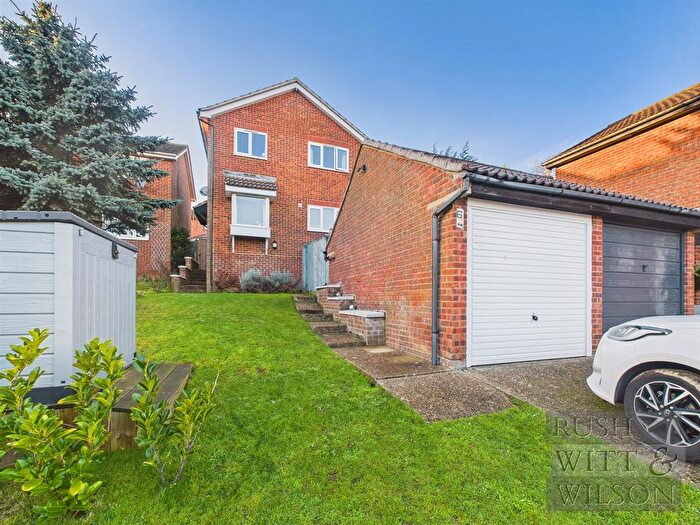
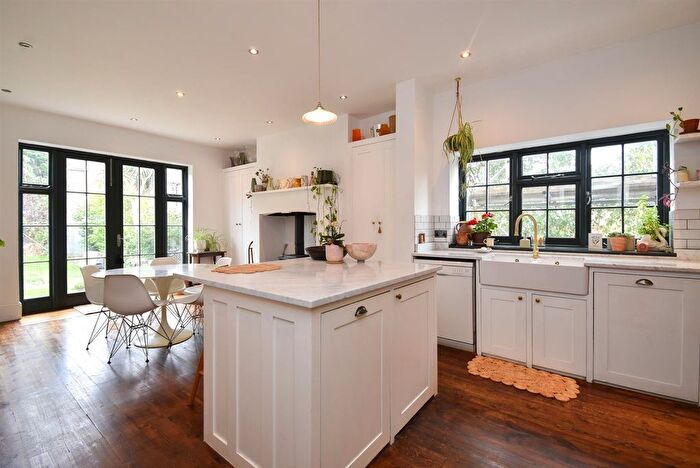
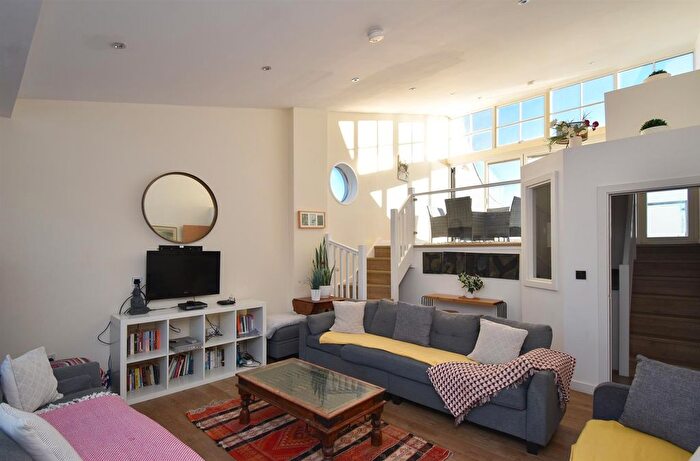
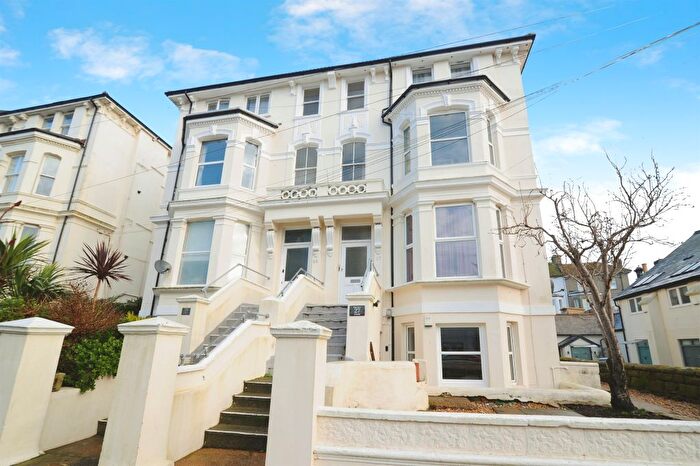
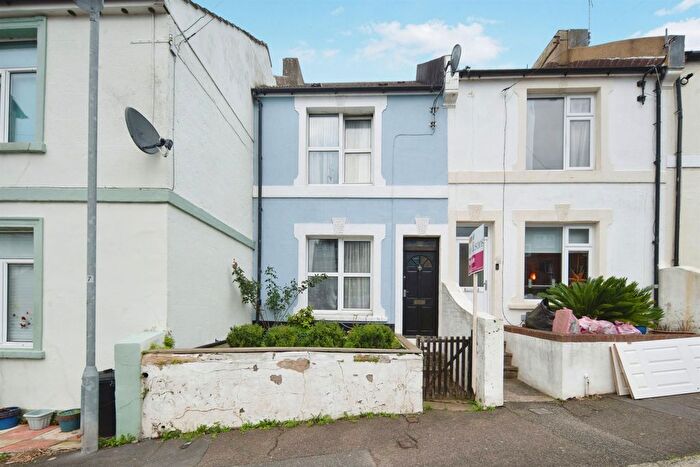
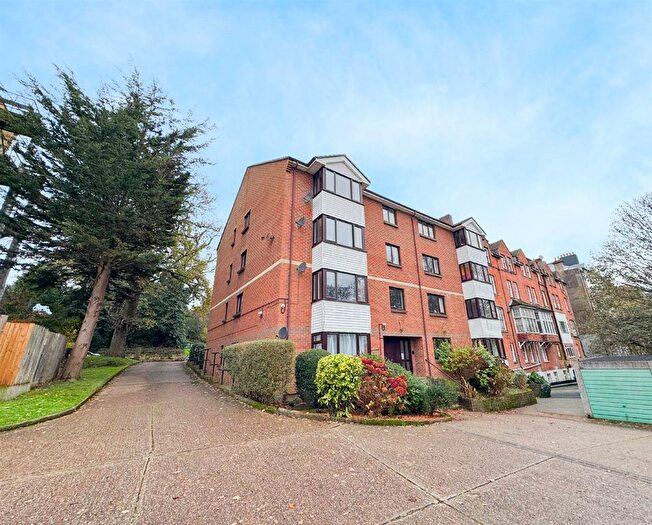
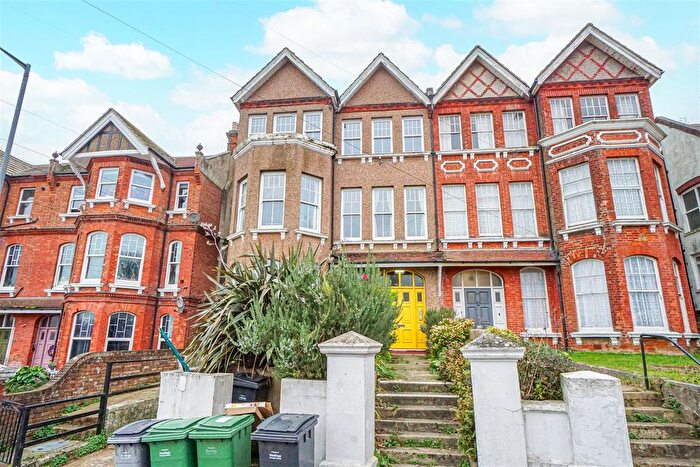
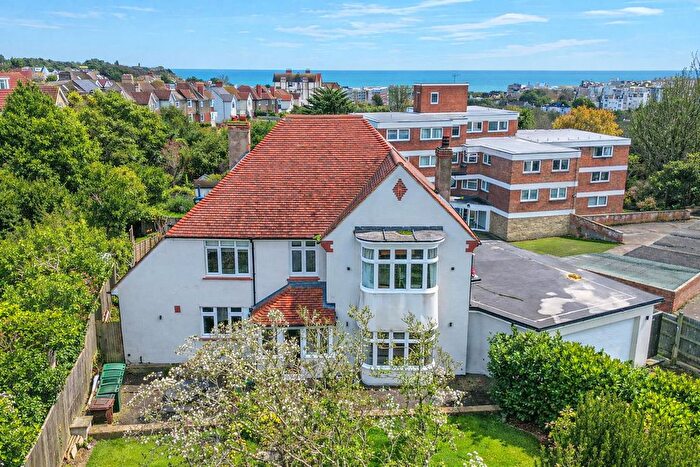
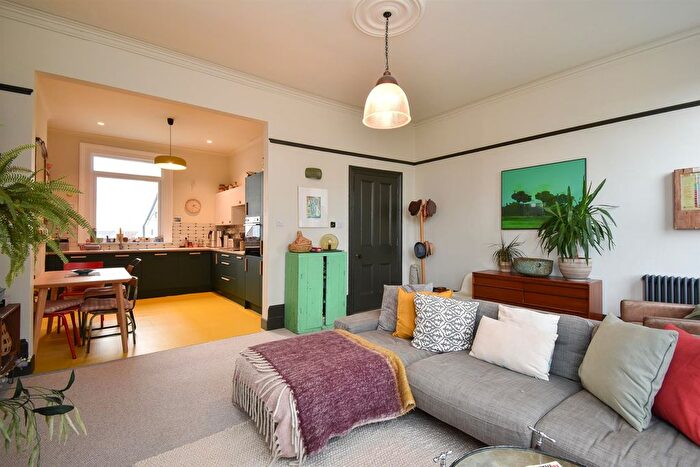
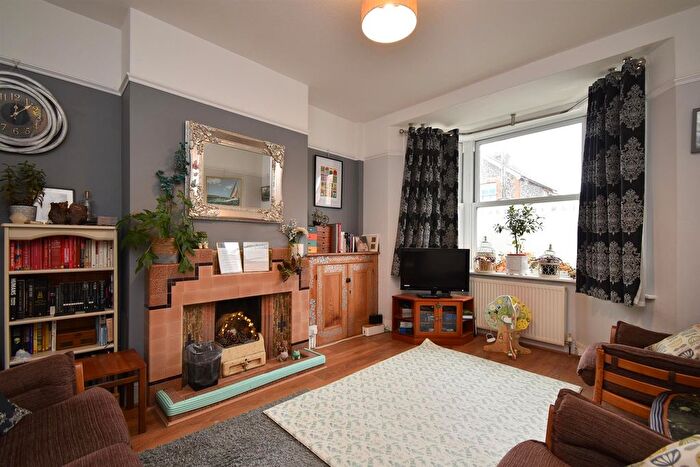
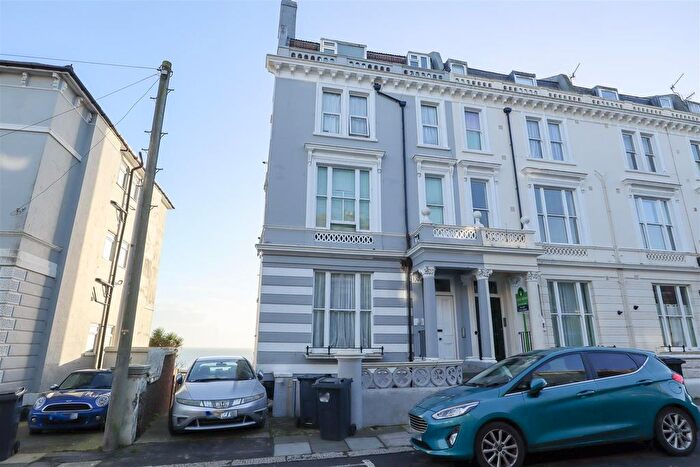
Properties for sale in Gensing
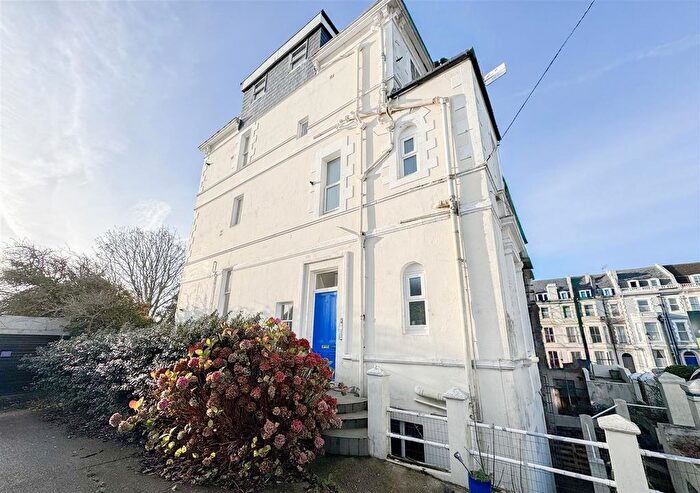
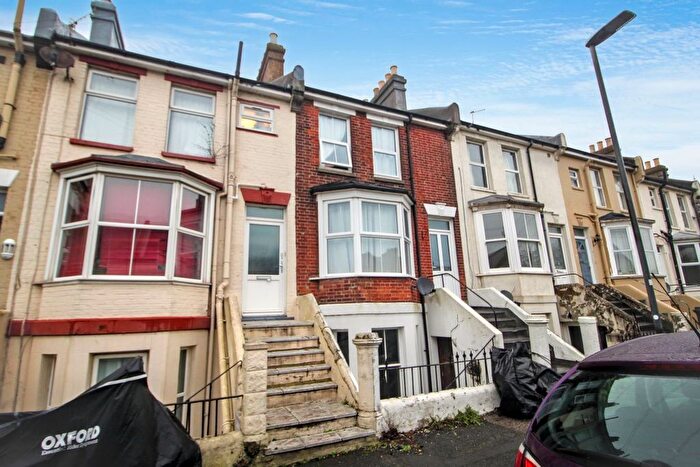
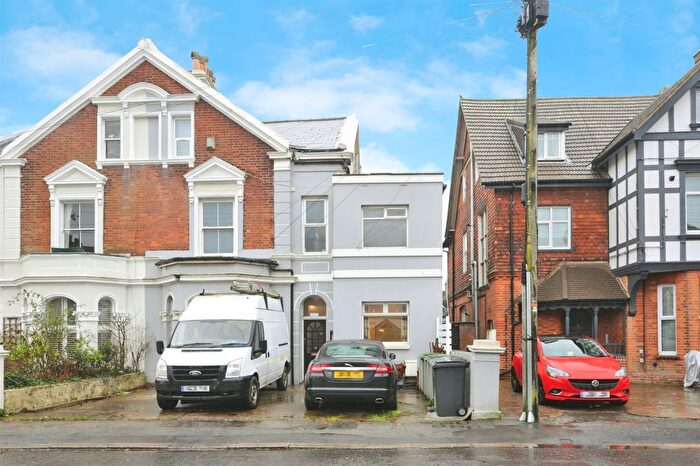
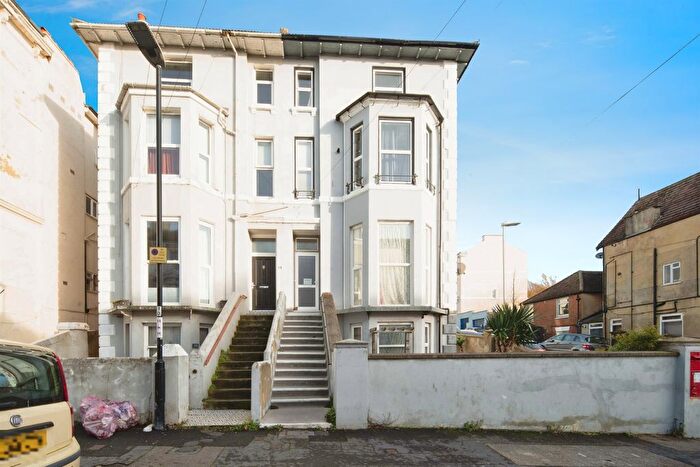
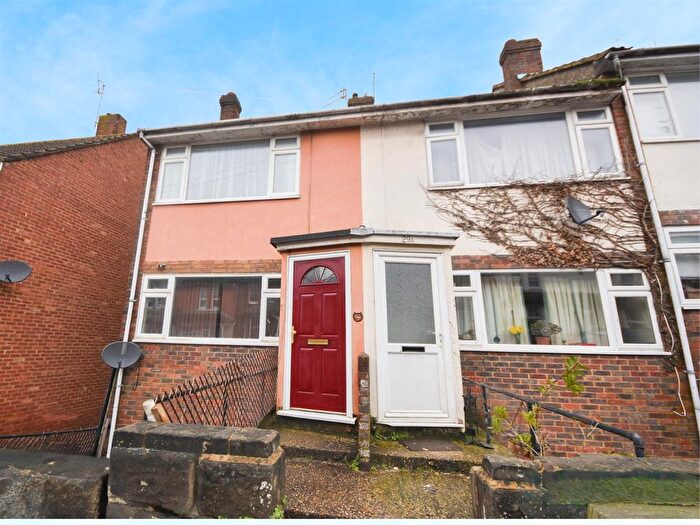
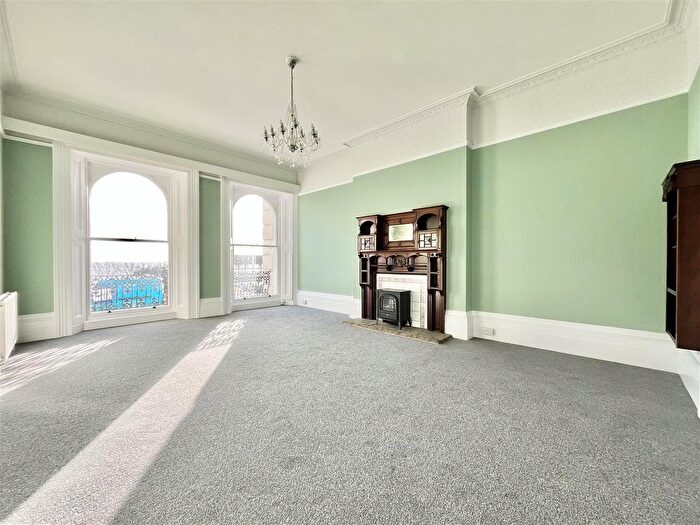
![]()
If you are looking to sell your house, let it out, or receive a property valuation, an expert can help you.
Click the button below to get started.

Roads and Postcodes in Gensing
Navigate through our locations to find the location of your next house in Gensing, St Leonards-on-sea for sale or to rent.
Transport near Gensing

- FAQ
- Price Paid By Year
- Property Type Price
Frequently asked questions about Gensing
What is the average price for a property for sale in Gensing?
The average price for a property for sale in Gensing is £261,442. This amount is 11% lower than the average price in St Leonards-on-sea. There are 2,623 property listings for sale in Gensing.
What streets have the most expensive properties for sale in Gensing?
The streets with the most expensive properties for sale in Gensing are Clinton Crescent at an average of £695,500, Tower Road West at an average of £546,940 and The Green at an average of £442,166.
What streets have the most affordable properties for sale in Gensing?
The streets with the most affordable properties for sale in Gensing are Ellenslea Road at an average of £127,444, Blomfield Road at an average of £150,800 and Bohemy Fields at an average of £158,250.
Which train stations are available in or near Gensing?
Some of the train stations available in or near Gensing are St.Leonards Warrior Square, Hastings and West St Leonards.
Property Price Paid in Gensing by Year
The average sold property price by year was:
| Year | Average Sold Price | Price Change |
Sold Properties
|
|---|---|---|---|
| 2025 | £263,092 | 4% |
77 Properties |
| 2024 | £253,181 | -9% |
126 Properties |
| 2023 | £275,145 | 8% |
168 Properties |
| 2022 | £253,729 | 2% |
180 Properties |
| 2021 | £248,355 | 15% |
199 Properties |
| 2020 | £212,234 | 2% |
140 Properties |
| 2019 | £207,696 | 10% |
141 Properties |
| 2018 | £187,263 | 1% |
172 Properties |
| 2017 | £185,907 | 6% |
189 Properties |
| 2016 | £175,638 | 16% |
194 Properties |
| 2015 | £147,614 | -0,2% |
176 Properties |
| 2014 | £147,840 | 2% |
168 Properties |
| 2013 | £144,742 | -0,4% |
128 Properties |
| 2012 | £145,378 | 15% |
84 Properties |
| 2011 | £123,302 | -7% |
86 Properties |
| 2010 | £131,881 | -10% |
100 Properties |
| 2009 | £144,535 | 11% |
87 Properties |
| 2008 | £128,341 | -10% |
110 Properties |
| 2007 | £140,855 | 6% |
247 Properties |
| 2006 | £131,700 | 8% |
260 Properties |
| 2005 | £120,807 | 4% |
184 Properties |
| 2004 | £116,430 | 16% |
258 Properties |
| 2003 | £97,452 | 17% |
244 Properties |
| 2002 | £80,479 | 27% |
324 Properties |
| 2001 | £58,684 | 12% |
256 Properties |
| 2000 | £51,742 | 6% |
231 Properties |
| 1999 | £48,821 | 2% |
202 Properties |
| 1998 | £47,751 | 18% |
189 Properties |
| 1997 | £39,146 | 2% |
178 Properties |
| 1996 | £38,185 | 6% |
166 Properties |
| 1995 | £35,878 | - |
169 Properties |
Property Price per Property Type in Gensing
Here you can find historic sold price data in order to help with your property search.
The average Property Paid Price for specific property types in the last three years are:
| Property Type | Average Sold Price | Sold Properties |
|---|---|---|
| Semi Detached House | £571,527.00 | 33 Semi Detached Houses |
| Detached House | £654,436.00 | 24 Detached Houses |
| Terraced House | £323,353.00 | 116 Terraced Houses |
| Flat | £190,420.00 | 378 Flats |