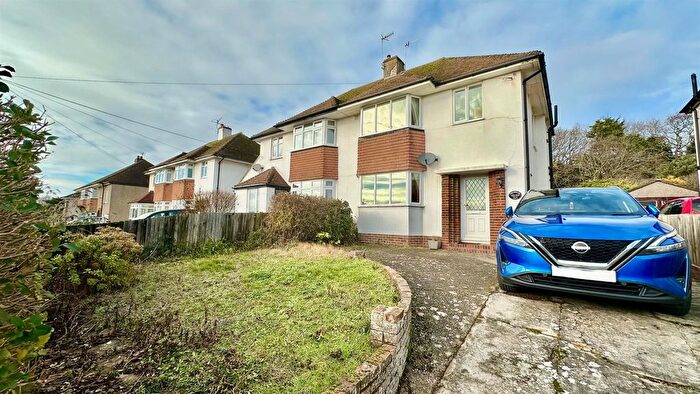
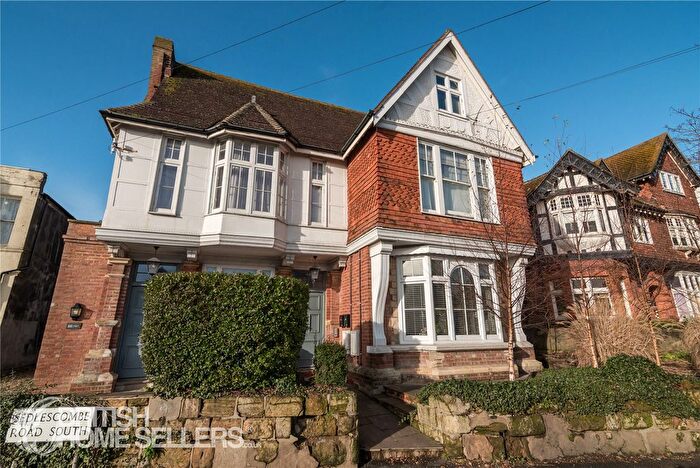
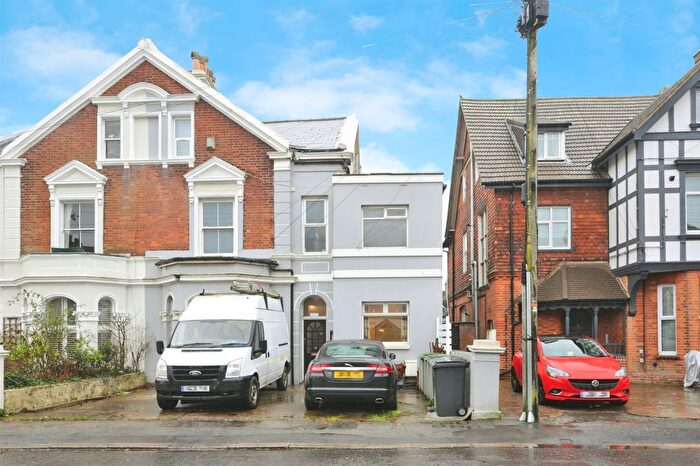
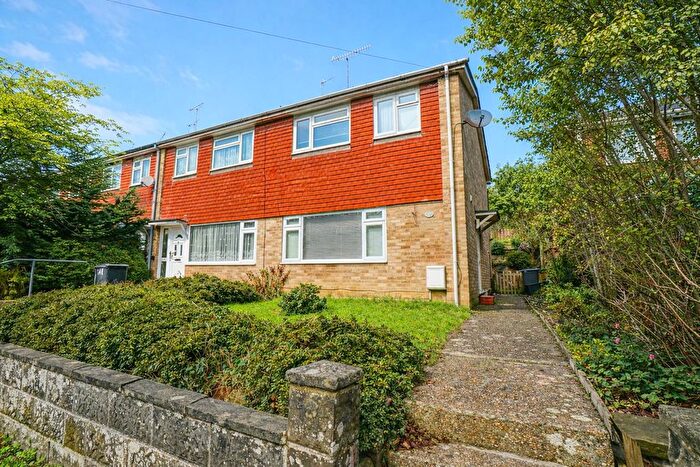
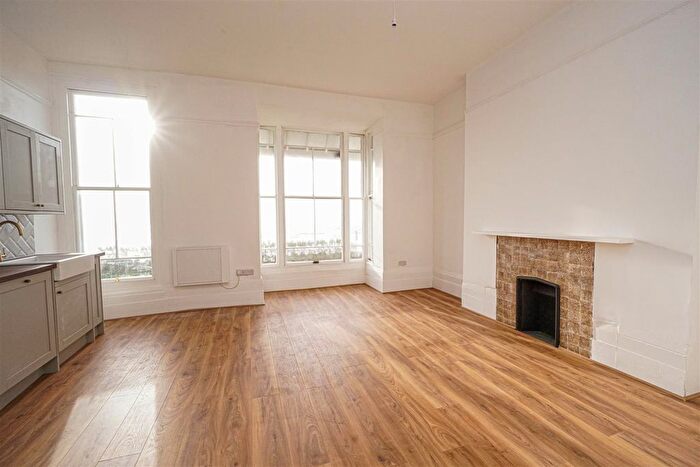
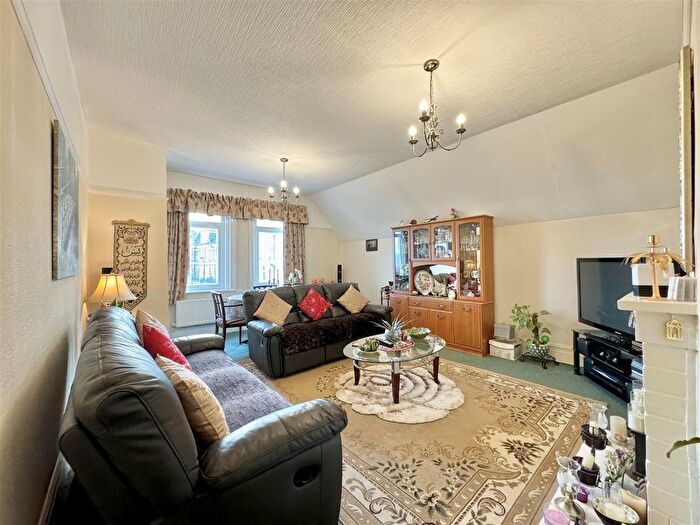
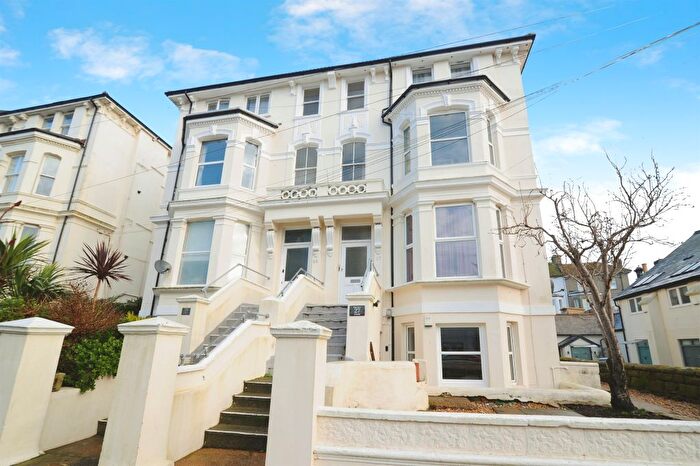
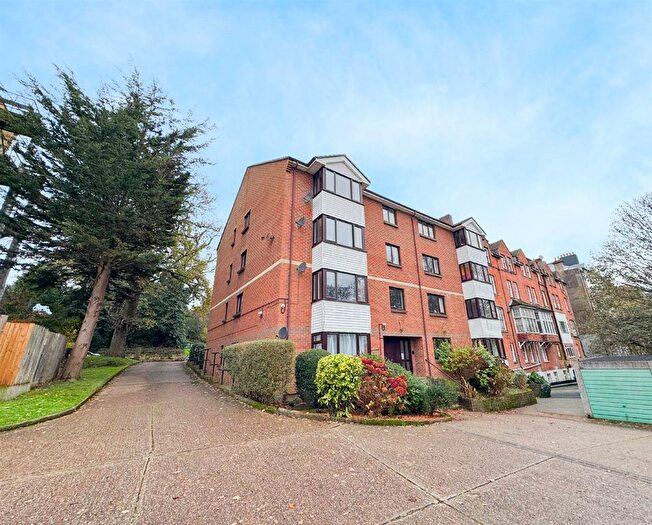
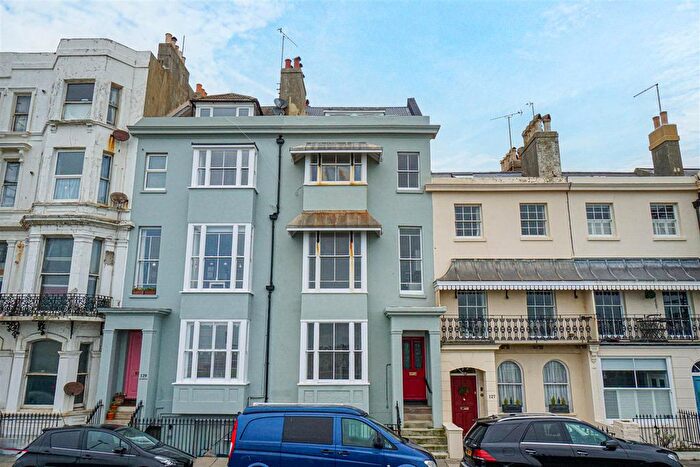
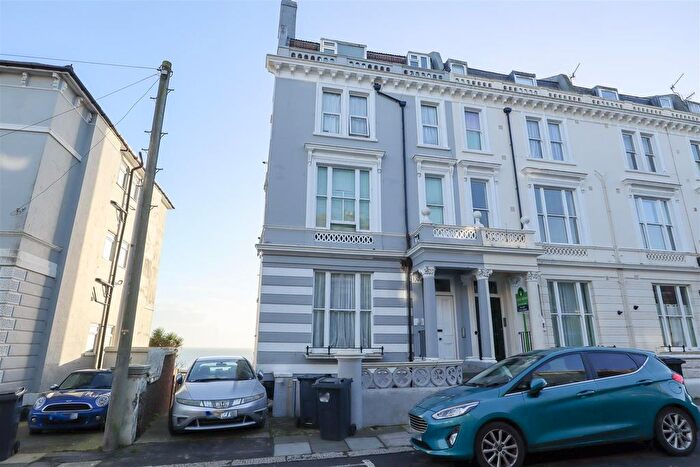
Houses for sale & to rent in Maze Hill, St Leonards-on-sea
House Prices in Maze Hill
Properties in Maze Hill have an average house price of £340,674.00 and had 348 Property Transactions within the last 3 years¹.
Maze Hill is an area in St Leonards-on-sea, East Sussex with 2,297 households², where the most expensive property was sold for £3,038,261.00.
Properties for sale in Maze Hill
Roads and Postcodes in Maze Hill
Navigate through our locations to find the location of your next house in Maze Hill, St Leonards-on-sea for sale or to rent.
| Streets | Postcodes |
|---|---|
| Addington Close | TN38 0PW |
| Albany Road | TN38 0YA TN38 0LL TN38 0LJ TN38 0LN TN38 0LP TN38 0YB |
| Archery Gardens | TN38 0FJ |
| Archery Road | TN38 0YN TN38 0HZ TN38 0HY TN38 0AF TN38 0FZ |
| Ascot Mews | TN38 0WH |
| Avondale Road | TN38 0SA TN38 0SB |
| Belvedere Park | TN38 0WE |
| Boscobel Road | TN38 0LU TN38 0LX TN38 0YL |
| Boscobel Road North | TN38 0NY TN38 0NZ |
| Branksome Road | TN38 0UA TN38 0UB |
| Burhill Way | TN38 0XP |
| Caple Gardens | TN38 0LW |
| Carnoustie Close | TN38 0WR |
| Cavendish Avenue | TN38 0NR |
| Chievely Cottages | TN38 0SS |
| Collinswood Drive | TN38 0NX TN38 0NU |
| Cypress Close | TN38 0PJ |
| Epsom Close | TN38 0WG |
| Essenden Road | TN38 0NN TN38 0XH TN38 0NW |
| Fern Road | TN38 0UH TN38 0UL TN38 0UP TN38 0UJ |
| Filsham Road | TN38 0PG TN38 0PA TN38 0PE TN38 0PQ |
| Filsham Valley | TN38 0PB |
| Fulford Close | TN38 0PN |
| Ganton Place | TN38 0XW |
| Gillsmans Hill | TN38 0SJ |
| Gleneagles Drive | TN38 0EH TN38 0HF TN38 0HU |
| Gresham Way | TN38 0UE TN38 0UG TN38 0UF |
| Highlands Drive | TN38 0HS |
| Highlands Gardens | TN38 0HT |
| Highlands Mews | TN38 0LT |
| Hollington Court | TN38 0SF |
| Hollington Park Close | TN38 0SQ |
| Hollington Park Road | TN38 0SG TN38 0SH TN38 0SE |
| Jubilee Gardens | TN38 0FS |
| Kempton Way | TN38 0FU |
| Knoll Rise | TN38 0NT |
| Larch Close | TN38 0RZ |
| Lime Close | TN38 0SR |
| Lytham Close | TN38 0XE |
| Marlborough Close | TN38 0RY |
| Maze Hill | TN38 0HN |
| Medina Terrace | TN38 0WJ |
| Merrimede Close | TN38 0PD |
| Muirfield Rise | TN38 0XL |
| Oak Terrace | TN38 0ST |
| Oxley Close | TN38 0SZ |
| Park Lodge Court | TN38 0JQ |
| Pevensey Road | TN38 0LR TN38 0YE TN38 0YG TN38 0LS TN38 0LZ TN38 0LY TN38 0YF |
| Quarry Hill | TN38 0HG TN38 0HP TN38 0HQ |
| Regency Gardens | TN38 0UD |
| Sandwich Drive | TN38 0XJ |
| Seaview Close | TN38 0FT |
| Southport Close | TN38 0PR |
| Southwood Close | TN38 0ZA |
| St Dominic Close | TN38 0PH |
| Summer Hill | TN38 0GP |
| Sunningdale Drive | TN38 0YQ TN38 0WB TN38 0WD |
| Sycamore Close | TN38 0WA |
| The Drive | TN38 0UR |
| The Fairway | TN38 0UT |
| The Green | TN38 0SU TN38 0SX |
| The Leas | TN38 0PU |
| The Links | TN38 0UN TN38 0UW |
| The Mount | TN38 0HR |
| Tudor Avenue | TN38 0NS |
| Turnberry Close | TN38 0WL |
| Upper Maze Hill | TN38 0LA TN38 0LD TN38 0LG TN38 0LH TN38 0LQ TN38 0YD TN38 0LB |
| Welbeck Avenue | TN38 0NP |
| Wellis Gardens | TN38 0UX TN38 0UY |
| Wentworth Way | TN38 0XG |
| West Hill Road | TN38 0NA TN38 0NB TN38 0ND TN38 0NE TN38 0NF TN38 0NH TN38 0NJ TN38 0NL TN38 0PS |
| Westerleigh Close | TN38 0UQ |
| Wingate Close | TN38 0SD |
Transport near Maze Hill
-
West St Leonards Station
-
St.Leonards Warrior Square Station
-
Hastings Station
-
Ore Station
-
Crowhurst Station
- FAQ
- Price Paid By Year
- Property Type Price
Frequently asked questions about Maze Hill
What is the average price for a property for sale in Maze Hill?
The average price for a property for sale in Maze Hill is £340,674. This amount is 16% higher than the average price in St Leonards-on-sea. There are 2,024 property listings for sale in Maze Hill.
What streets have the most expensive properties for sale in Maze Hill?
The streets with the most expensive properties for sale in Maze Hill are Caple Gardens at an average of £660,000, Highlands Drive at an average of £630,000 and Summer Hill at an average of £594,000.
What streets have the most affordable properties for sale in Maze Hill?
The streets with the most affordable properties for sale in Maze Hill are Archery Road at an average of £194,687, Hollington Court at an average of £216,500 and Upper Maze Hill at an average of £237,568.
Which train stations are available in or near Maze Hill?
Some of the train stations available in or near Maze Hill are West St Leonards, St.Leonards Warrior Square and Hastings.
Property Price Paid in Maze Hill by Year
The average sold property price by year was:
| Year | Average Sold Price | Price Change |
Sold Properties
|
|---|---|---|---|
| 2025 | £318,426 | -5% |
56 Properties |
| 2024 | £334,978 | 1% |
75 Properties |
| 2023 | £330,962 | -10% |
108 Properties |
| 2022 | £365,645 | 6% |
109 Properties |
| 2021 | £345,266 | 15% |
170 Properties |
| 2020 | £293,153 | 13% |
100 Properties |
| 2019 | £255,283 | 3% |
101 Properties |
| 2018 | £247,670 | -2% |
102 Properties |
| 2017 | £253,321 | 12% |
132 Properties |
| 2016 | £222,165 | 10% |
140 Properties |
| 2015 | £199,660 | -10% |
129 Properties |
| 2014 | £219,095 | 16% |
129 Properties |
| 2013 | £183,692 | 6% |
112 Properties |
| 2012 | £172,670 | -7% |
67 Properties |
| 2011 | £184,794 | 9% |
89 Properties |
| 2010 | £168,671 | 3% |
77 Properties |
| 2009 | £163,829 | -11% |
79 Properties |
| 2008 | £182,521 | -3% |
78 Properties |
| 2007 | £187,223 | 3% |
172 Properties |
| 2006 | £182,293 | 10% |
166 Properties |
| 2005 | £163,859 | -5% |
150 Properties |
| 2004 | £172,759 | 22% |
163 Properties |
| 2003 | £133,934 | 11% |
151 Properties |
| 2002 | £118,983 | 16% |
198 Properties |
| 2001 | £99,814 | 20% |
185 Properties |
| 2000 | £79,482 | 7% |
147 Properties |
| 1999 | £74,150 | 14% |
172 Properties |
| 1998 | £64,005 | 15% |
140 Properties |
| 1997 | £54,654 | -5% |
164 Properties |
| 1996 | £57,607 | 13% |
164 Properties |
| 1995 | £50,340 | - |
97 Properties |
Property Price per Property Type in Maze Hill
Here you can find historic sold price data in order to help with your property search.
The average Property Paid Price for specific property types in the last three years are:
| Property Type | Average Sold Price | Sold Properties |
|---|---|---|
| Semi Detached House | £395,621.00 | 64 Semi Detached Houses |
| Detached House | £517,088.00 | 93 Detached Houses |
| Terraced House | £321,818.00 | 11 Terraced Houses |
| Flat | £231,141.00 | 180 Flats |

