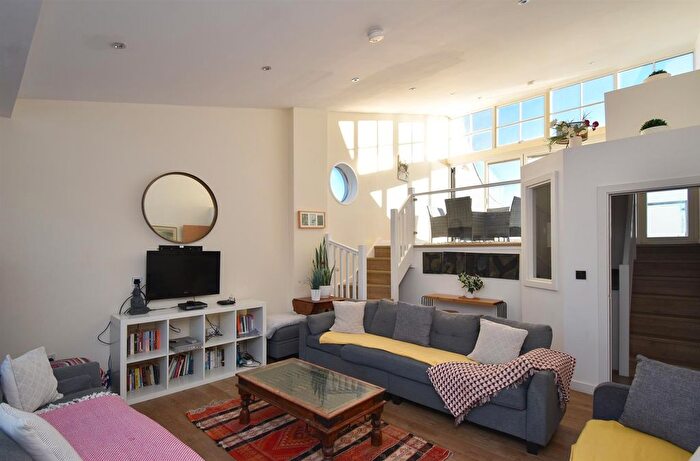
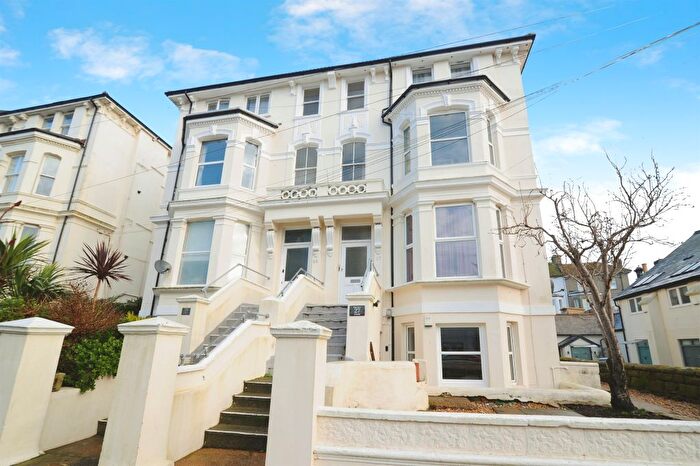
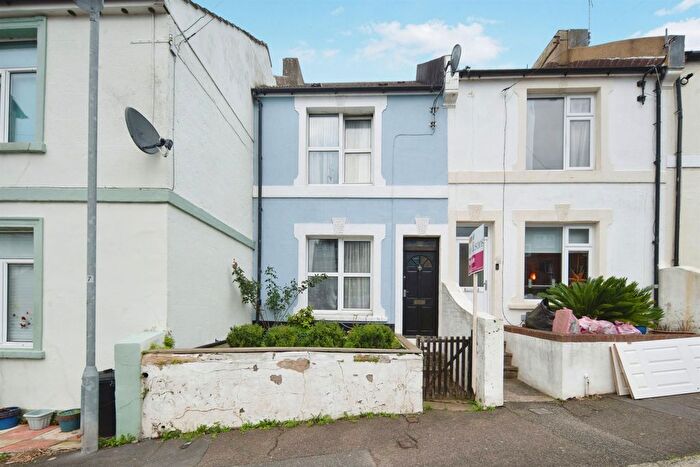
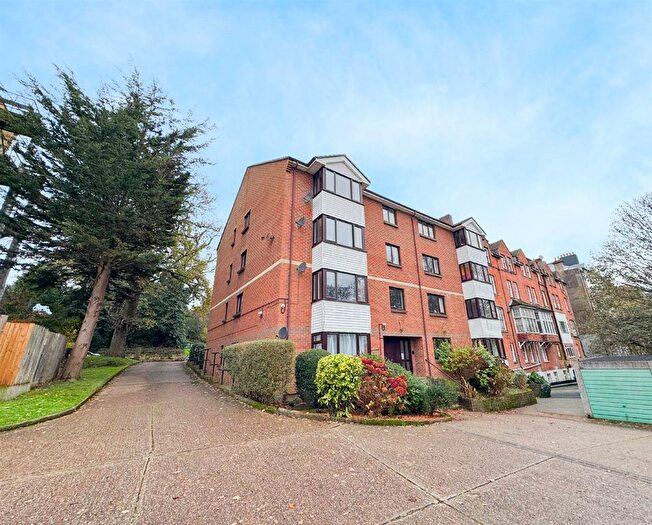
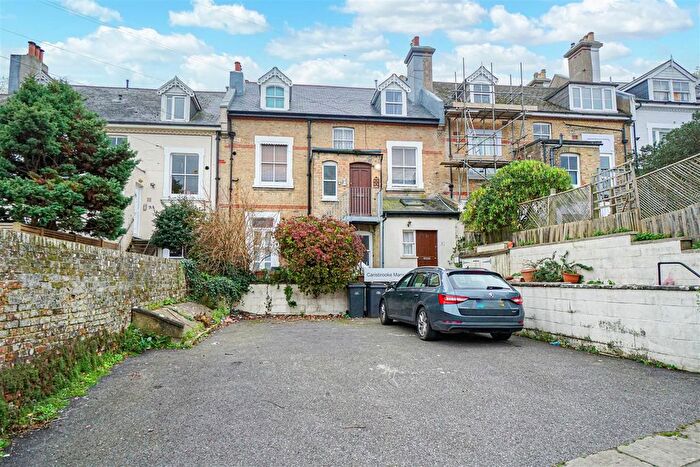
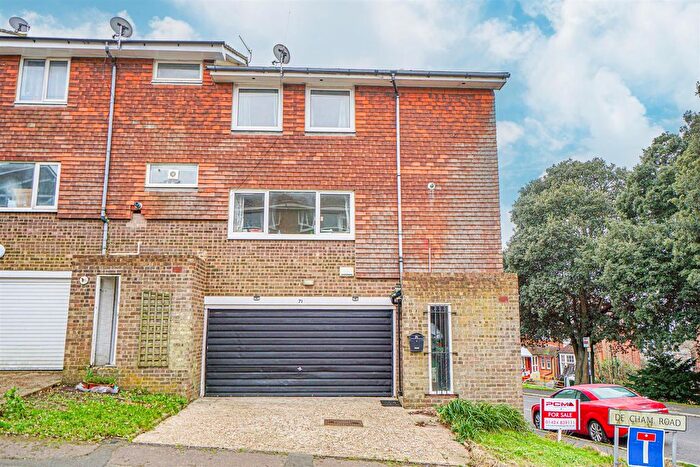
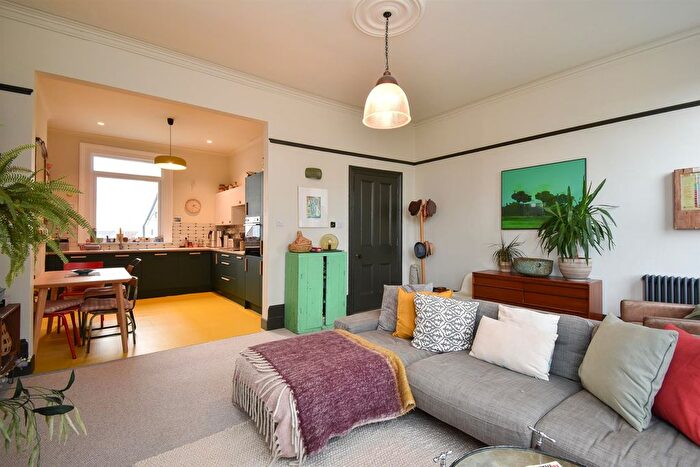
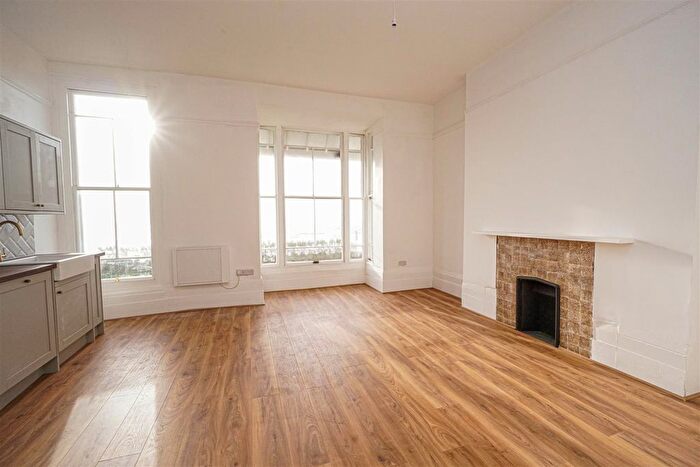
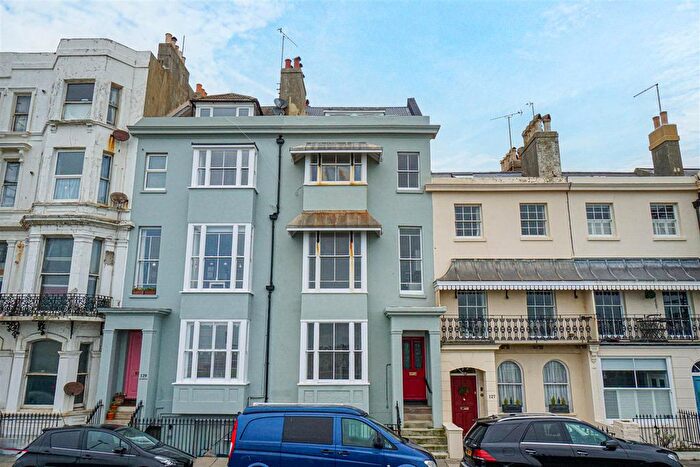
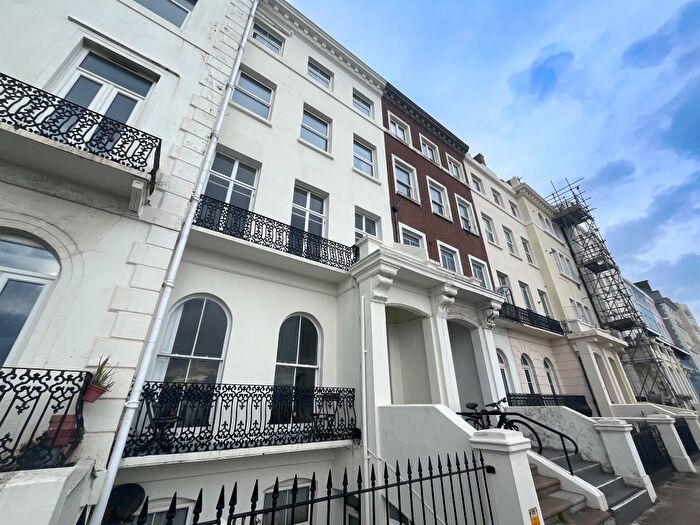
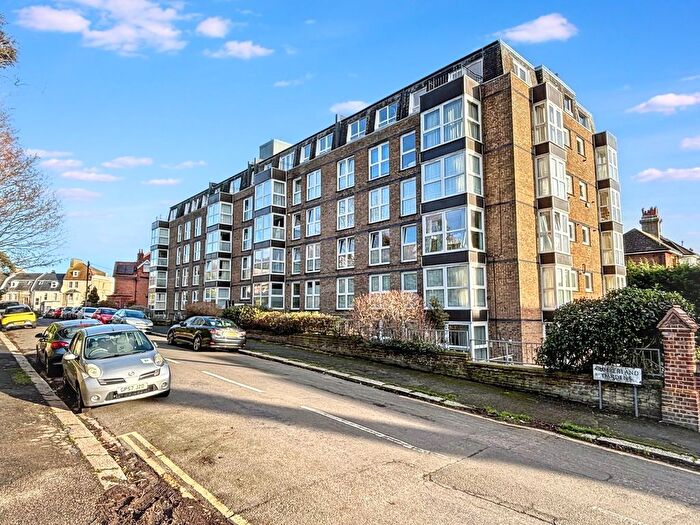
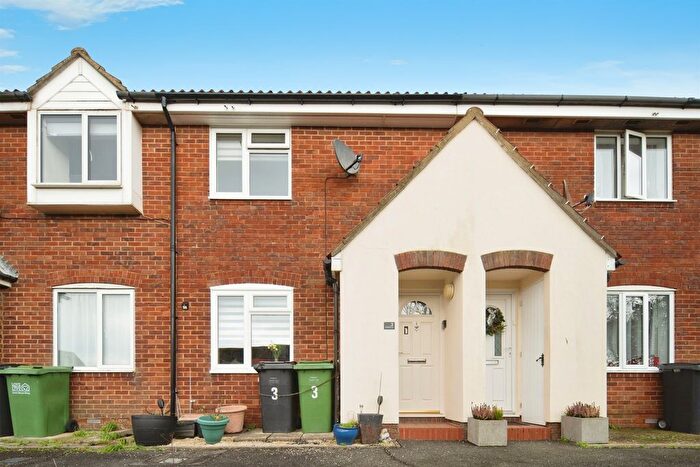
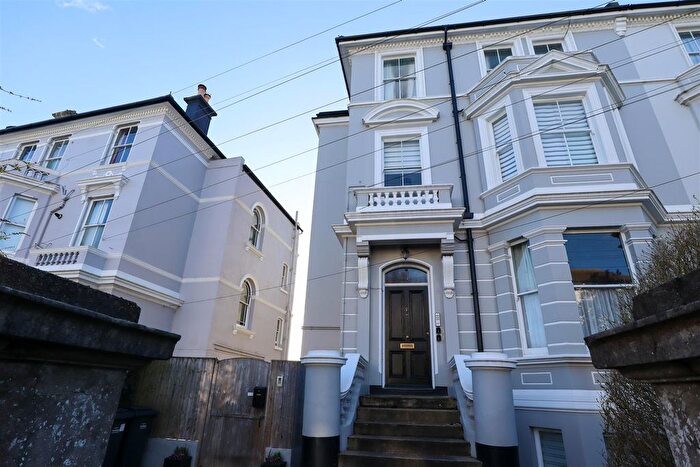
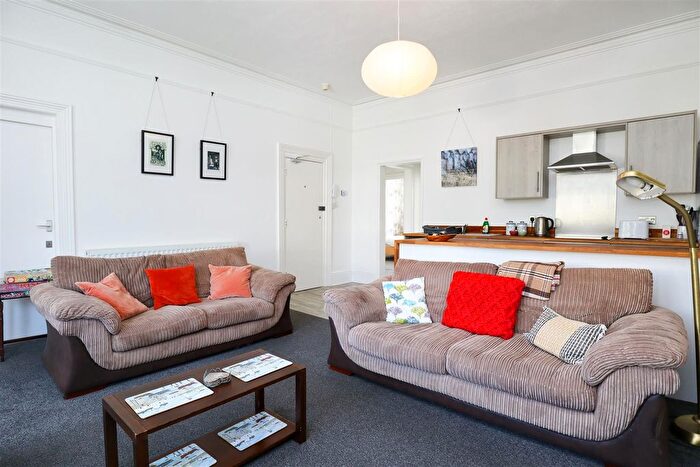
Houses for sale & to rent in Central St Leonards, St Leonards-on-sea
House Prices in Central St Leonards
Properties in Central St Leonards have an average house price of £234,409.00 and had 612 Property Transactions within the last 3 years¹.
Central St Leonards is an area in St Leonards-on-sea, East Sussex with 4,327 households², where the most expensive property was sold for £1,650,000.00.
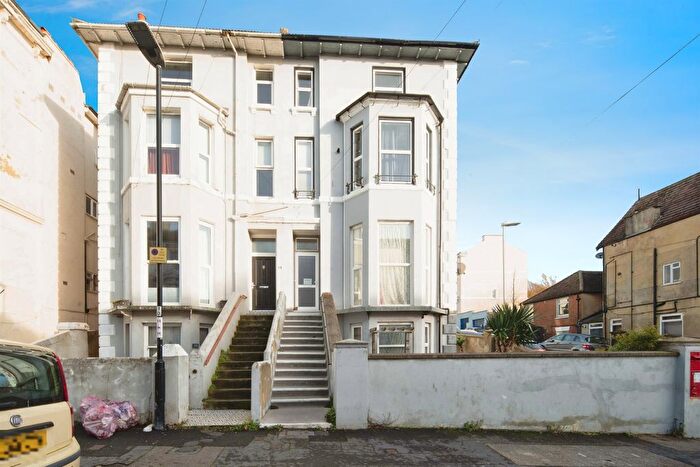
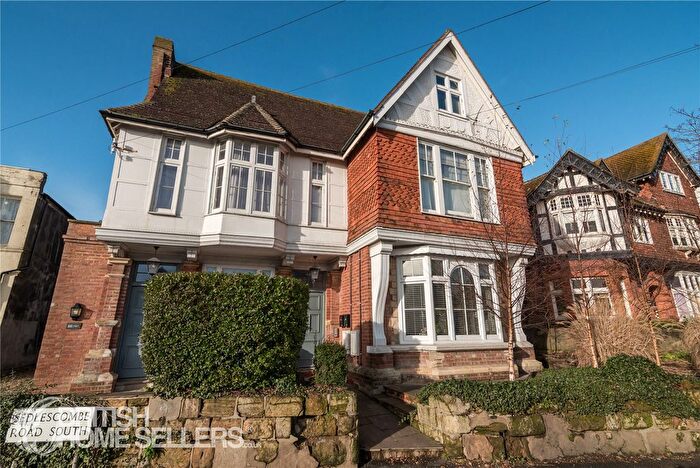
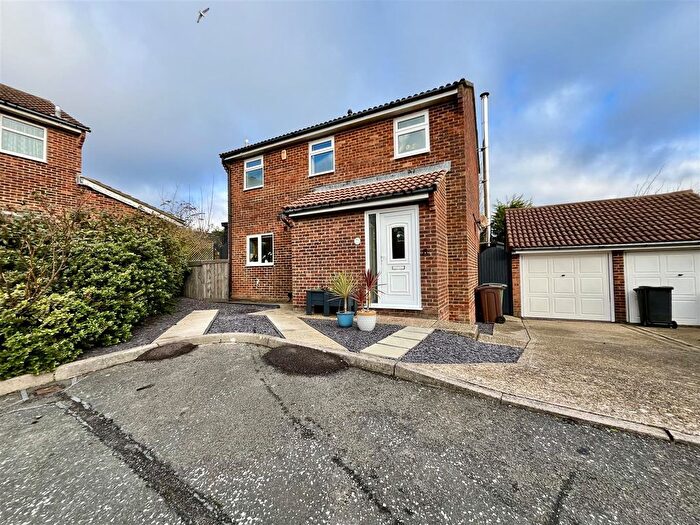
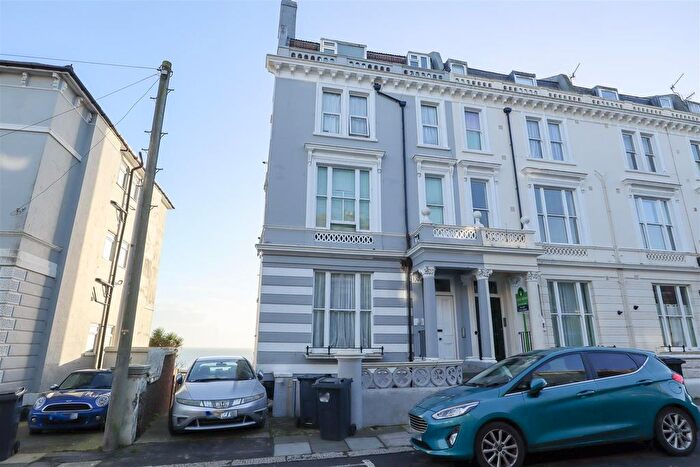
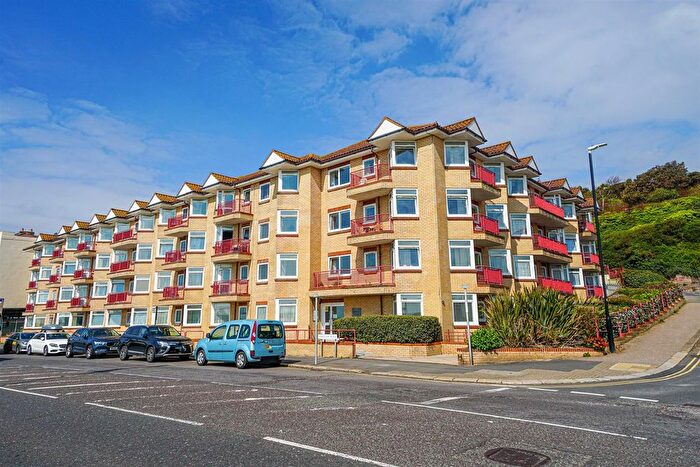
Properties for sale in Central St Leonards
Roads and Postcodes in Central St Leonards
Navigate through our locations to find the location of your next house in Central St Leonards, St Leonards-on-sea for sale or to rent.
Transport near Central St Leonards
- FAQ
- Price Paid By Year
- Property Type Price
Frequently asked questions about Central St Leonards
What is the average price for a property for sale in Central St Leonards?
The average price for a property for sale in Central St Leonards is £234,409. This amount is 20% lower than the average price in St Leonards-on-sea. There are 2,176 property listings for sale in Central St Leonards.
What streets have the most expensive properties for sale in Central St Leonards?
The streets with the most expensive properties for sale in Central St Leonards are Undercliff Terrace at an average of £633,500, Stanhope Place at an average of £527,750 and St Margarets Terrace at an average of £460,000.
What streets have the most affordable properties for sale in Central St Leonards?
The streets with the most affordable properties for sale in Central St Leonards are Greeba Court at an average of £75,750, St Marys Court at an average of £137,300 and Waverley Court at an average of £139,166.
Which train stations are available in or near Central St Leonards?
Some of the train stations available in or near Central St Leonards are St.Leonards Warrior Square, West St Leonards and Hastings.
Property Price Paid in Central St Leonards by Year
The average sold property price by year was:
| Year | Average Sold Price | Price Change |
Sold Properties
|
|---|---|---|---|
| 2025 | £227,473 | 0,1% |
90 Properties |
| 2024 | £227,289 | 1% |
158 Properties |
| 2023 | £224,514 | -12% |
158 Properties |
| 2022 | £250,489 | 15% |
206 Properties |
| 2021 | £212,215 | 14% |
282 Properties |
| 2020 | £182,378 | -3% |
143 Properties |
| 2019 | £187,155 | -1% |
161 Properties |
| 2018 | £188,848 | 8% |
221 Properties |
| 2017 | £173,443 | 9% |
223 Properties |
| 2016 | £158,600 | 15% |
238 Properties |
| 2015 | £134,510 | 13% |
275 Properties |
| 2014 | £116,487 | -1% |
203 Properties |
| 2013 | £118,232 | -2% |
126 Properties |
| 2012 | £120,752 | 7% |
96 Properties |
| 2011 | £112,209 | -5% |
114 Properties |
| 2010 | £118,305 | 10% |
115 Properties |
| 2009 | £106,720 | -10% |
136 Properties |
| 2008 | £117,200 | 1% |
193 Properties |
| 2007 | £115,867 | 7% |
412 Properties |
| 2006 | £107,794 | -2% |
324 Properties |
| 2005 | £110,394 | 11% |
311 Properties |
| 2004 | £97,819 | 19% |
345 Properties |
| 2003 | £79,226 | 12% |
407 Properties |
| 2002 | £69,791 | 30% |
433 Properties |
| 2001 | £49,030 | 9% |
387 Properties |
| 2000 | £44,687 | 15% |
300 Properties |
| 1999 | £38,160 | 10% |
307 Properties |
| 1998 | £34,274 | 11% |
264 Properties |
| 1997 | £30,500 | 1% |
220 Properties |
| 1996 | £30,066 | 9% |
178 Properties |
| 1995 | £27,405 | - |
161 Properties |
Property Price per Property Type in Central St Leonards
Here you can find historic sold price data in order to help with your property search.
The average Property Paid Price for specific property types in the last three years are:
| Property Type | Average Sold Price | Sold Properties |
|---|---|---|
| Semi Detached House | £566,812.00 | 8 Semi Detached Houses |
| Terraced House | £427,220.00 | 74 Terraced Houses |
| Flat | £202,097.00 | 529 Flats |
| Detached House | £400,000.00 | 1 Detached House |

