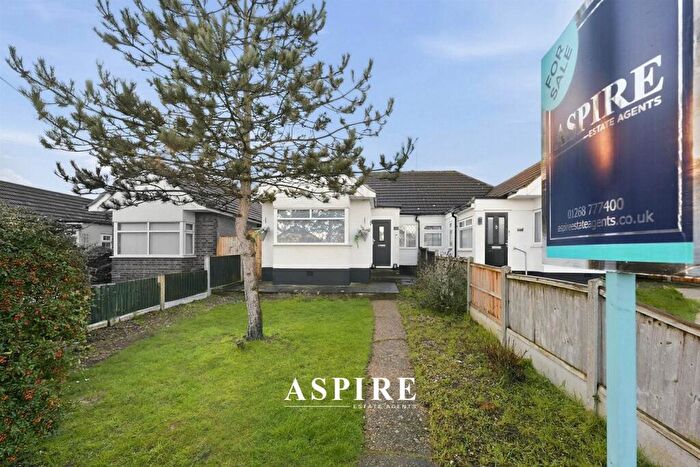
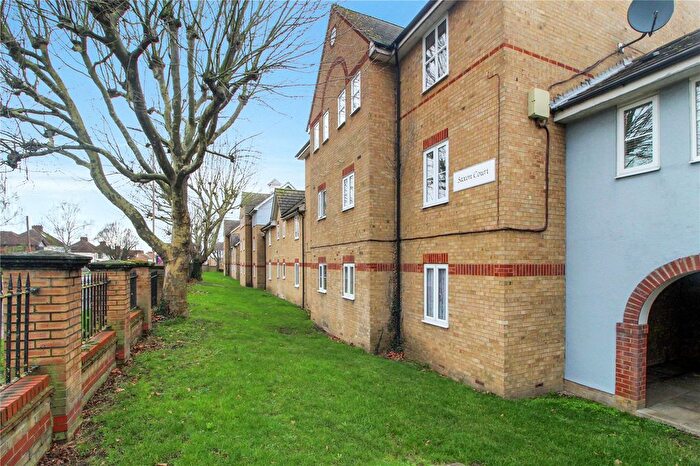
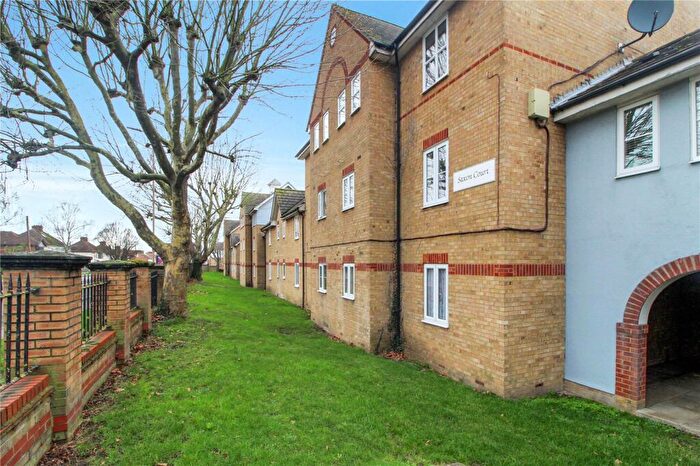
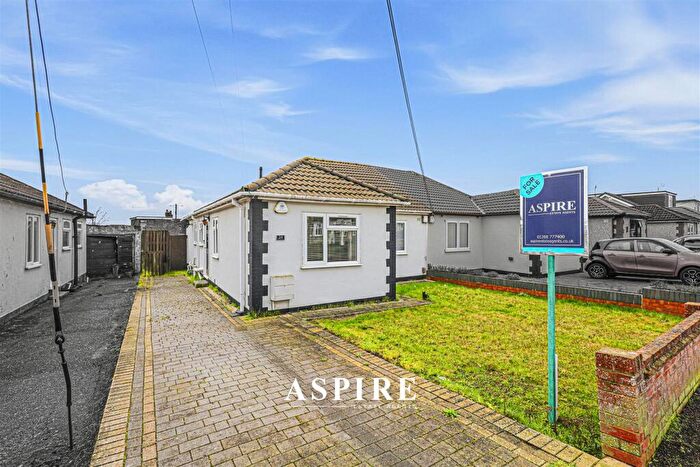
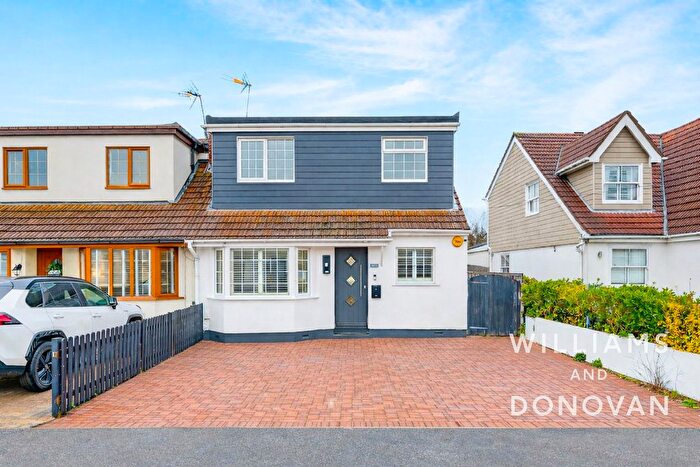
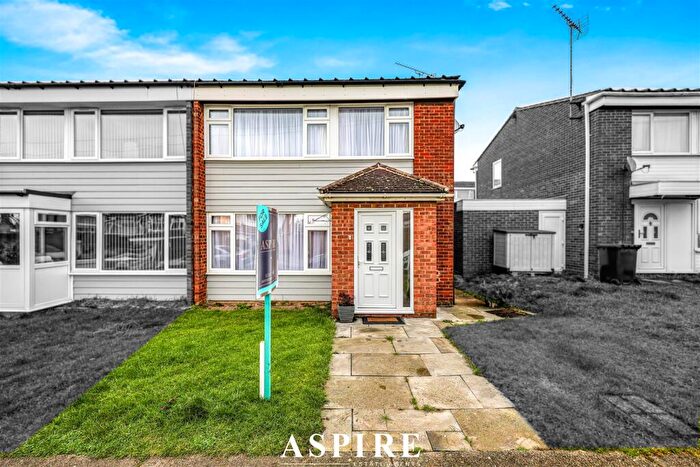
Houses for sale & to rent in St Georges, Benfleet
House Prices in St Georges
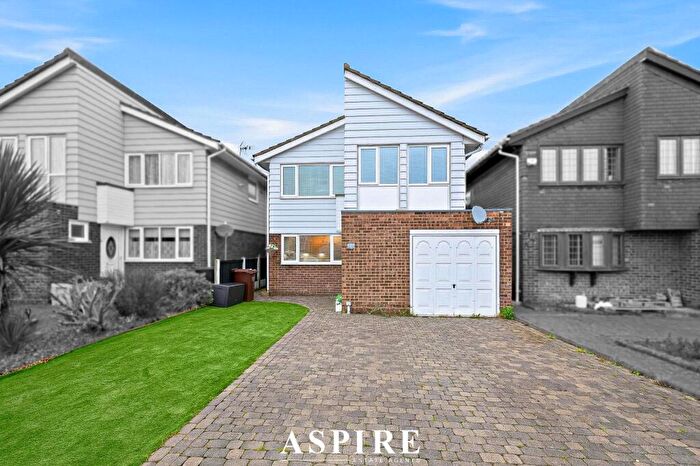
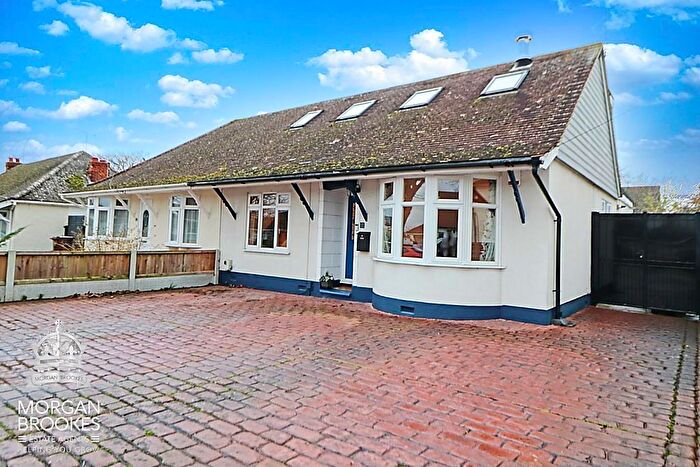
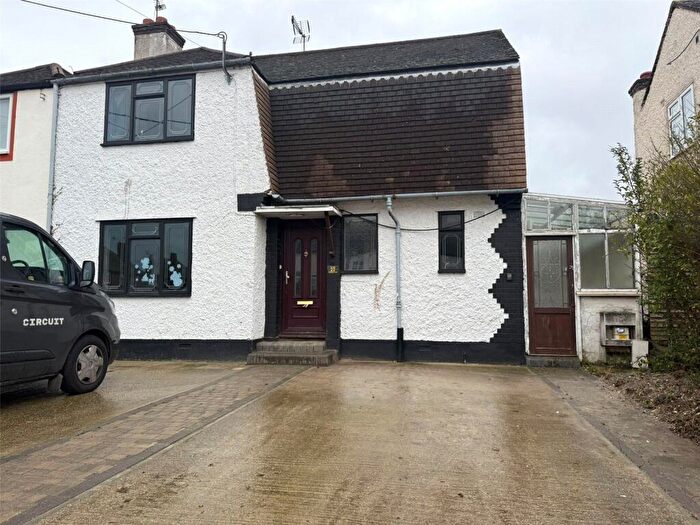
Properties in St Georges have an average house price of £373,431.33 and had 195 Property Transactions within the last 3 years¹.
St Georges is an area in Benfleet, Essex with 2,260 households², where the most expensive property was sold for £650,000.00.
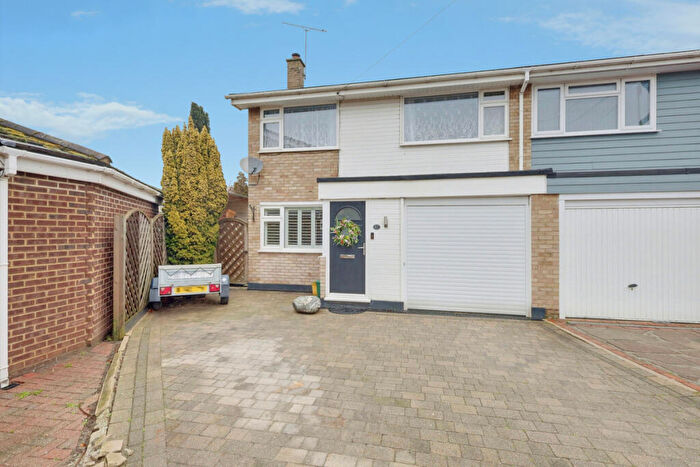
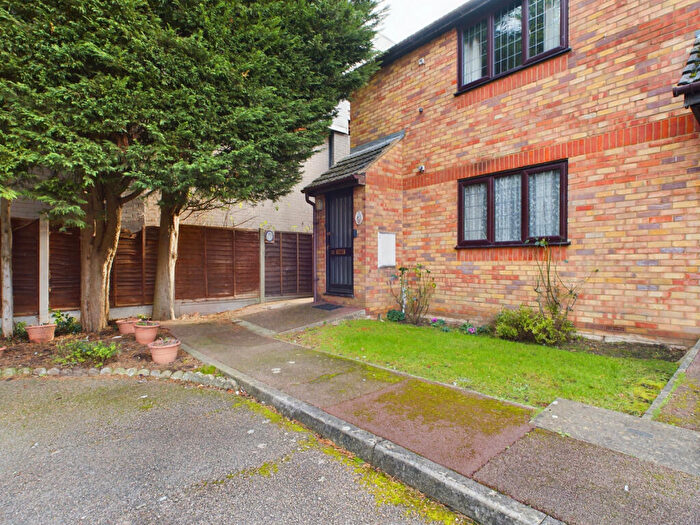
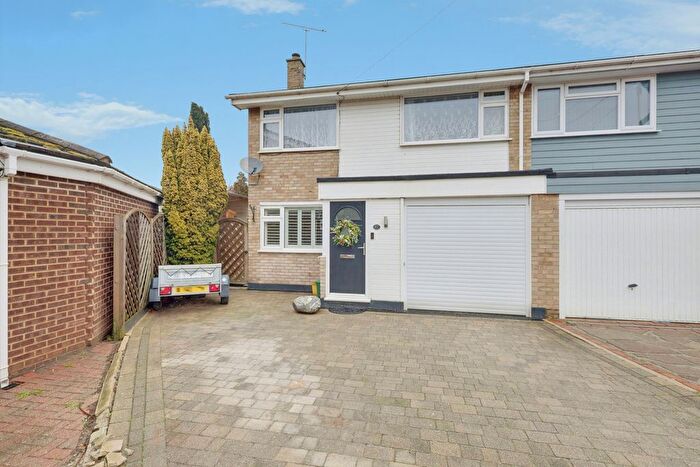
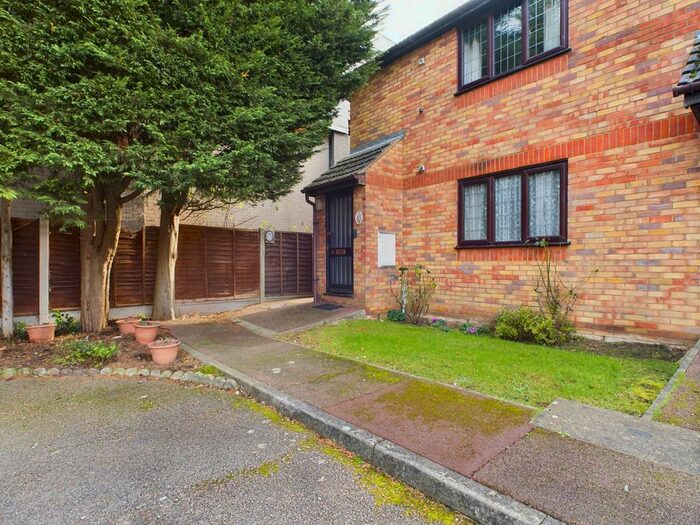
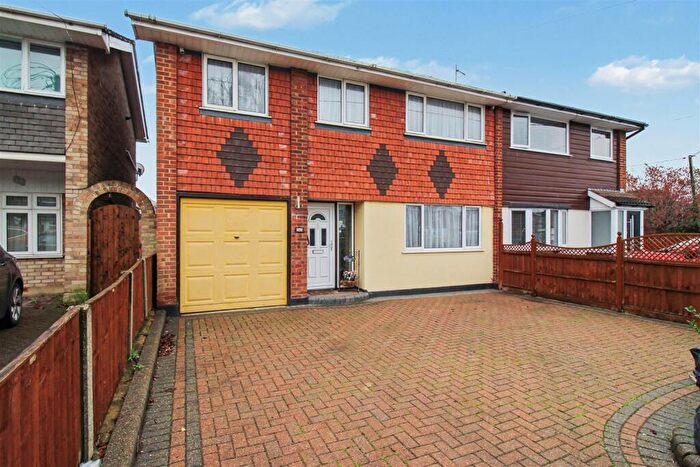
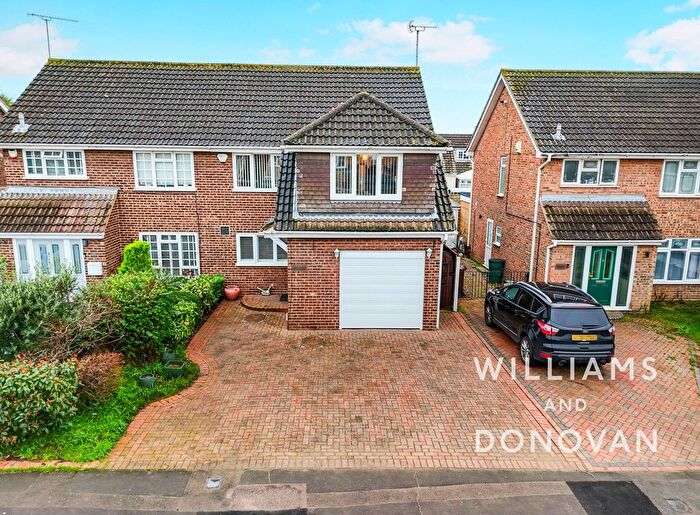
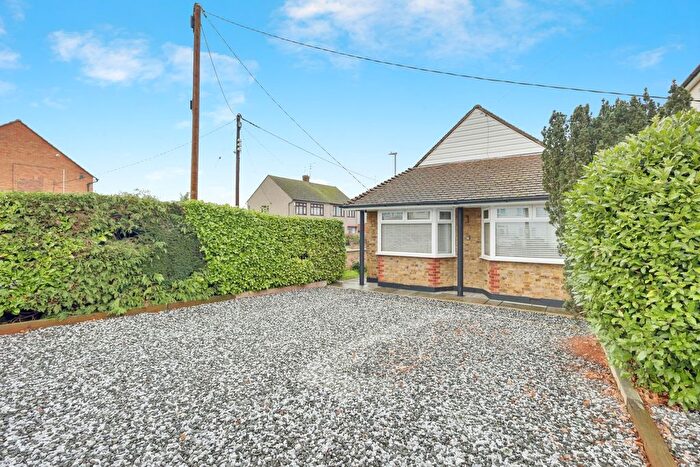
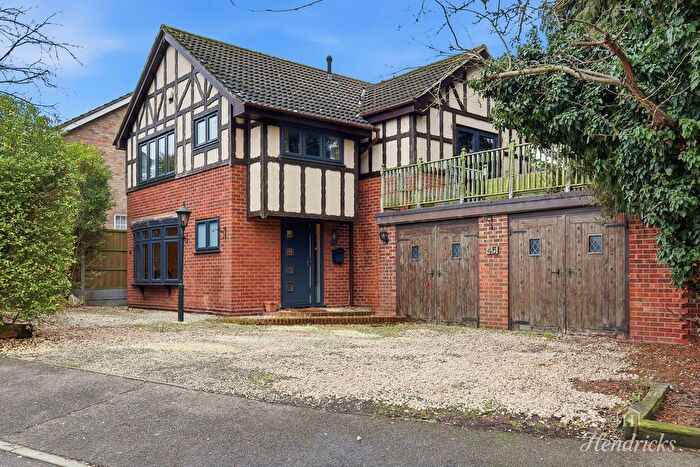
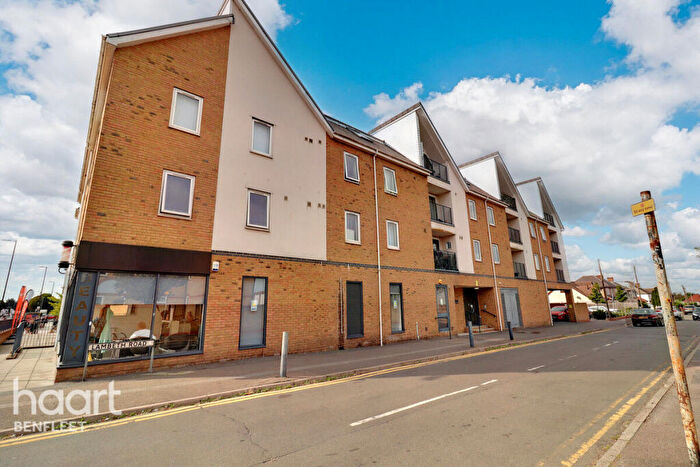
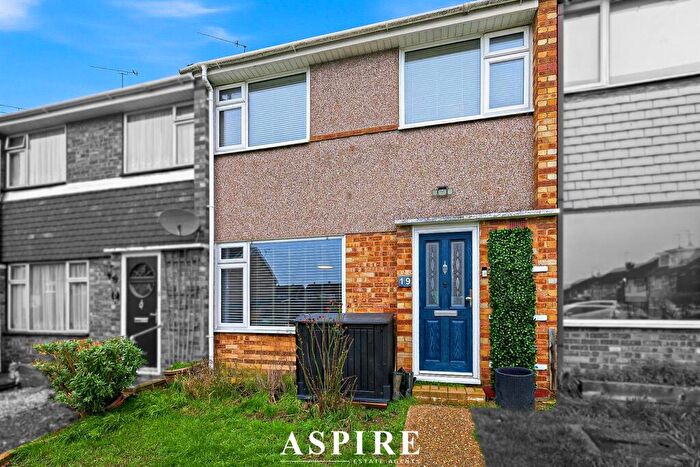
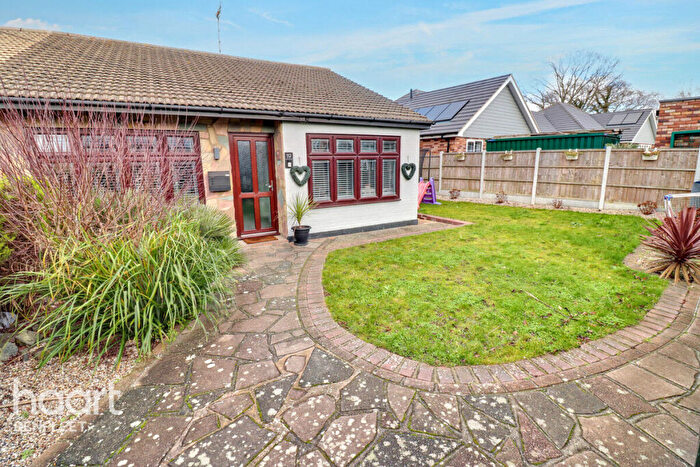
Properties for sale in St Georges
Roads and Postcodes in St Georges
Navigate through our locations to find the location of your next house in St Georges, Benfleet for sale or to rent.
| Streets | Postcodes |
|---|---|
| Albert Road | SS7 4DJ |
| Apeldoorn | SS7 4EH |
| Arundel Road | SS7 4EE SS7 4EF |
| Ashwood | SS7 4BQ |
| Bartley Close | SS7 4DD |
| Bartley Road | SS7 4DB SS7 4EL |
| Birch Close | SS7 4NE |
| Birchwood | SS7 4NL |
| Blyth Way | SS7 4HD |
| Church Road | SS7 4EU |
| Clare Road | SS7 4DE SS7 4EQ |
| Eversley Road | SS7 4JH SS7 4JT SS7 4LE SS7 4LF |
| Fairview Close | SS7 4JS |
| Fairview Crescent | SS7 4JP |
| Fairview Walk | SS7 4JR |
| Glebelands | SS7 4LT |
| Hamley Close | SS7 4PQ |
| Hazelwood | SS7 4NW |
| Hornbeams | SS7 4NP |
| Ivy Road | SS7 4DG |
| Kennedy Close | SS7 4EG |
| Lawns Court | SS7 4LG |
| Leaside | SS7 4DQ |
| Leighton Road | SS7 4NF |
| London Road | SS7 5TG SS7 5TH SS7 5TN |
| Louisa Avenue | SS7 4DA |
| Lower Church Road | SS7 4DL |
| Lyndene | SS7 4DZ |
| Mandeville Way | SS7 4LH |
| Manor Road | SS7 4PA |
| Maplin Close | SS7 4HE |
| Mayflowers | SS7 4LP |
| Meadway | SS7 4HG |
| Moreland Avenue | SS7 4ES SS7 4HB SS7 4HF SS7 4JJ SS7 4JW |
| Moreland Close | SS7 4ER |
| Muirway | SS7 4LS |
| Oak Walk | SS7 4SA SS7 4SB |
| Orchard Road | SS7 4DX |
| Overton Close | SS7 4DU |
| Overton Drive | SS7 4DS |
| Overton Road | SS7 4DP SS7 4DT SS7 4HA SS7 4HQ |
| Overton Way | SS7 4DR |
| Patterdale | SS7 4LQ |
| Roseberry Avenue | SS7 4HH SS7 4JF |
| Rosemead | SS7 4JQ |
| Rush Close | SS7 4BT |
| Rushbottom Lane | SS7 4BU SS7 4DN SS7 4DW SS7 4EB SS7 4LN SS7 4LR SS7 4LU SS7 4LY SS7 4EA SS7 4LW |
| Sadlers | SS7 4PE |
| Seamore Avenue | SS7 4EX SS7 4EZ SS7 4LA SS7 4NG |
| Seamore Close | SS7 4EY |
| Seamore Walk | SS7 4NQ |
| St Georges Walk | SS7 4PG |
| St Martins Close | SS7 4LL |
| Stansfield Road | SS7 4NA SS7 4NB SS7 4NJ |
| Steeple Heights | SS7 4RA |
| The Birches | SS7 4NT |
| The Fairway | SS7 4LB |
| The Larches | SS7 4NR |
| The Lawns | SS7 4LD |
| Virginia Close | SS7 4LJ |
| Woodcote Way | SS7 4ND |
| Woodside Avenue | SS7 4NH SS7 4NN SS7 4NU SS7 4NX SS7 4NY |
| Woodside View | SS7 4PB |
| Wren Close | SS7 4PF |
| Wycombe Avenue | SS7 4DF |
Transport near St Georges
- FAQ
- Price Paid By Year
- Property Type Price
Frequently asked questions about St Georges
What is the average price for a property for sale in St Georges?
The average price for a property for sale in St Georges is £373,431. This amount is 10% lower than the average price in Benfleet. There are 1,074 property listings for sale in St Georges.
What streets have the most expensive properties for sale in St Georges?
The streets with the most expensive properties for sale in St Georges are Wycombe Avenue at an average of £535,000, Sadlers at an average of £499,000 and Wren Close at an average of £475,000.
What streets have the most affordable properties for sale in St Georges?
The streets with the most affordable properties for sale in St Georges are Hazelwood at an average of £178,333, Patterdale at an average of £250,000 and Muirway at an average of £260,000.
Which train stations are available in or near St Georges?
Some of the train stations available in or near St Georges are Benfleet, Pitsea and Rayleigh.
Property Price Paid in St Georges by Year
The average sold property price by year was:
| Year | Average Sold Price | Price Change |
Sold Properties
|
|---|---|---|---|
| 2025 | £385,428 | 4% |
62 Properties |
| 2024 | £369,185 | 1% |
73 Properties |
| 2023 | £366,200 | -7% |
60 Properties |
| 2022 | £390,874 | 11% |
72 Properties |
| 2021 | £346,846 | 7% |
101 Properties |
| 2020 | £321,737 | 2% |
80 Properties |
| 2019 | £314,340 | -4% |
77 Properties |
| 2018 | £326,097 | 3% |
87 Properties |
| 2017 | £315,469 | 11% |
74 Properties |
| 2016 | £280,354 | 9% |
100 Properties |
| 2015 | £256,222 | 12% |
83 Properties |
| 2014 | £224,704 | 11% |
87 Properties |
| 2013 | £200,558 | 3% |
67 Properties |
| 2012 | £194,513 | 1% |
56 Properties |
| 2011 | £193,535 | -5% |
49 Properties |
| 2010 | £203,689 | 8% |
54 Properties |
| 2009 | £186,864 | -11% |
46 Properties |
| 2008 | £208,102 | -4% |
58 Properties |
| 2007 | £216,357 | 13% |
123 Properties |
| 2006 | £188,880 | -3% |
101 Properties |
| 2005 | £194,559 | 6% |
90 Properties |
| 2004 | £182,142 | 12% |
114 Properties |
| 2003 | £160,882.84 | 14% |
88 Properties |
| 2002 | £138,066 | 20% |
95 Properties |
| 2001 | £110,938 | 17% |
106 Properties |
| 2000 | £92,331 | 7% |
91 Properties |
| 1999 | £85,780.32 | 12% |
141 Properties |
| 1998 | £75,316 | 7% |
98 Properties |
| 1997 | £69,803 | 12% |
100 Properties |
| 1996 | £61,500 | 1% |
94 Properties |
| 1995 | £60,959 | - |
85 Properties |
Property Price per Property Type in St Georges
Here you can find historic sold price data in order to help with your property search.
The average Property Paid Price for specific property types in the last three years are:
| Property Type | Average Sold Price | Sold Properties |
|---|---|---|
| Semi Detached House | £378,618.00 | 127 Semi Detached Houses |
| Detached House | £435,703.00 | 28 Detached Houses |
| Terraced House | £351,995.00 | 30 Terraced Houses |
| Flat | £197,500.00 | 10 Flats |

