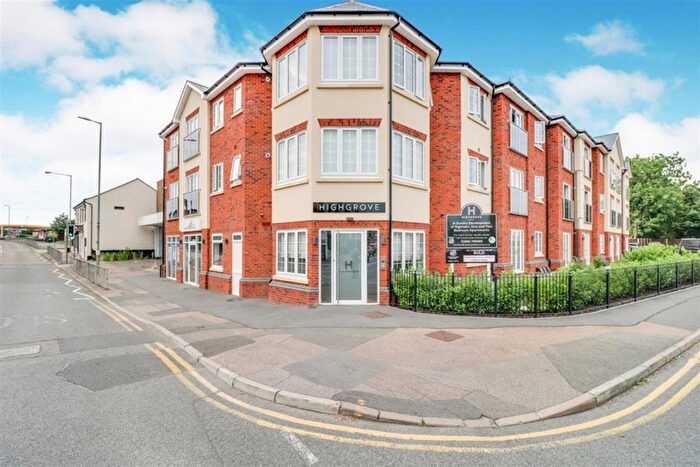
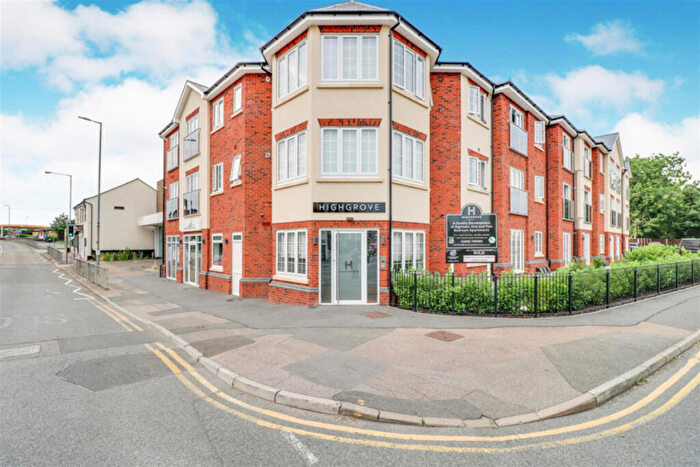
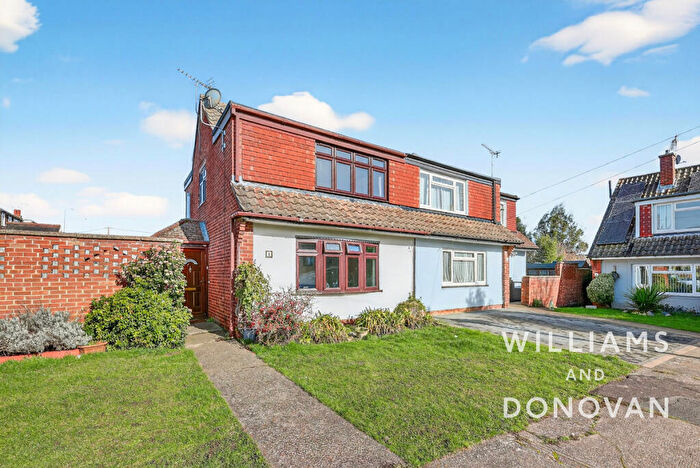
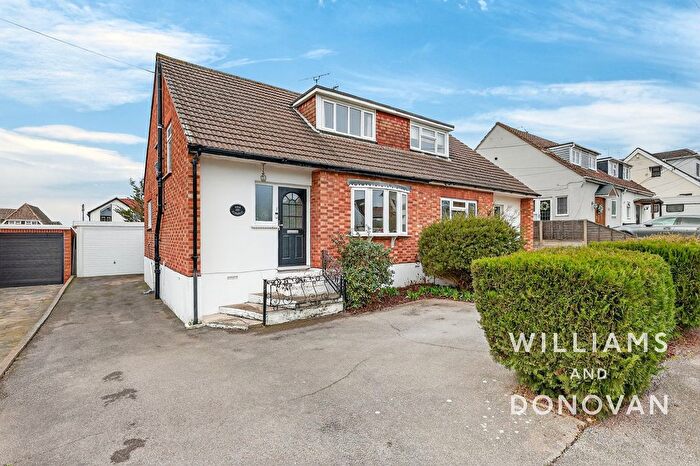
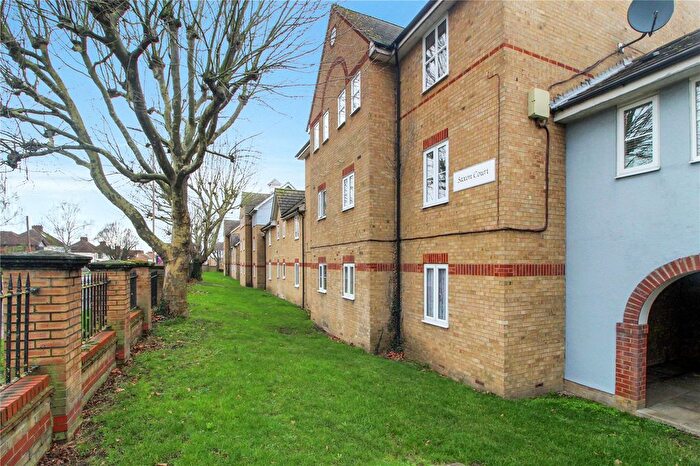
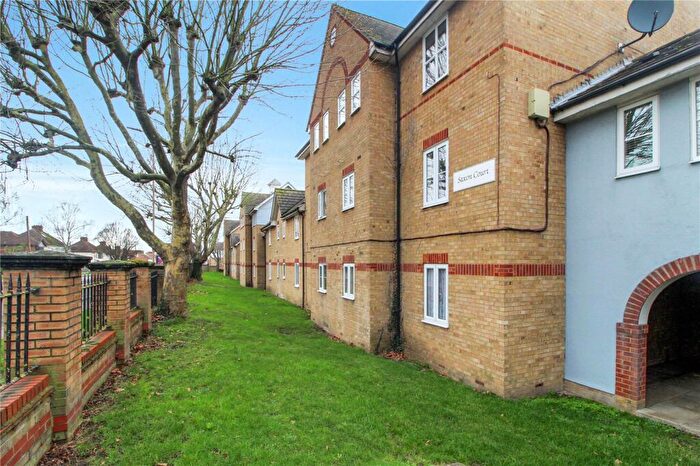
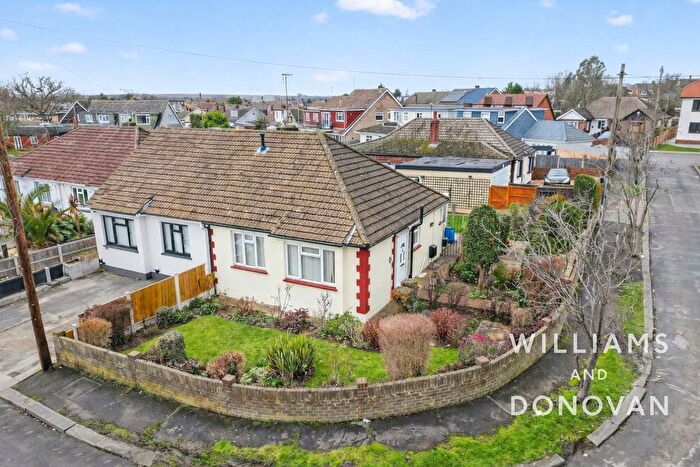
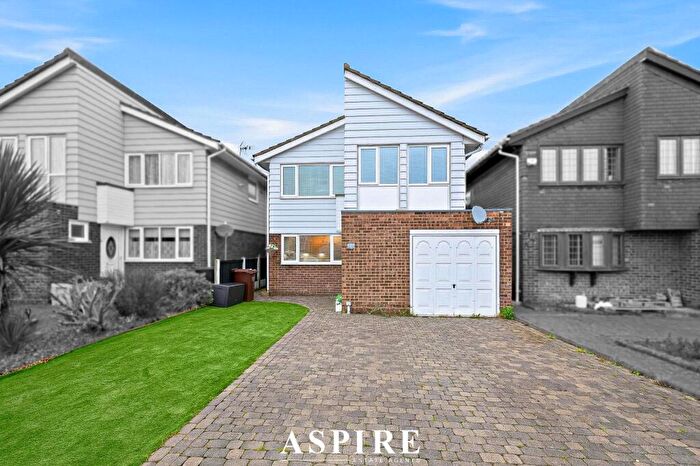
Houses for sale & to rent in Appleton, Benfleet
House Prices in Appleton
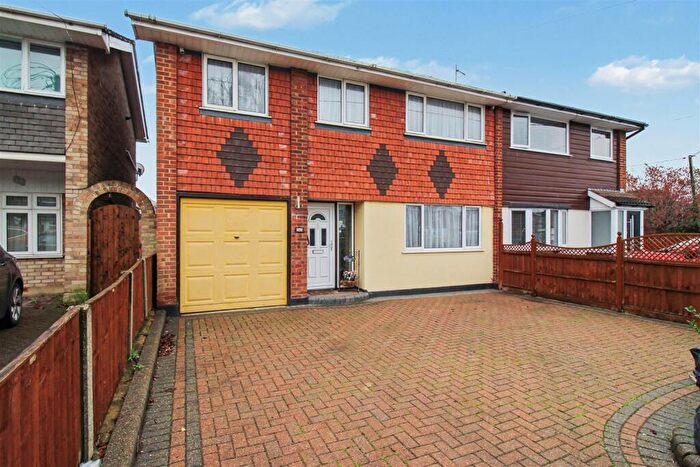
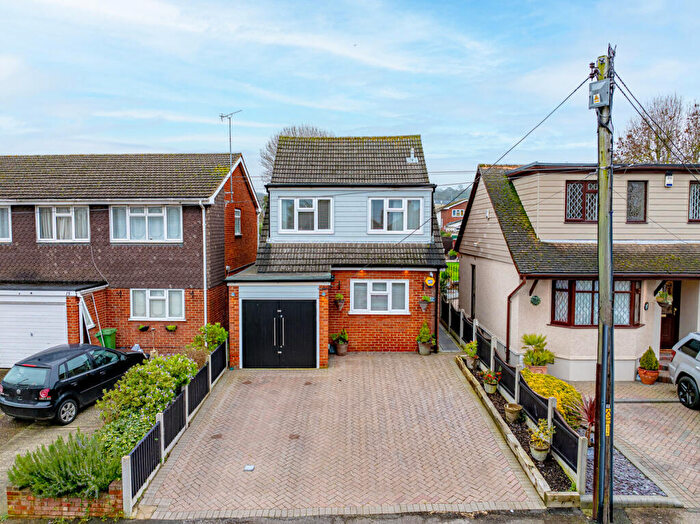
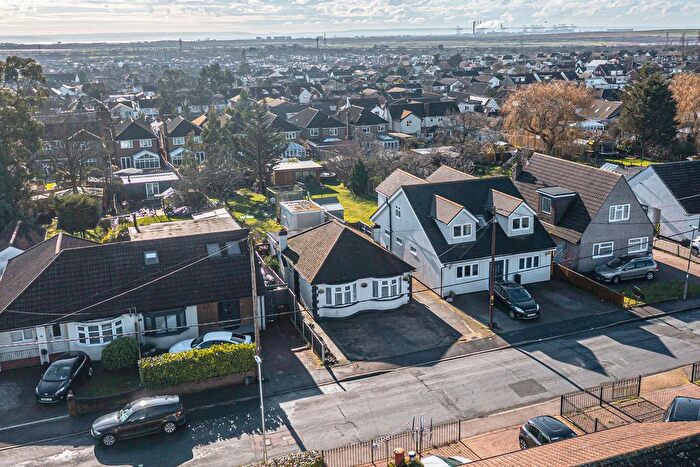
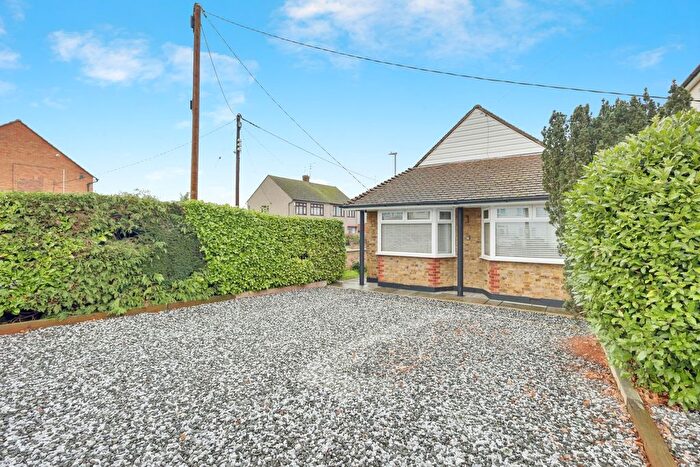
Properties in Appleton have an average house price of £425,176.00 and had 255 Property Transactions within the last 3 years¹.
Appleton is an area in Benfleet, Essex with 2,671 households², where the most expensive property was sold for £1,130,000.00.
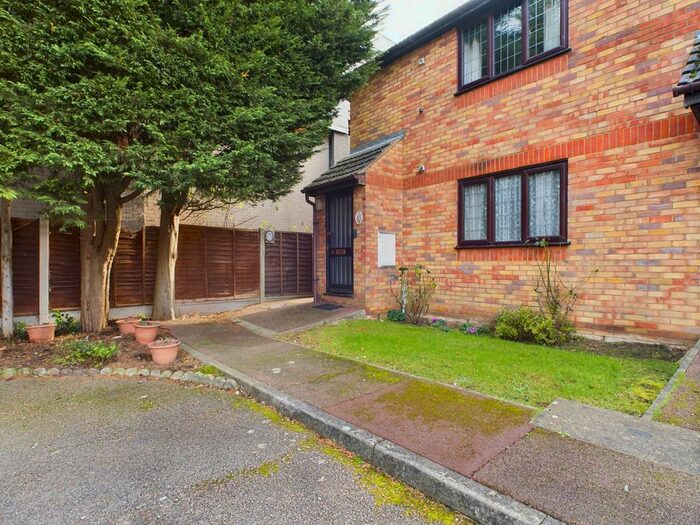
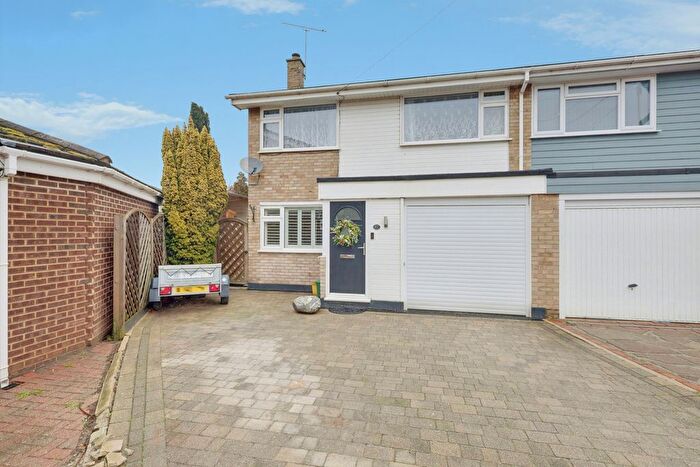
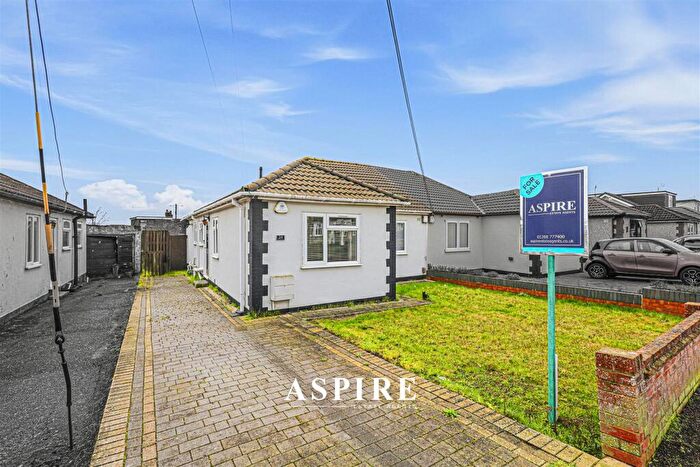
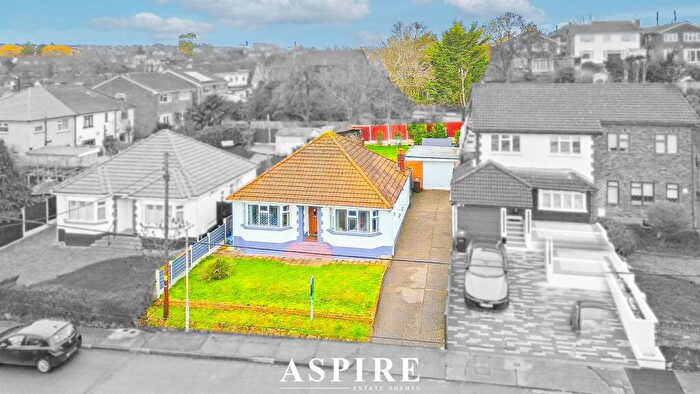
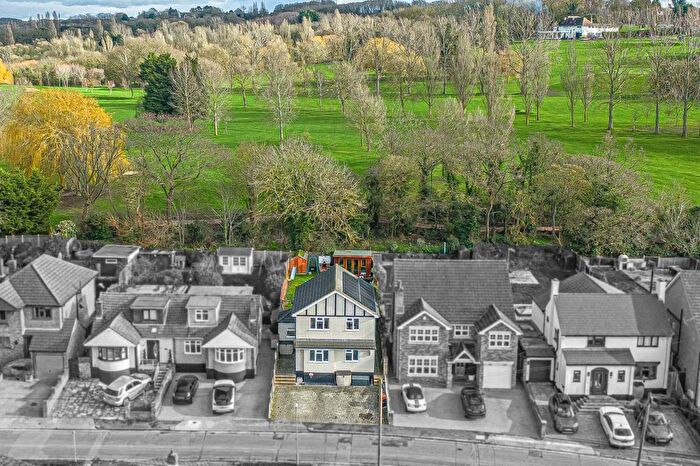
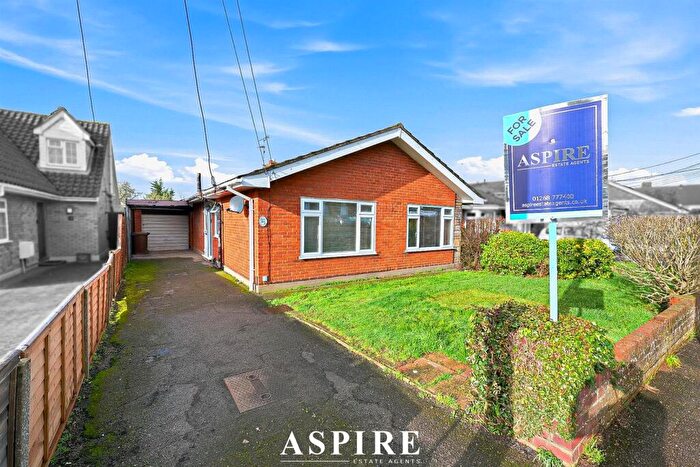
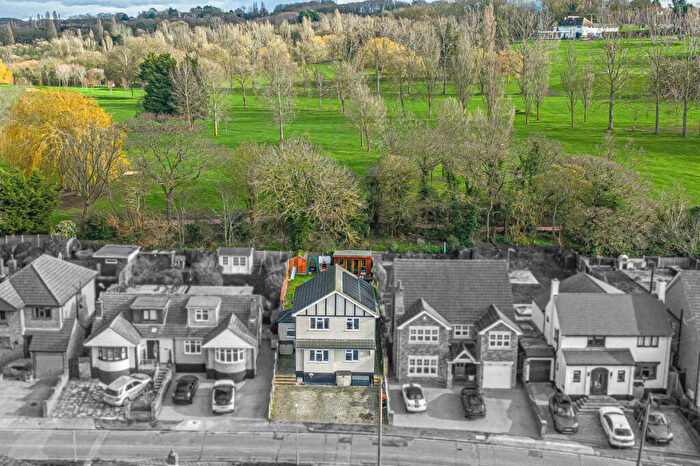
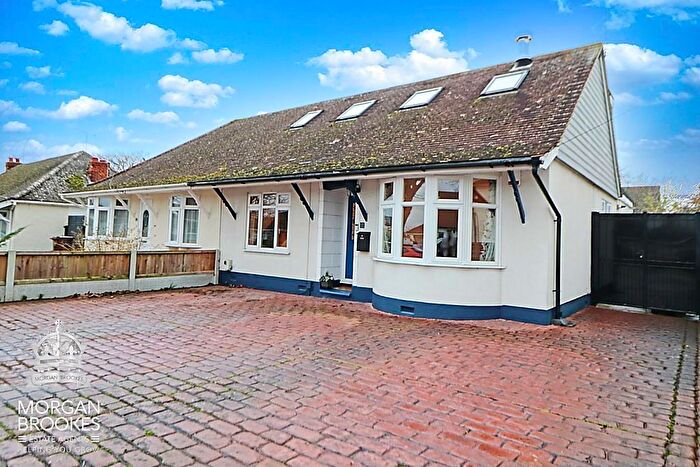
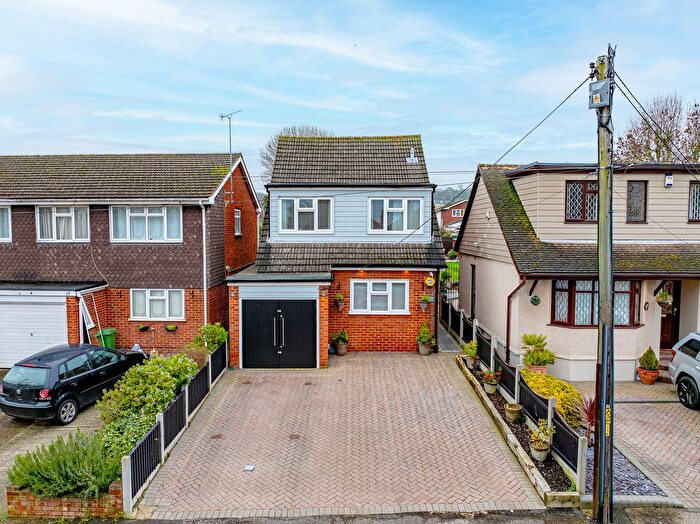
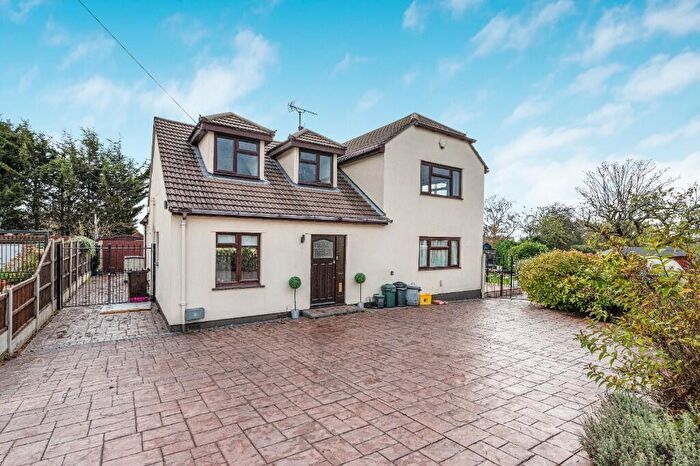
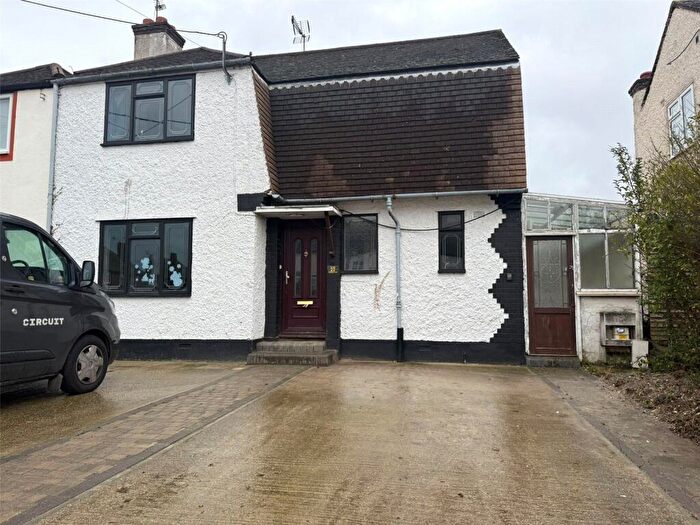
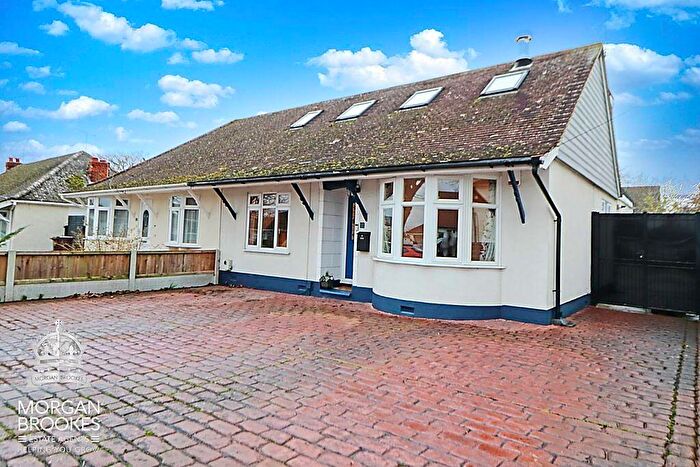
Properties for sale in Appleton
Roads and Postcodes in Appleton
Navigate through our locations to find the location of your next house in Appleton, Benfleet for sale or to rent.
| Streets | Postcodes |
|---|---|
| Albion Road | SS7 5PU |
| Almere | SS7 5PY |
| Avondale Road | SS7 1EH SS7 1EJ |
| Bouldrewood Road | SS7 5UA |
| Bowers Road | SS7 1BH SS7 1BS SS7 5PZ |
| Chestnut Grove | SS7 5RX |
| Clarence Close | SS7 1DG |
| Clarence Road | SS7 1DA SS7 1DB SS7 1DD SS7 1DF |
| Clarence Road North | SS7 1HT |
| Clifton Avenue | SS7 1DH SS7 1DQ SS7 5QG SS7 5QQ SS7 5QU SS7 5RA SS7 5RB |
| Clifton Close | SS7 1DJ |
| Clifton Walk | SS7 1DL |
| Clifton Way | SS7 5QX |
| Croft Close | SS7 5RH |
| Croft Road | SS7 5RL SS7 5RN SS7 5RQ |
| Denesmere | SS7 5QS |
| Dovesgate | SS7 5TA |
| Downer Road | SS7 1BQ SS7 1HX |
| Earleswood | SS7 1DN |
| Eastern Avenue | SS7 5SL |
| Elmhurst Avenue | SS7 5RY |
| Elounda Court | SS7 5QA |
| Felstead Close | SS7 1BX |
| Felstead Road | SS7 1BJ SS7 1BT |
| Field View | SS7 5BY |
| Gifford Road | SS7 5XU SS7 5XX |
| Gleneagles | SS7 5SZ |
| Glenridding | SS7 5XQ |
| Gowan Brae | SS7 5SA |
| Gowan Close | SS7 5SE SS7 5SD |
| Grangewood | SS7 5BW |
| Hatley Gardens | SS7 5SS SS7 5ST |
| Hawthorns | SS7 5QR |
| Herongate | SS7 5SG |
| High Road | SS7 5AL SS7 5RE SS7 5RF SS7 5RG SS7 5RU SS7 5RW SS7 5RZ SS7 5SF SS7 5SU |
| Holtynge | SS7 5QH |
| Homefields Avenue | SS7 5TX SS7 5TY |
| Kale Road | SS7 1HU |
| Kents Hill Road | SS7 5PH SS7 5PJ SS7 5PR SS7 5PS SS7 5PX SS7 5XS SS7 5XT |
| Kimberley Road | SS7 1DR SS7 1DS SS7 5NG SS7 5NH SS7 5NJ SS7 5NL SS7 5NQ |
| Lea Road | SS7 5UU |
| London Road | SS7 1BG SS7 2PF SS7 5SJ SS7 5SQ SS7 5TJ SS7 5TL SS7 5UP SS7 5XR |
| Lynn View Close | SS7 5RJ |
| Malwood Drive | SS7 5TS |
| Malwood Road | SS7 5TZ |
| Martins Mews | SS7 5PQ |
| Merton Close | SS7 5FH |
| Merton Road | SS7 5QJ |
| New Park Road | SS7 5UR SS7 5UT |
| Northern Avenue | SS7 5SN |
| Oakleighs | SS7 5QT |
| Oakwood Close | SS7 5SB |
| Romsey Close | SS7 5UB |
| Romsey Crescent | SS7 5TR |
| Romsey Drive | SS7 5TU |
| Romsey Road | SS7 5TP |
| Romsey Way | SS7 5TT |
| Sapper Ellison Way | SS7 5FG |
| Saxonville | SS7 5TD |
| Silvadene | SS7 5QW |
| South View Road | SS7 5ND SS7 5NE |
| Southcliff | SS7 5QY |
| Southwold Crescent | SS7 5SP SS7 5SR SS7 5SW |
| St Clements Close | SS7 5XF |
| St Clements Crescent | SS7 5XE |
| St Clements Road | SS7 5XA SS7 5XB SS7 5XG SS7 5XH SS7 5XJ |
| Stanway Road | SS7 5UX SS7 5UY |
| Sydney Road | SS7 5RD |
| Tamarisk | SS7 5PW |
| The Chimes | SS7 1HS |
| The Spinnakers | SS7 5RP |
| The Willows | SS7 5RS |
| Thornbridge | SS7 5TB |
| Thundersley Park Road | SS7 1EL SS7 1HP |
| Villa Road | SS7 5PT SS7 5QL |
| Wellingbury | SS7 5RR |
| West Green | SS7 5SX |
| Westwater | SS7 5TE |
| SS7 5FL |
Transport near Appleton
- FAQ
- Price Paid By Year
- Property Type Price
Frequently asked questions about Appleton
What is the average price for a property for sale in Appleton?
The average price for a property for sale in Appleton is £425,176. This amount is 3% higher than the average price in Benfleet. There are 1,876 property listings for sale in Appleton.
What streets have the most expensive properties for sale in Appleton?
The streets with the most expensive properties for sale in Appleton are Thundersley Park Road at an average of £762,500, Sydney Road at an average of £720,000 and Albion Road at an average of £642,000.
What streets have the most affordable properties for sale in Appleton?
The streets with the most affordable properties for sale in Appleton are Clifton Walk at an average of £180,000, Gleneagles at an average of £238,750 and London Road at an average of £243,302.
Which train stations are available in or near Appleton?
Some of the train stations available in or near Appleton are Benfleet, Pitsea and Rayleigh.
Property Price Paid in Appleton by Year
The average sold property price by year was:
| Year | Average Sold Price | Price Change |
Sold Properties
|
|---|---|---|---|
| 2025 | £419,236 | -3% |
75 Properties |
| 2024 | £433,548 | 3% |
104 Properties |
| 2023 | £419,581 | -6% |
76 Properties |
| 2022 | £444,739 | 14% |
91 Properties |
| 2021 | £382,365 | -1% |
162 Properties |
| 2020 | £386,309 | 7% |
102 Properties |
| 2019 | £360,981 | -1% |
108 Properties |
| 2018 | £364,267 | 5% |
94 Properties |
| 2017 | £344,462 | 6% |
100 Properties |
| 2016 | £324,259 | 9% |
103 Properties |
| 2015 | £296,422 | 12% |
95 Properties |
| 2014 | £262,112 | 7% |
132 Properties |
| 2013 | £242,480 | 6% |
106 Properties |
| 2012 | £228,561 | 0,1% |
88 Properties |
| 2011 | £228,395 | -5% |
67 Properties |
| 2010 | £240,726 | 15% |
74 Properties |
| 2009 | £204,021 | -19% |
101 Properties |
| 2008 | £243,024 | 0,2% |
66 Properties |
| 2007 | £242,620 | 8% |
135 Properties |
| 2006 | £222,443 | 5% |
141 Properties |
| 2005 | £211,671 | -0,4% |
137 Properties |
| 2004 | £212,446 | 7% |
127 Properties |
| 2003 | £196,672 | 22% |
130 Properties |
| 2002 | £153,061 | 11% |
148 Properties |
| 2001 | £136,211 | 8% |
150 Properties |
| 2000 | £125,091 | 16% |
159 Properties |
| 1999 | £105,124 | 17% |
173 Properties |
| 1998 | £86,736 | 4% |
119 Properties |
| 1997 | £83,139 | 15% |
177 Properties |
| 1996 | £70,864 | -1% |
128 Properties |
| 1995 | £71,539 | - |
107 Properties |
Property Price per Property Type in Appleton
Here you can find historic sold price data in order to help with your property search.
The average Property Paid Price for specific property types in the last three years are:
| Property Type | Average Sold Price | Sold Properties |
|---|---|---|
| Semi Detached House | £384,432.00 | 119 Semi Detached Houses |
| Detached House | £540,265.00 | 97 Detached Houses |
| Terraced House | £341,026.00 | 19 Terraced Houses |
| Flat | £189,360.00 | 20 Flats |

