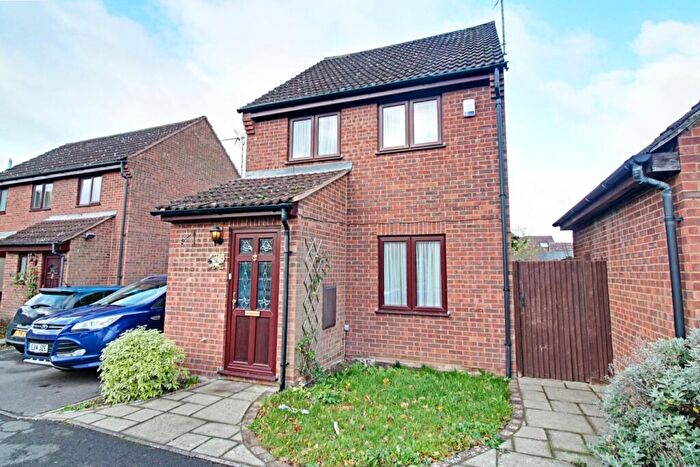
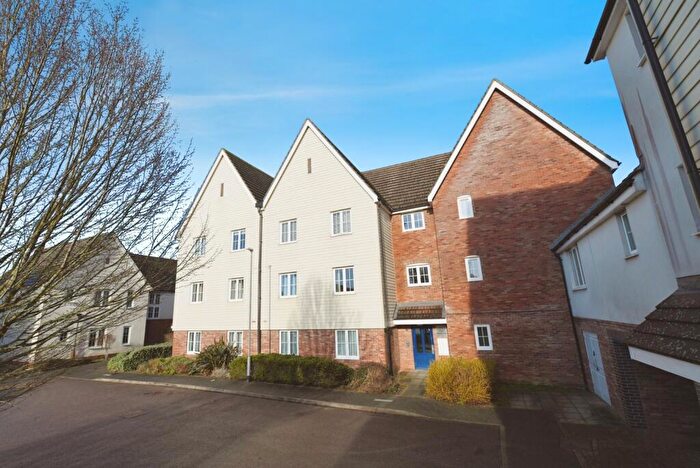
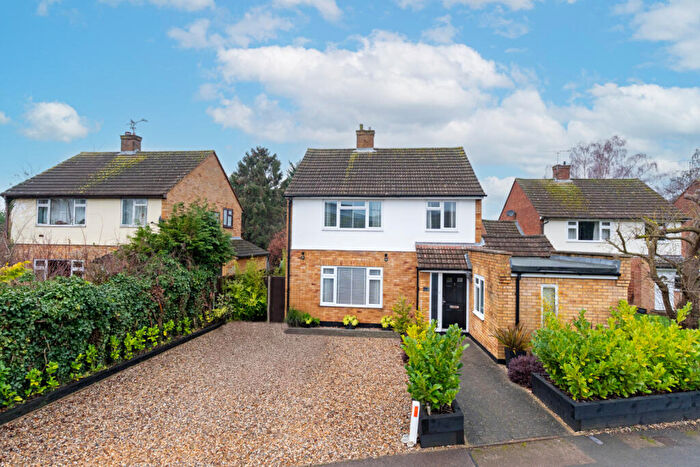
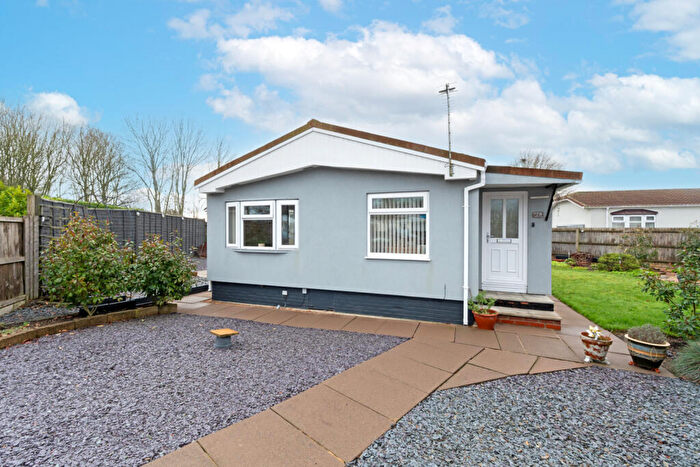
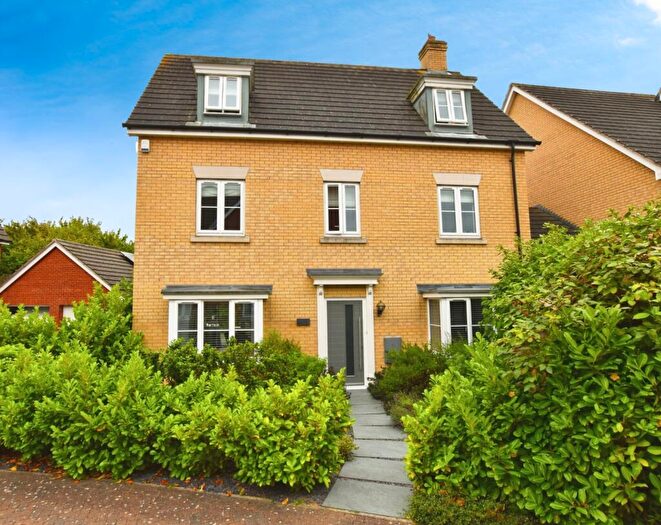
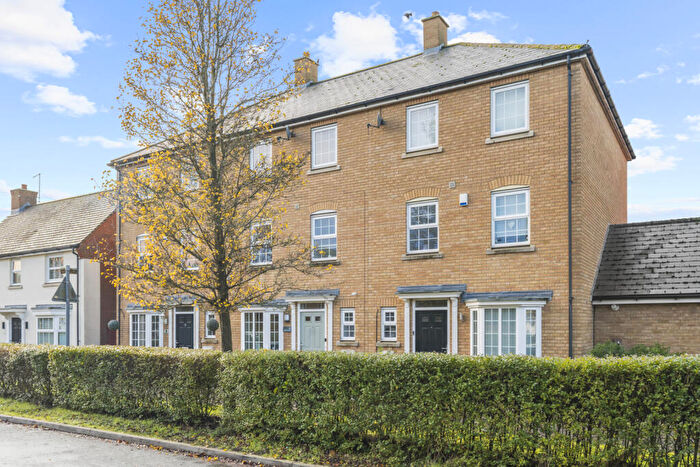
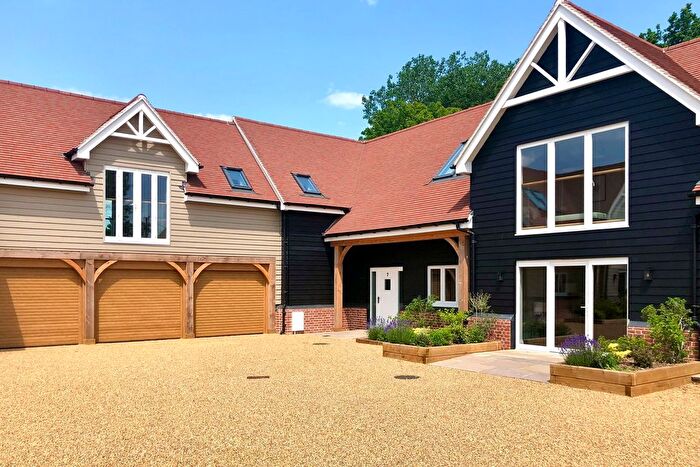
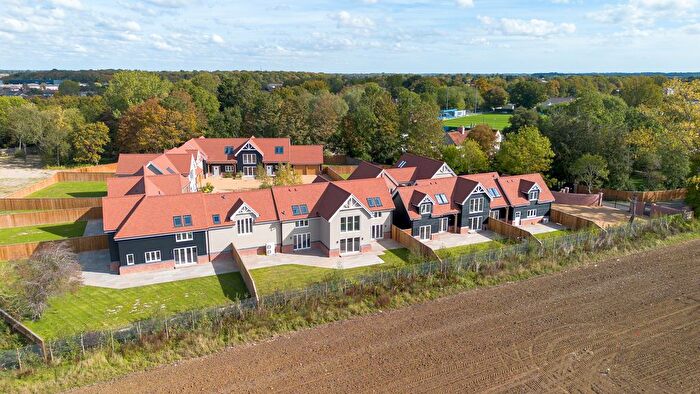
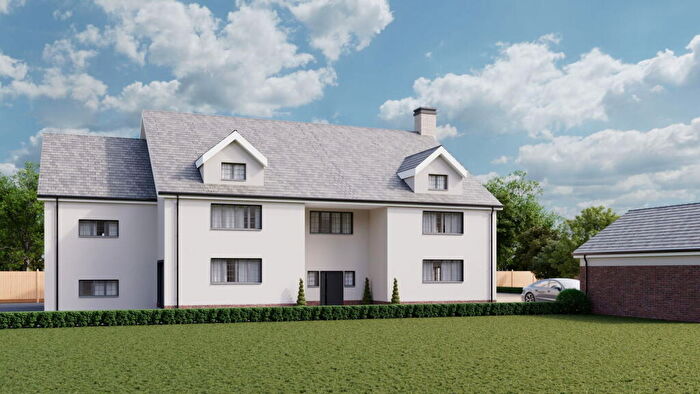
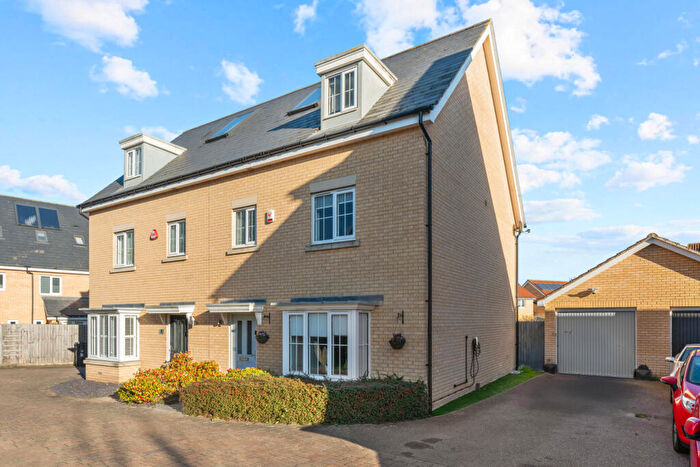
Houses for sale & to rent in Takeley And The Canfields, Bishops Stortford
House Prices in Takeley And The Canfields
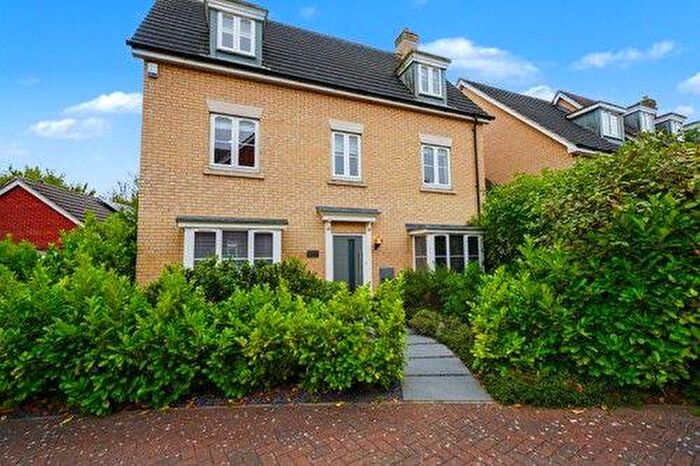
Properties in Takeley And The Canfields have an average house price of £479,636.00 and had 116 Property Transactions within the last 3 years¹.
Takeley And The Canfields is an area in Bishops Stortford, Essex with 1,019 households², where the most expensive property was sold for £1,100,000.00.
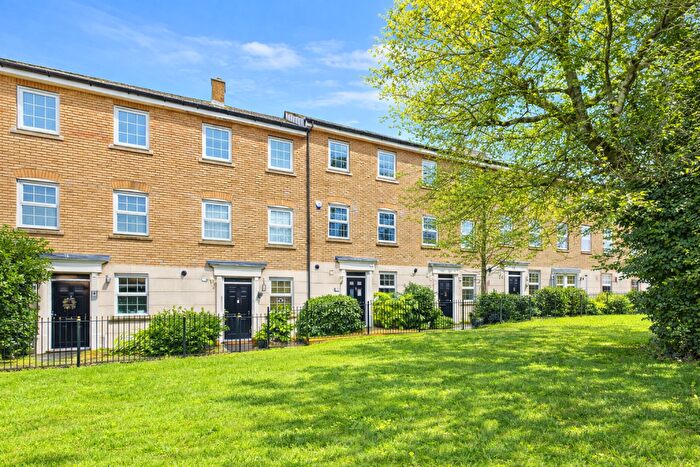
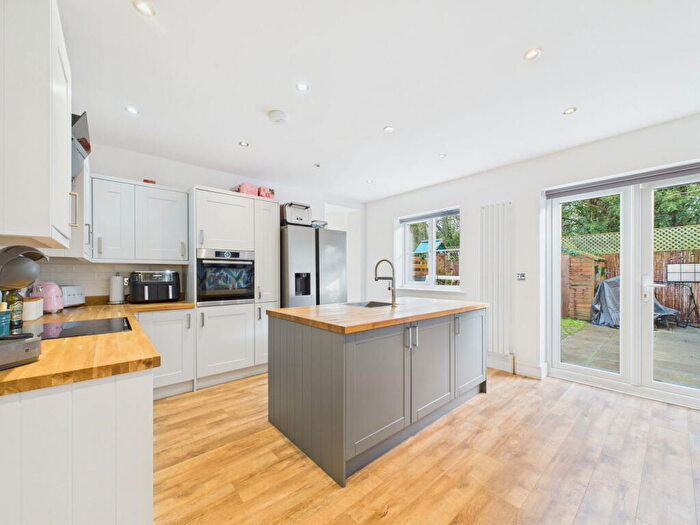
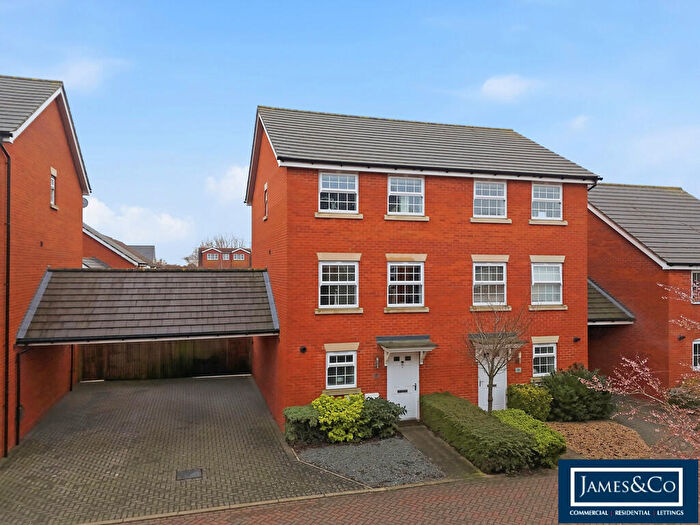
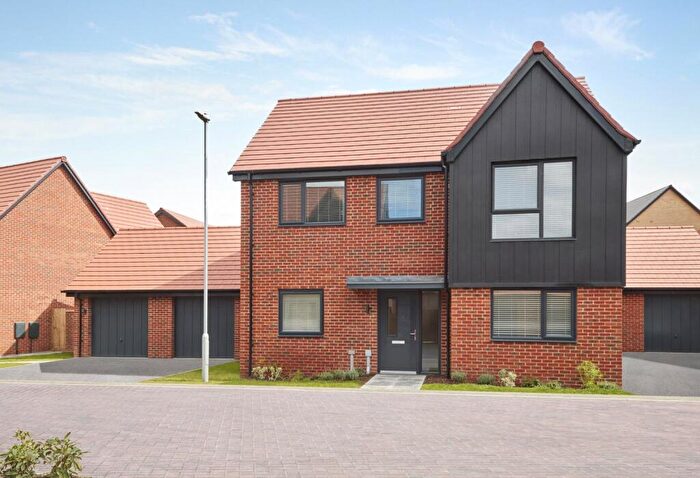
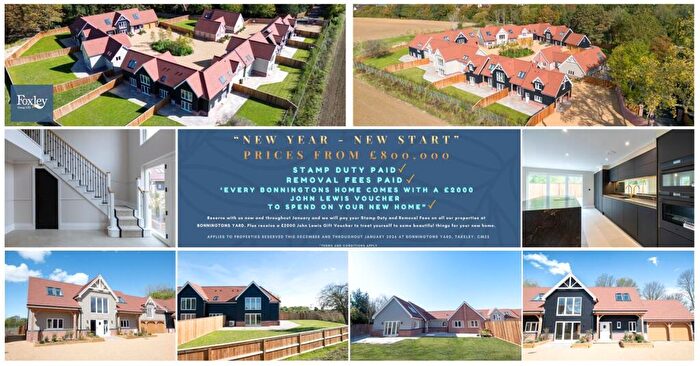
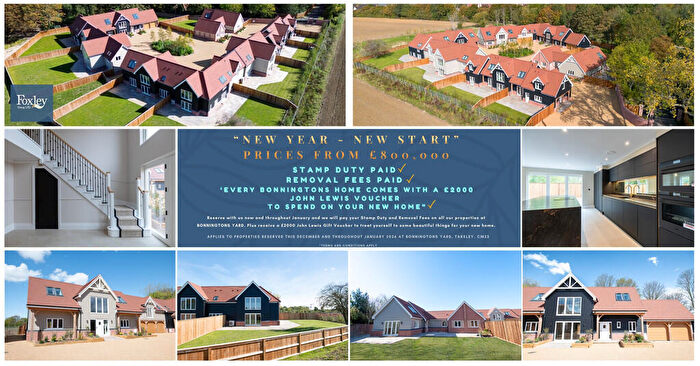
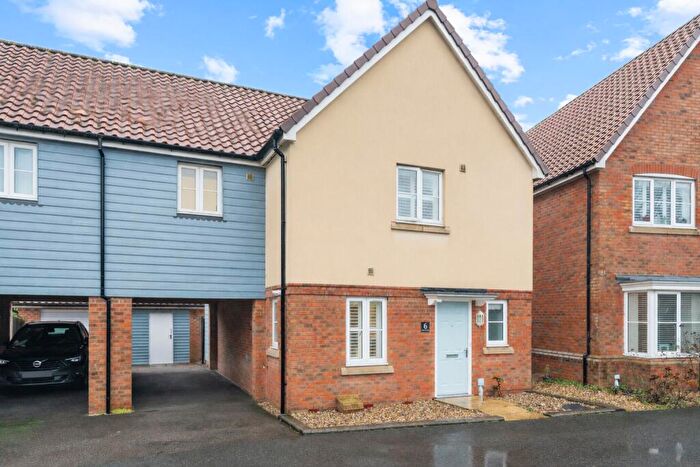
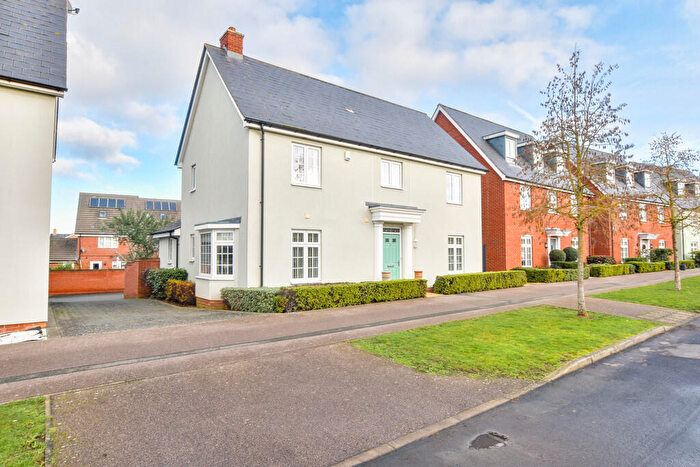
Properties for sale in Takeley And The Canfields
Roads and Postcodes in Takeley And The Canfields
Navigate through our locations to find the location of your next house in Takeley And The Canfields, Bishops Stortford for sale or to rent.
| Streets | Postcodes |
|---|---|
| Bambers Green | CM22 6PD CM22 6PE CM22 6PF |
| Brewers End | CM22 6QH CM22 6QJ CM22 6SA CM22 6SB |
| Broadfield Road | CM22 6SR |
| Bullocks Lane | CM22 6TA |
| Bury Villas | CM22 6PB |
| Bush End | CM22 6NE |
| Canfield Road | CM22 6ST CM22 6SU CM22 6SX CM22 6SY CM22 6SZ |
| Chapel Fields | CM22 6TQ CM22 6TR |
| Chestnut Mews | CM22 6QQ |
| Chestnut Way | CM22 6RW |
| Cooks Hill | CM22 6QG CM22 6QL |
| Coopers Villas | CM22 6PT |
| Dunmow Road | CM22 6SH CM22 6SJ CM22 6SL CM22 6SN CM22 6SP |
| East View | CM22 6RE |
| Easton View | CM22 6PA |
| Elm Close | CM22 6SF |
| Elm Close Extension | CM22 6SE |
| Garnetts | CM22 6RJ CM22 6RL CM22 6RN |
| Gorefeld | CM22 6TL |
| Harvest Fields | CM22 6TS CM22 6TT |
| Hawthorn Close | CM22 6SD |
| Jacks Lane | CM22 6NT |
| Kingfisher Meadow | CM22 6TU |
| Ley Field | CM22 6RS |
| Long Croft | CM22 6RT CM22 6RX |
| Mill End | CM22 6PL |
| Mole Hill Green | CM22 6PH CM22 6PQ |
| Mole Hill Green Cottages | CM22 6PG |
| North Road | CM22 6RF CM22 6RG |
| Orchid Close | CM22 6TN CM22 6TP |
| Parish Way | CM22 6FG |
| Parsonage Road | CM22 6PU CM22 6QX CM22 6RA CM22 6RH |
| Roseacres | CM22 6QY CM22 6QZ |
| Sarahs Walk | CM22 6TB |
| School Lane | CM22 6PJ |
| Smiths Green | CM22 6NR CM22 6NS CM22 6NX |
| South Road | CM22 6RB |
| Southview Villas | CM22 6SW |
| St Valery | CM22 6RY |
| Station Road | CM22 6SG |
| Sycamore Close | CM22 6QA |
| The Pastures | CM22 6TH CM22 6TJ |
| The Street | CM22 6LY CM22 6QB CM22 6QN CM22 6QP CM22 6QR CM22 6QS CM22 6QT CM22 6QU CM22 6QW |
| Warish Hall Road | CM22 6NY CM22 6NZ |
| Warrens Close | CM22 6QD |
| Westwood Mews | CM22 6FE |
Transport near Takeley And The Canfields
- FAQ
- Price Paid By Year
- Property Type Price
Frequently asked questions about Takeley And The Canfields
What is the average price for a property for sale in Takeley And The Canfields?
The average price for a property for sale in Takeley And The Canfields is £479,636. This amount is 13% lower than the average price in Bishops Stortford. There are 1,077 property listings for sale in Takeley And The Canfields.
What streets have the most expensive properties for sale in Takeley And The Canfields?
The streets with the most expensive properties for sale in Takeley And The Canfields are Bullocks Lane at an average of £854,000, Canfield Road at an average of £820,833 and Dunmow Road at an average of £707,729.
What streets have the most affordable properties for sale in Takeley And The Canfields?
The streets with the most affordable properties for sale in Takeley And The Canfields are North Road at an average of £277,500, Coopers Villas at an average of £313,875 and Sycamore Close at an average of £335,000.
Which train stations are available in or near Takeley And The Canfields?
Some of the train stations available in or near Takeley And The Canfields are Stansted Airport, Stansted Mountfitchet and Elsenham.
Property Price Paid in Takeley And The Canfields by Year
The average sold property price by year was:
| Year | Average Sold Price | Price Change |
Sold Properties
|
|---|---|---|---|
| 2025 | £482,825 | -1% |
23 Properties |
| 2024 | £489,249 | 5% |
54 Properties |
| 2023 | £464,443 | -15% |
39 Properties |
| 2022 | £534,140 | 10% |
42 Properties |
| 2021 | £483,030 | 14% |
58 Properties |
| 2020 | £414,203 | 2% |
32 Properties |
| 2019 | £403,948 | -8% |
39 Properties |
| 2018 | £435,478 | 3% |
46 Properties |
| 2017 | £420,247 | 7% |
65 Properties |
| 2016 | £389,799 | 7% |
52 Properties |
| 2015 | £362,557 | 19% |
44 Properties |
| 2014 | £292,755 | 3% |
35 Properties |
| 2013 | £283,840 | -11% |
44 Properties |
| 2012 | £316,082 | 21% |
45 Properties |
| 2011 | £248,811 | -29% |
35 Properties |
| 2010 | £322,195 | 4% |
54 Properties |
| 2009 | £310,780 | -9% |
53 Properties |
| 2008 | £339,686 | -2% |
37 Properties |
| 2007 | £345,068 | 13% |
84 Properties |
| 2006 | £298,855 | -8% |
90 Properties |
| 2005 | £322,184 | 6% |
65 Properties |
| 2004 | £303,884 | 21% |
65 Properties |
| 2003 | £240,083 | 0,1% |
47 Properties |
| 2002 | £239,940 | 16% |
33 Properties |
| 2001 | £200,778 | 21% |
52 Properties |
| 2000 | £158,540 | 27% |
37 Properties |
| 1999 | £116,094 | -14% |
49 Properties |
| 1998 | £131,797 | 6% |
50 Properties |
| 1997 | £123,522 | 23% |
38 Properties |
| 1996 | £94,675 | 8% |
50 Properties |
| 1995 | £86,671 | - |
26 Properties |
Property Price per Property Type in Takeley And The Canfields
Here you can find historic sold price data in order to help with your property search.
The average Property Paid Price for specific property types in the last three years are:
| Property Type | Average Sold Price | Sold Properties |
|---|---|---|
| Semi Detached House | £394,080.00 | 35 Semi Detached Houses |
| Detached House | £591,648.00 | 57 Detached Houses |
| Terraced House | £338,375.00 | 24 Terraced Houses |

