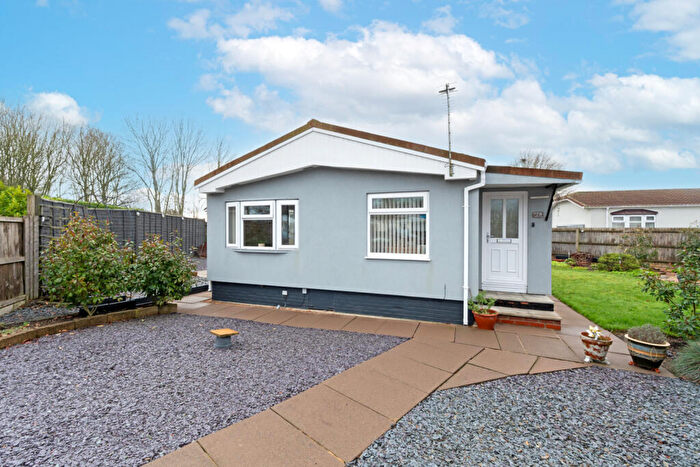
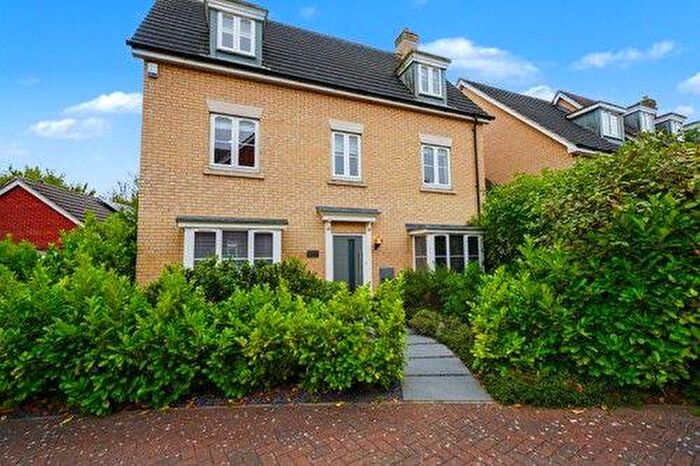
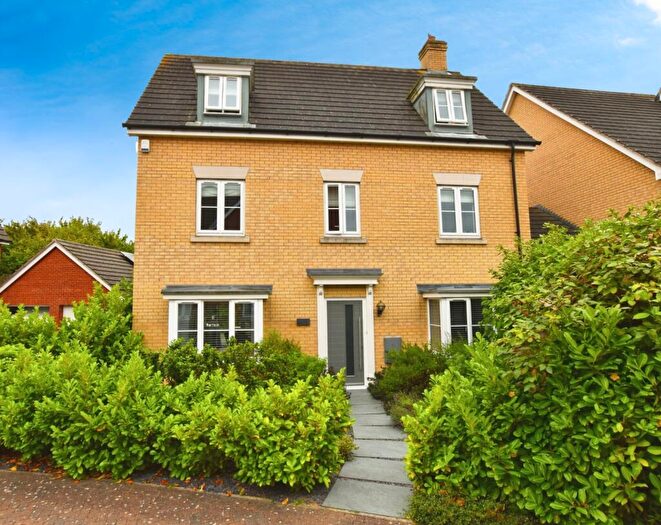
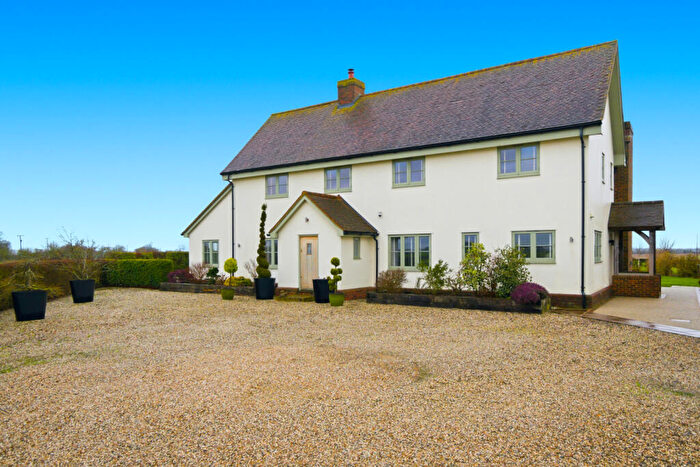
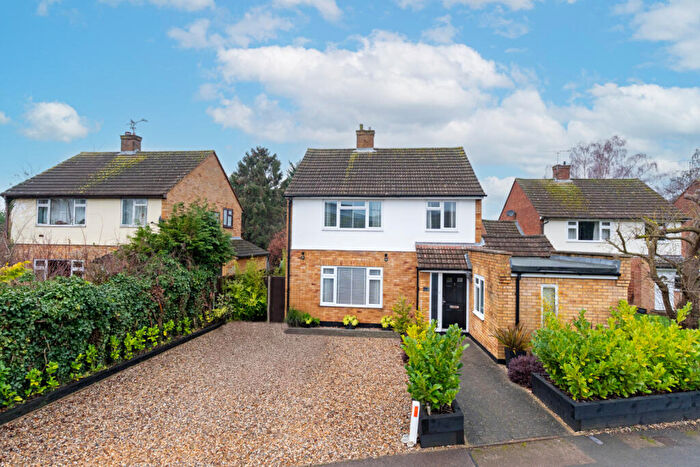
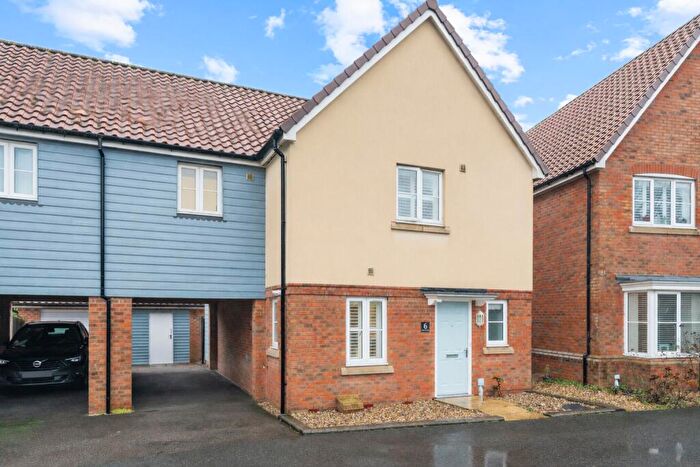
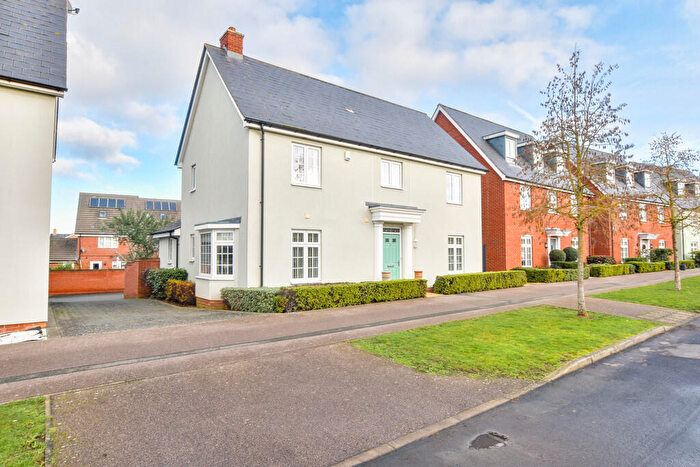
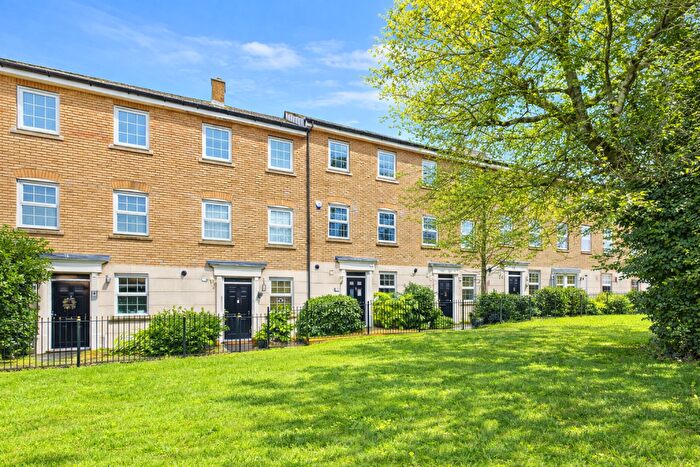
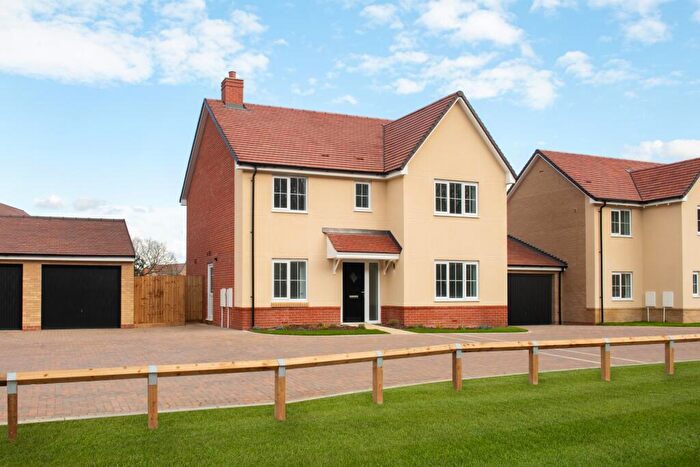
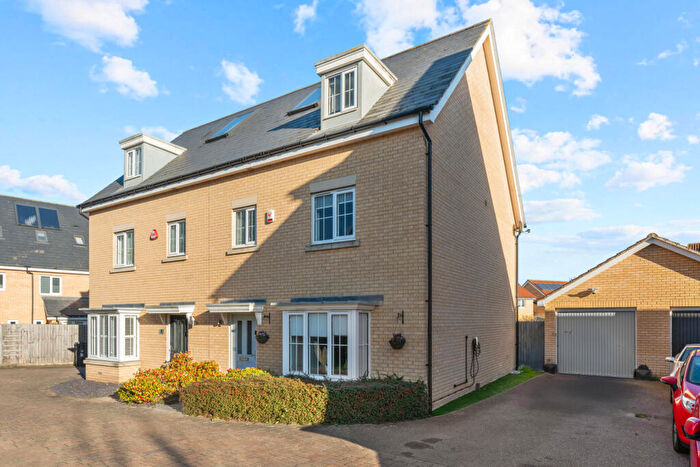
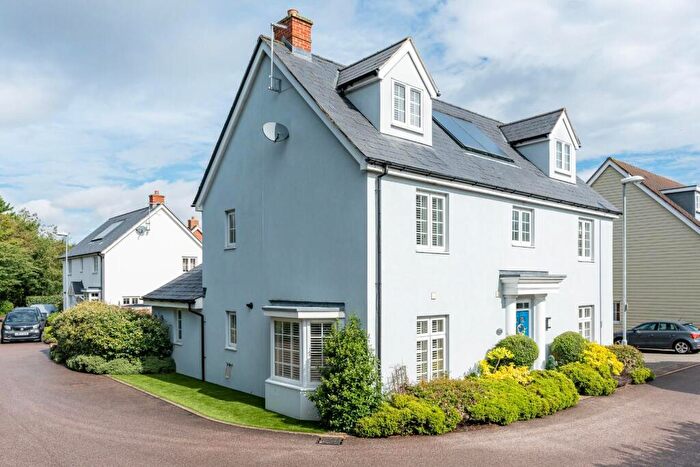
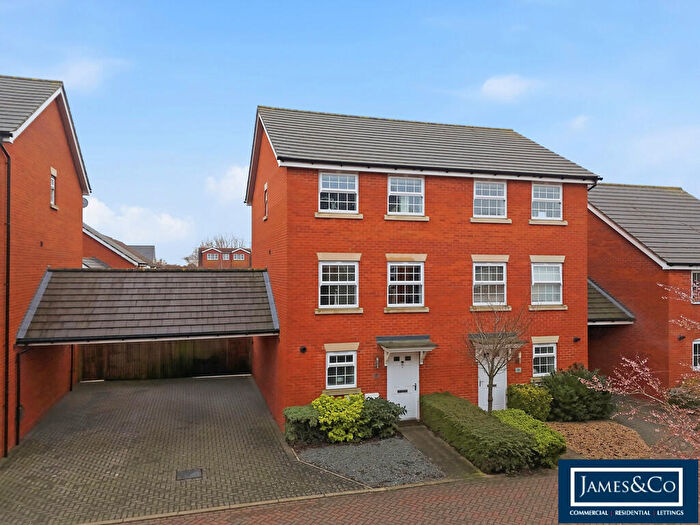
Houses for sale & to rent in Takeley And The Canfields, Dunmow
House Prices in Takeley And The Canfields
Properties in Takeley And The Canfields have an average house price of £505,180.00 and had 88 Property Transactions within the last 3 years¹.
Takeley And The Canfields is an area in Dunmow, Essex with 627 households², where the most expensive property was sold for £1,760,000.00.
Properties for sale in Takeley And The Canfields
Roads and Postcodes in Takeley And The Canfields
Navigate through our locations to find the location of your next house in Takeley And The Canfields, Dunmow for sale or to rent.
| Streets | Postcodes |
|---|---|
| Bacon End | CM6 1JW |
| Badgers | CM6 1JR |
| Barnard Close | CM6 1ZB |
| Buckland Mews | CM6 1XT |
| Burgattes Road | CM6 1FW |
| Cawbeck Road | CM6 1FY |
| Champneys Way | CM6 1FN |
| Chapmans Close | CM6 1GD |
| Church End | CM6 1JT |
| Church Lane | CM6 1SU |
| Clarendon Road | CM6 1GA CM6 1TJ |
| Colemans Close | CM6 1TS |
| Cuckoo Lane | CM6 1LB |
| Dryvers Close | CM6 1FD |
| Dunmow Road | CM6 1TA |
| Farmer Close | CM6 1HX |
| Fleming Road | CM6 1GH |
| Garden Drive | CM6 1HA |
| Garrett Road | CM6 1PN |
| Gaynsford Place | CM6 1WB |
| Gilders Road | CM6 1UY |
| Goodwins Close | CM6 1SQ |
| Green Street | CM6 1LA CM6 1LE |
| Haddesley Road | CM6 1FB |
| Hamilton Road | CM6 1SY |
| Hampton Road | CM6 1FZ |
| High Cross Lane | CM6 1TB |
| High Cross Villas | CM6 1TD |
| Honey Road | CM6 1FF |
| Hubberd Road | CM6 1GW |
| Loveden Way | CM6 1GS |
| Marsh Lane | CM6 1JX |
| Marshalls Way | CM6 1SA |
| Middle Barn Villas | CM6 1JP |
| Mill Court | CM6 1ST |
| Mortymer Close | CM6 1FQ |
| Mountford Close | CM6 1XY |
| Newman Road | CM6 1GR |
| Parker Way | CM6 1GT |
| Ramsey Drive | CM6 1FT |
| Roding Drive | CM6 1FE CM6 1YE |
| Rumbles Way | CM6 1FA |
| Saffron Way | CM6 1HF |
| Speller Way | CM6 1GX |
| Stokes Road | CM6 1FG |
| Stortford Road | CM6 1SL CM6 1SN CM6 1SR CM6 1SS CM6 1SW |
| The Croft | CM6 1YD |
| Thornton Road | CM6 1SX |
| Warwick Road | CM6 1GB |
| Windmill Villas | CM6 1TQ |
| Wintershutt Road | CM6 1GE |
| Wyndrell Close | CM6 1FJ |
| CM6 1JU CM6 1JZ CM6 1LD CM6 1LF |
Transport near Takeley And The Canfields
- FAQ
- Price Paid By Year
- Property Type Price
Frequently asked questions about Takeley And The Canfields
What is the average price for a property for sale in Takeley And The Canfields?
The average price for a property for sale in Takeley And The Canfields is £505,180. This amount is 2% higher than the average price in Dunmow. There are 954 property listings for sale in Takeley And The Canfields.
What streets have the most expensive properties for sale in Takeley And The Canfields?
The streets with the most expensive properties for sale in Takeley And The Canfields are Middle Barn Villas at an average of £1,330,000, Church End at an average of £785,300 and Barnard Close at an average of £700,000.
What streets have the most affordable properties for sale in Takeley And The Canfields?
The streets with the most affordable properties for sale in Takeley And The Canfields are Mortymer Close at an average of £156,298, Ramsey Drive at an average of £157,740 and The Croft at an average of £308,250.
Which train stations are available in or near Takeley And The Canfields?
Some of the train stations available in or near Takeley And The Canfields are Stansted Airport, Stansted Mountfitchet and Elsenham.
Property Price Paid in Takeley And The Canfields by Year
The average sold property price by year was:
| Year | Average Sold Price | Price Change |
Sold Properties
|
|---|---|---|---|
| 2025 | £532,205 | 5% |
30 Properties |
| 2024 | £503,575 | 6% |
33 Properties |
| 2023 | £474,868 | -4% |
25 Properties |
| 2022 | £493,299 | 7% |
50 Properties |
| 2021 | £457,926 | 2% |
61 Properties |
| 2020 | £447,328 | 14% |
38 Properties |
| 2019 | £386,860 | -11% |
50 Properties |
| 2018 | £428,373 | 2% |
67 Properties |
| 2017 | £419,783 | -1% |
60 Properties |
| 2016 | £423,219 | 13% |
61 Properties |
| 2015 | £367,088 | - |
61 Properties |
| 2014 | £367,194 | 8% |
65 Properties |
| 2013 | £339,308 | 11% |
140 Properties |
| 2012 | £300,392 | -4% |
99 Properties |
| 2011 | £312,215 | -8% |
96 Properties |
| 2010 | £338,537 | 13% |
96 Properties |
| 2009 | £293,293 | -5% |
96 Properties |
| 2008 | £306,845 | 3% |
120 Properties |
| 2007 | £299,170 | -139% |
51 Properties |
| 2006 | £715,166 | 8% |
6 Properties |
| 2005 | £659,750 | 30% |
8 Properties |
| 2004 | £459,166 | 11% |
9 Properties |
| 2003 | £407,714 | -12% |
7 Properties |
| 2002 | £454,957 | 39% |
5 Properties |
| 2001 | £279,166 | 49% |
6 Properties |
| 2000 | £142,142 | -62% |
7 Properties |
| 1999 | £229,883 | 7% |
9 Properties |
| 1998 | £213,333 | 33% |
9 Properties |
| 1997 | £143,075 | 2% |
6 Properties |
| 1996 | £140,643 | -30% |
8 Properties |
| 1995 | £183,000 | - |
7 Properties |
Property Price per Property Type in Takeley And The Canfields
Here you can find historic sold price data in order to help with your property search.
The average Property Paid Price for specific property types in the last three years are:
| Property Type | Average Sold Price | Sold Properties |
|---|---|---|
| Semi Detached House | £429,166.00 | 27 Semi Detached Houses |
| Detached House | £684,021.00 | 33 Detached Houses |
| Terraced House | £375,479.00 | 27 Terraced Houses |
| Flat | £157,740.00 | 1 Flat |

