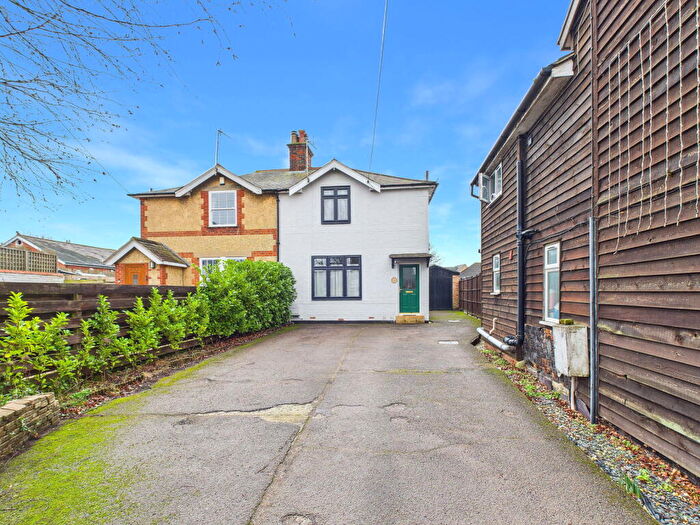
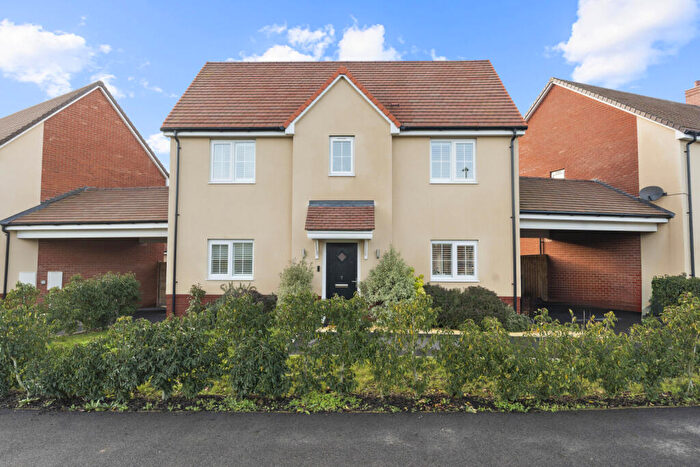
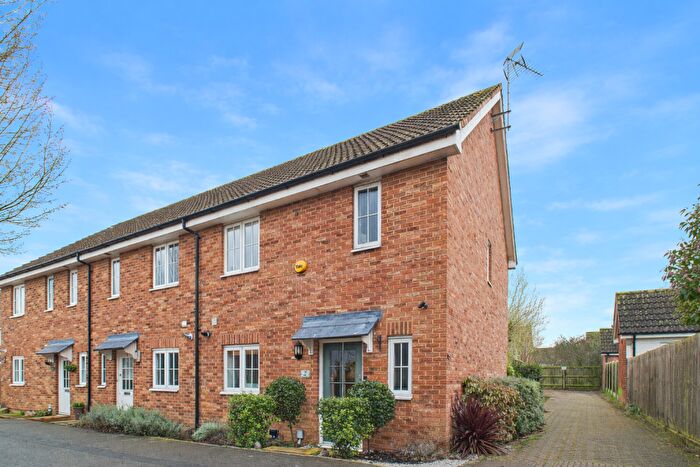
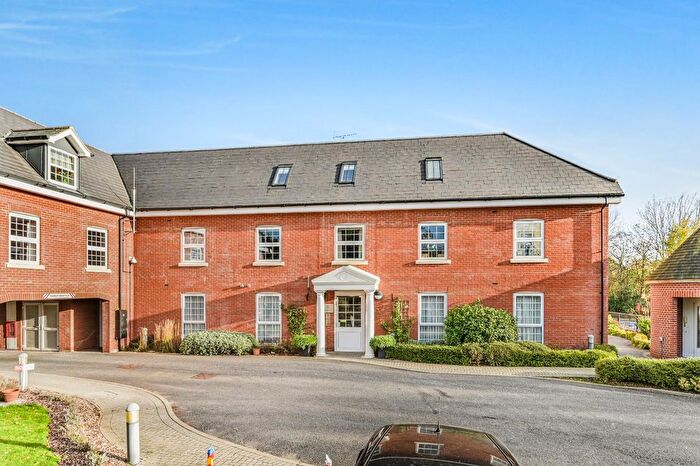
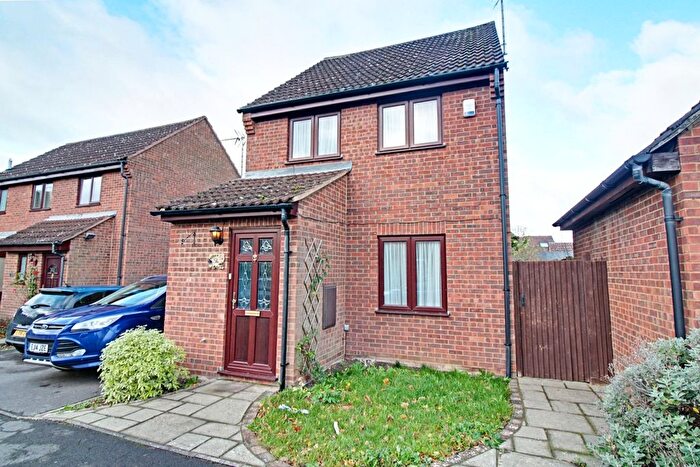
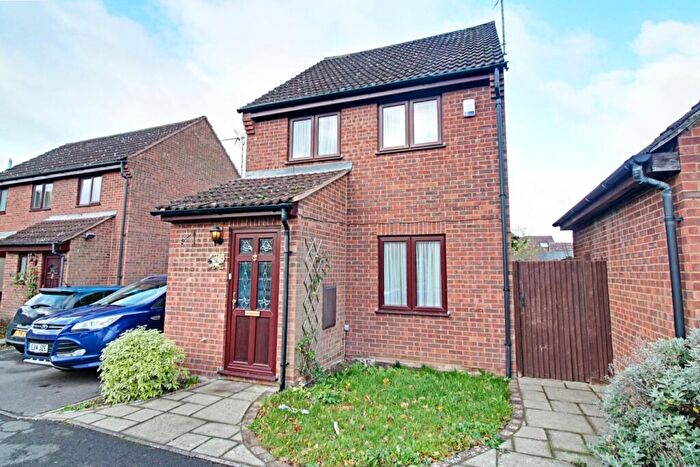
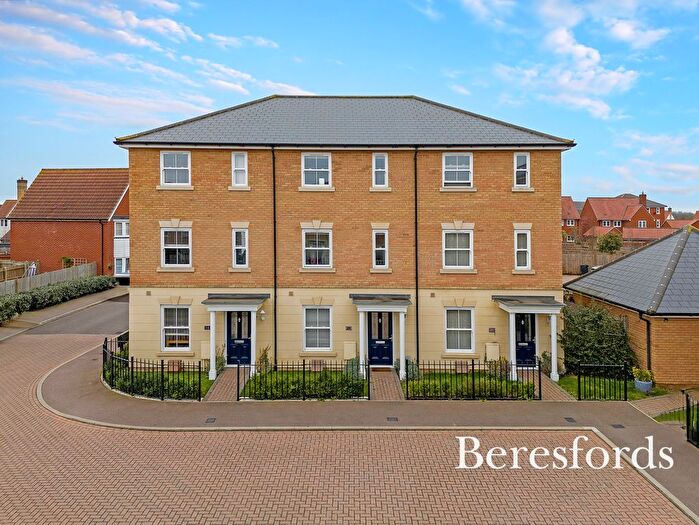
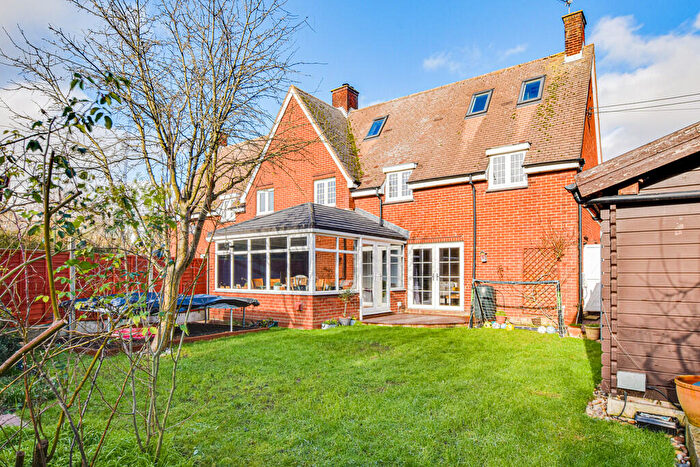
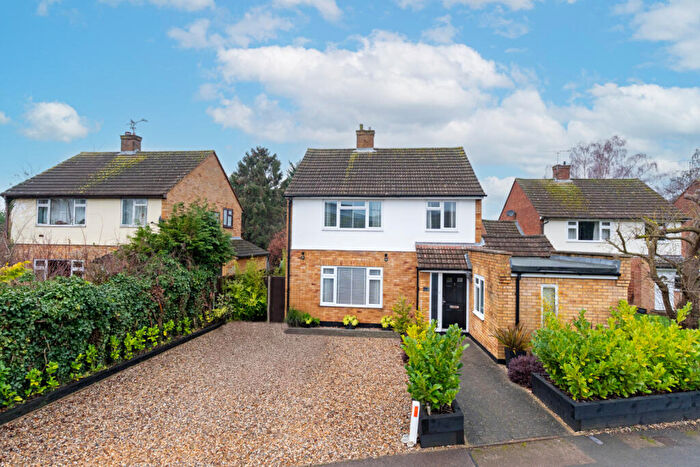
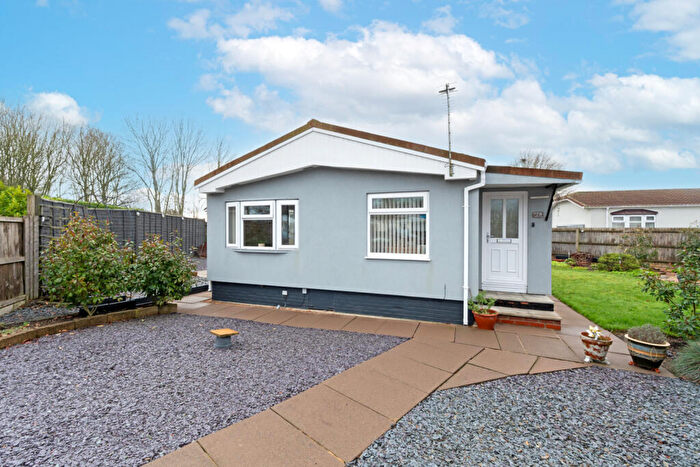
Houses for sale & to rent in Takeley, Dunmow
House Prices in Takeley
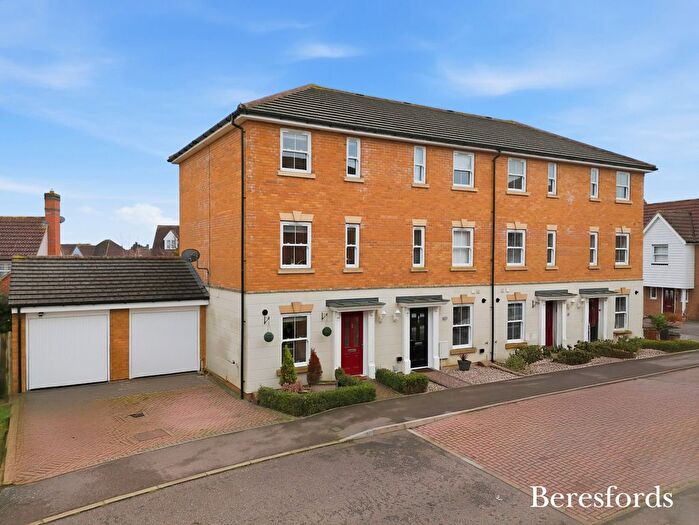
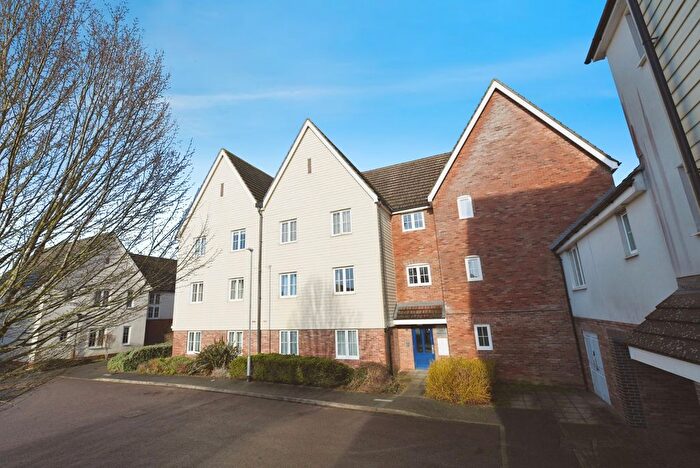
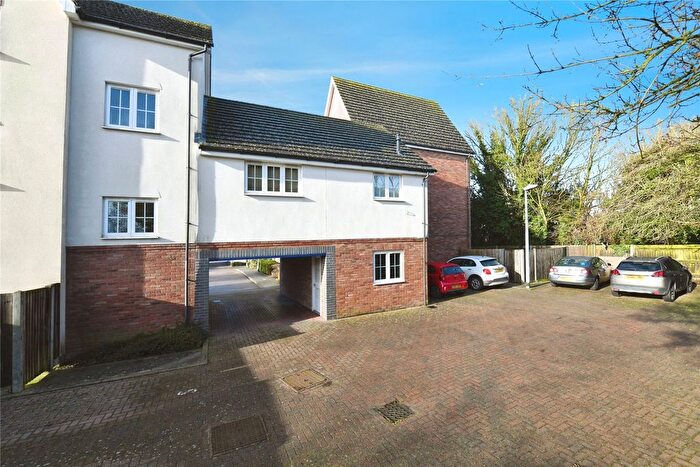
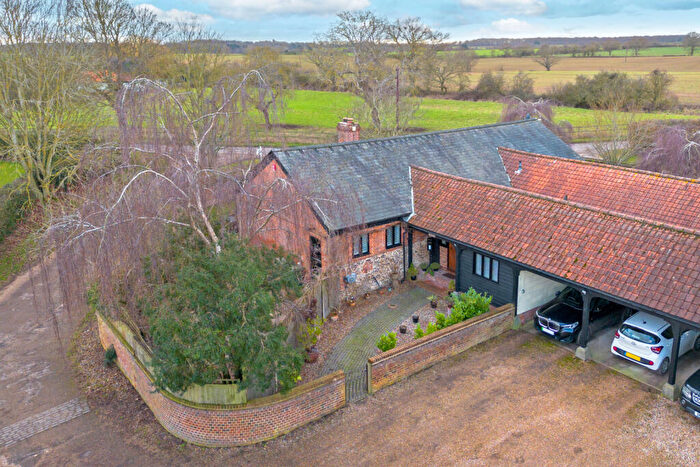
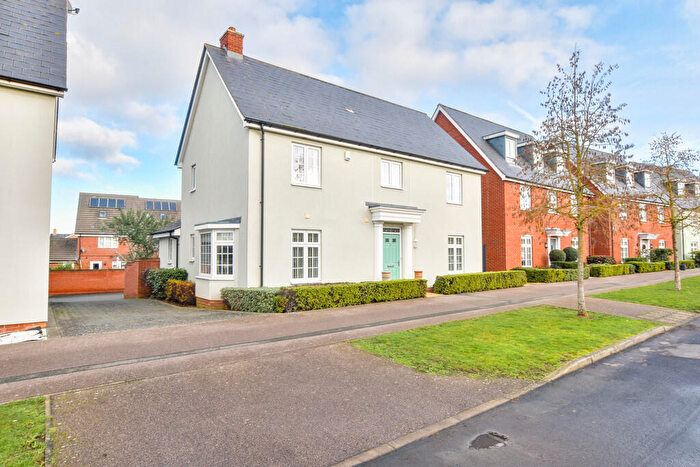
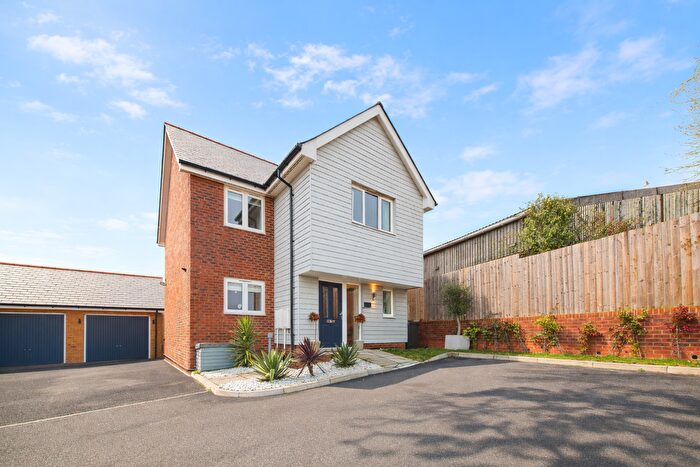
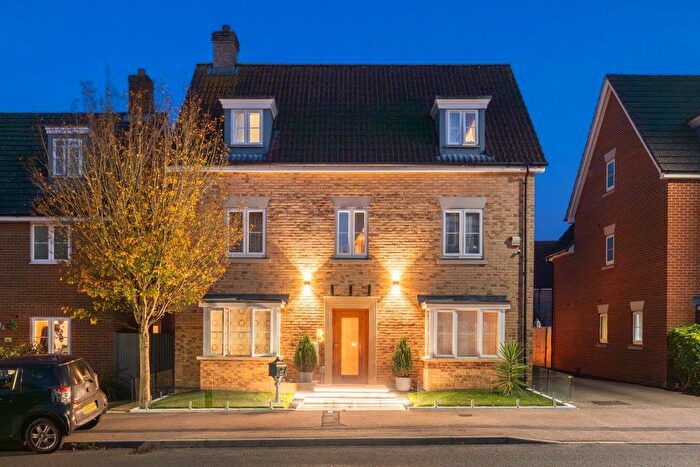
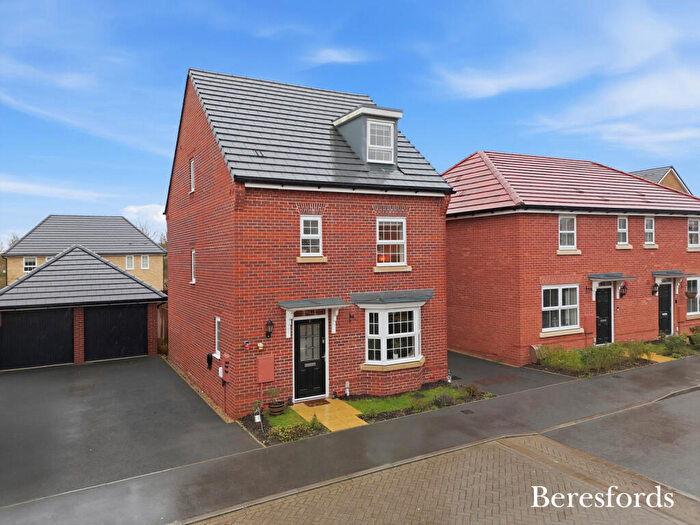
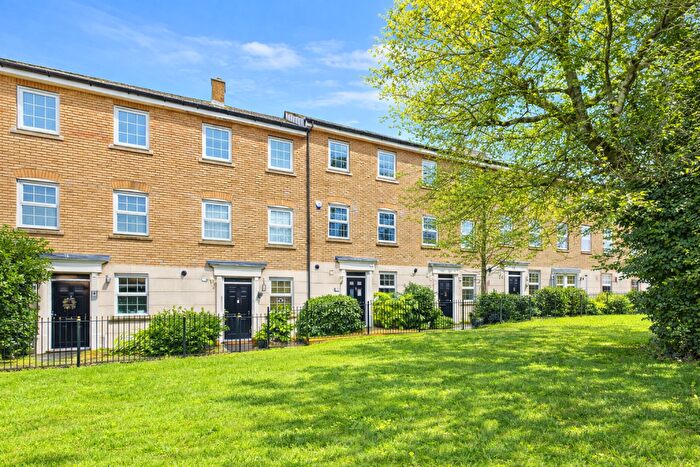
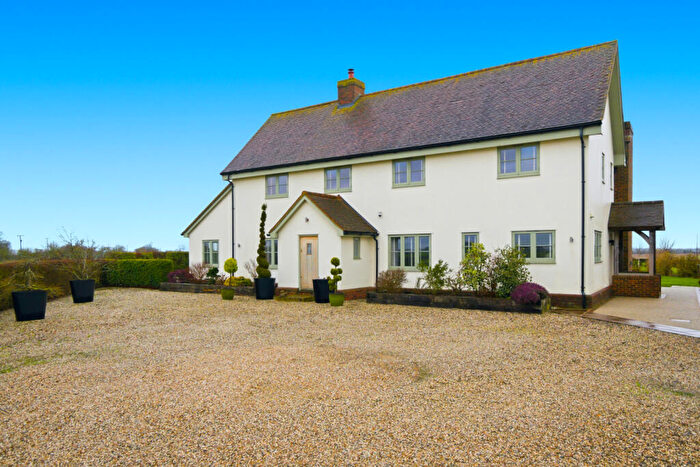
Properties in Takeley have an average house price of £498,772.00 and had 11 Property Transactions within the last 3 years¹.
Takeley is an area in Dunmow, Essex with 24 households², where the most expensive property was sold for £788,500.00.
Properties for sale in Takeley
Roads and Postcodes in Takeley
Navigate through our locations to find the location of your next house in Takeley, Dunmow for sale or to rent.
| Streets | Postcodes |
|---|---|
| Anderson Grove | CM6 1AR |
| Brick End | CM6 2BP |
| Broxted Hill | CM6 2EP |
| Buttercup Close | CM6 4AJ |
| Clover Drive | CM6 4AH |
| Common Lane | CM6 2ES |
| Flitchside Drive | CM6 4AA |
| Foxwood Gardens | CM6 1DD |
| Hamilton Road | CM6 1FU |
| High Cross Lane | CM6 1TE CM6 1TF CM6 1TG |
| Park Lane | CM6 1XR |
| Priors Green Local Centre | CM6 1HE |
| St Marys Mews | CM6 2GQ |
| Turner Close | CM6 4AB |
| Walnut Close | CM6 1JY |
| Warwick Road | CM6 1SZ |
| CM6 1SP CM6 1TH CM6 2DA CM6 2EL |
Transport near Takeley
- FAQ
- Price Paid By Year
- Property Type Price
Frequently asked questions about Takeley
What is the average price for a property for sale in Takeley?
The average price for a property for sale in Takeley is £498,772. This amount is 0.81% higher than the average price in Dunmow. There are 2,413 property listings for sale in Takeley.
What streets have the most expensive properties for sale in Takeley?
The streets with the most expensive properties for sale in Takeley are Foxwood Gardens at an average of £725,500, Flitchside Drive at an average of £470,000 and Walnut Close at an average of £446,500.
What streets have the most affordable properties for sale in Takeley?
The streets with the most affordable properties for sale in Takeley are Clover Drive at an average of £350,000 and Hamilton Road at an average of £445,000.
Which train stations are available in or near Takeley?
Some of the train stations available in or near Takeley are Stansted Airport, Elsenham and Stansted Mountfitchet.
Property Price Paid in Takeley by Year
The average sold property price by year was:
| Year | Average Sold Price | Price Change |
Sold Properties
|
|---|---|---|---|
| 2025 | £394,333 | -48% |
3 Properties |
| 2024 | £582,833 | 12% |
3 Properties |
| 2023 | £511,000 | -39% |
5 Properties |
| 2022 | £709,642 | 27% |
7 Properties |
| 2021 | £515,056 | -2% |
11 Properties |
| 2020 | £526,109 | -8% |
10 Properties |
| 2019 | £569,000 | 23% |
5 Properties |
| 2018 | £439,166 | -28% |
15 Properties |
| 2017 | £563,318 | 24% |
22 Properties |
| 2016 | £425,668 | 4% |
32 Properties |
| 2015 | £406,682 | -9% |
26 Properties |
| 2014 | £443,750 | 15% |
8 Properties |
| 2013 | £375,000 | -41% |
1 Property |
| 2012 | £530,000 | 69% |
1 Property |
| 2001 | £165,000 | - |
1 Property |
Property Price per Property Type in Takeley
Here you can find historic sold price data in order to help with your property search.
The average Property Paid Price for specific property types in the last three years are:
| Property Type | Average Sold Price | Sold Properties |
|---|---|---|
| Semi Detached House | £469,166.00 | 3 Semi Detached Houses |
| Terraced House | £397,500.00 | 2 Terraced Houses |
| Detached House | £547,333.00 | 6 Detached Houses |

