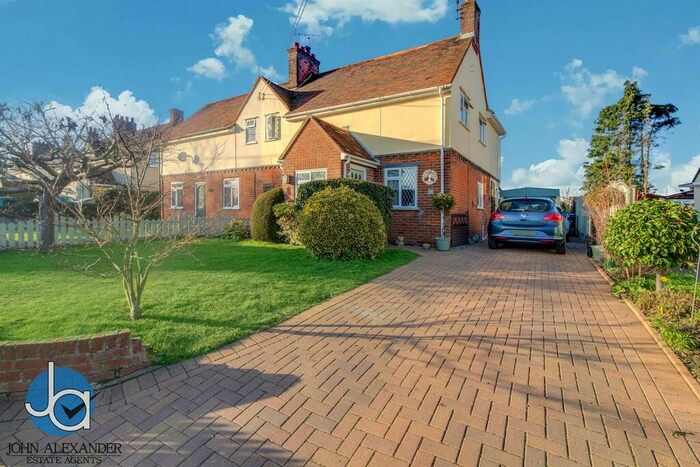
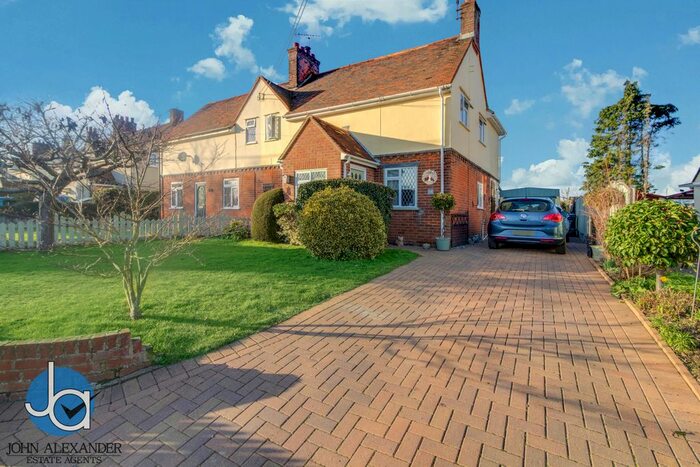
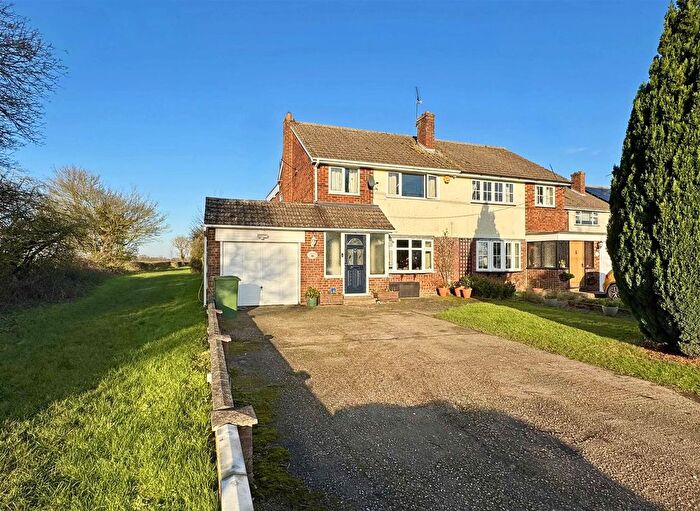
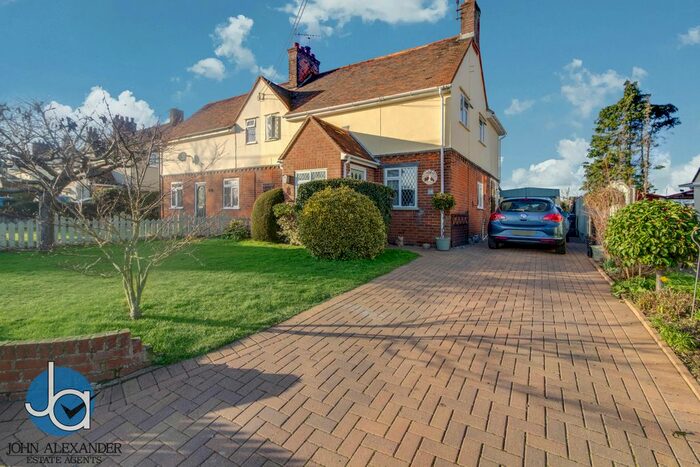
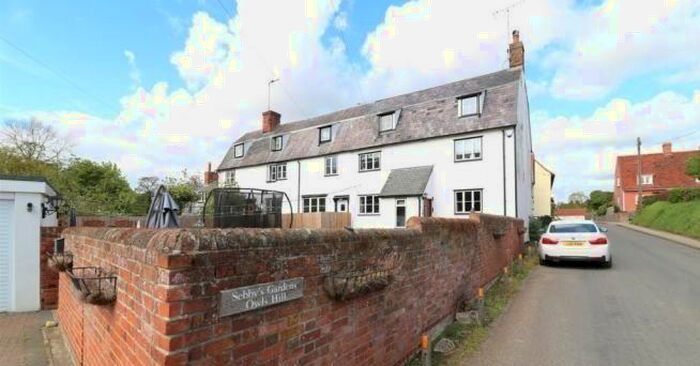
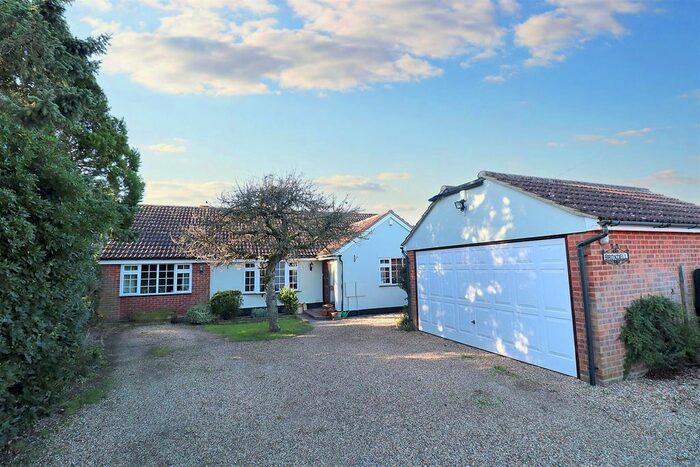
Houses for sale & to rent in Black Notley And Terling, Chelmsford
House Prices in Black Notley And Terling
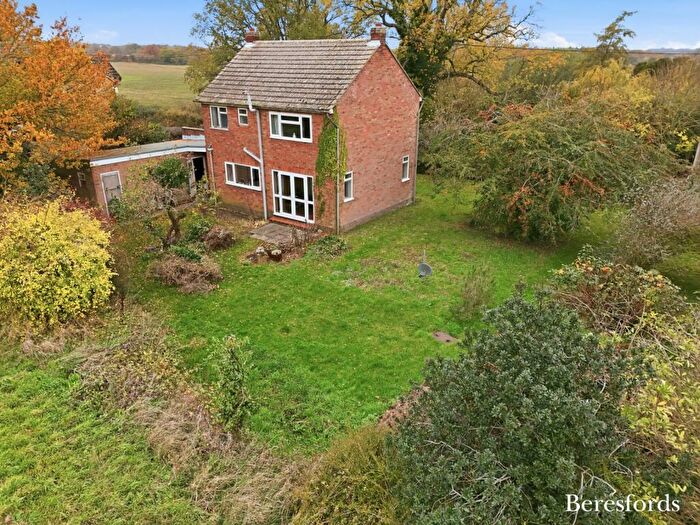
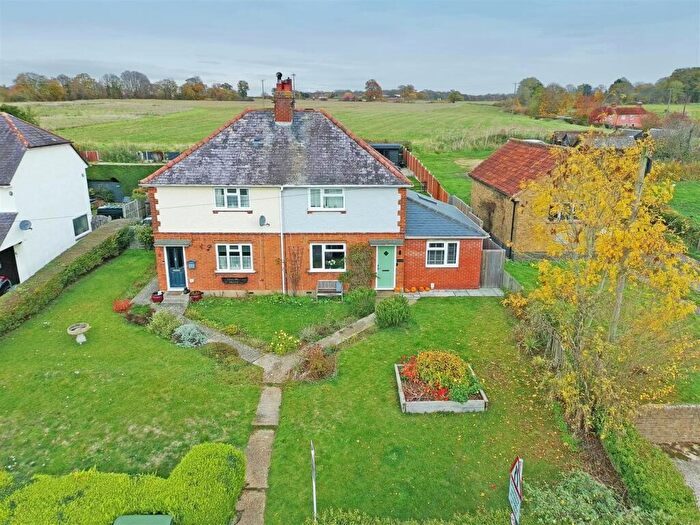
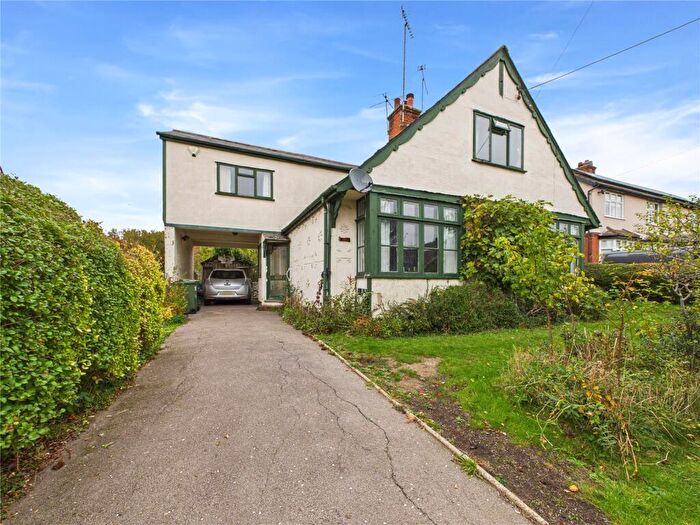
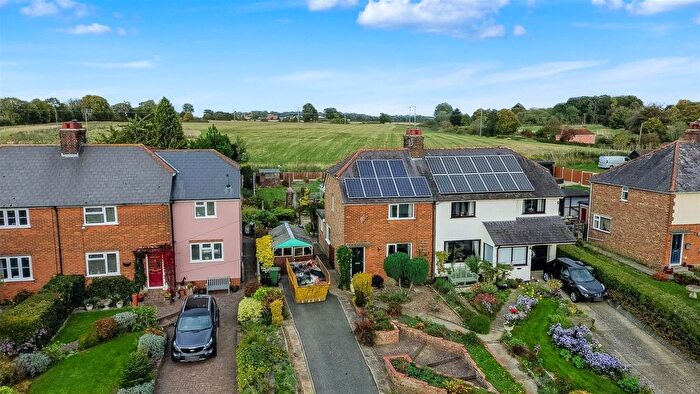
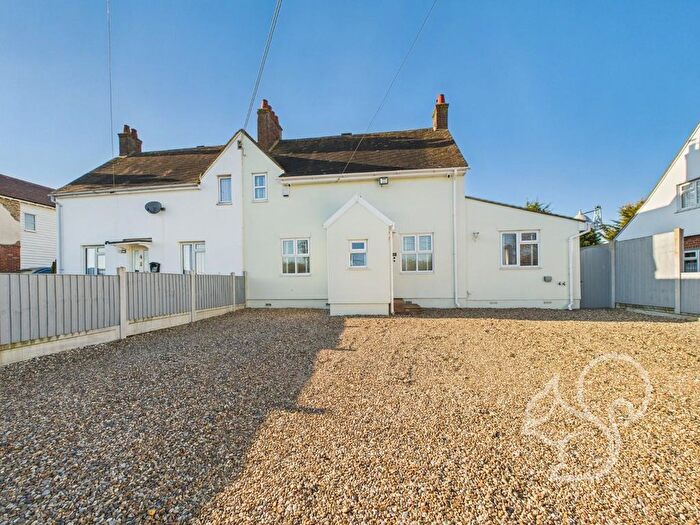
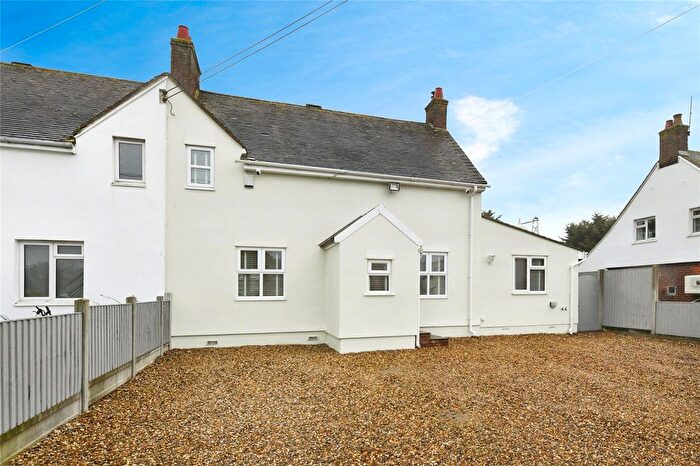
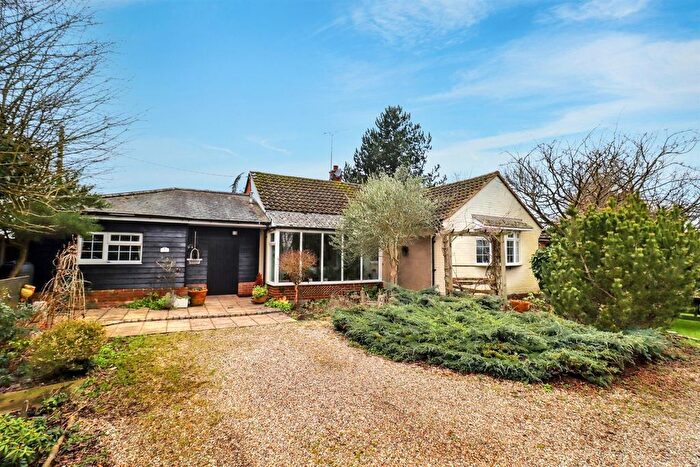
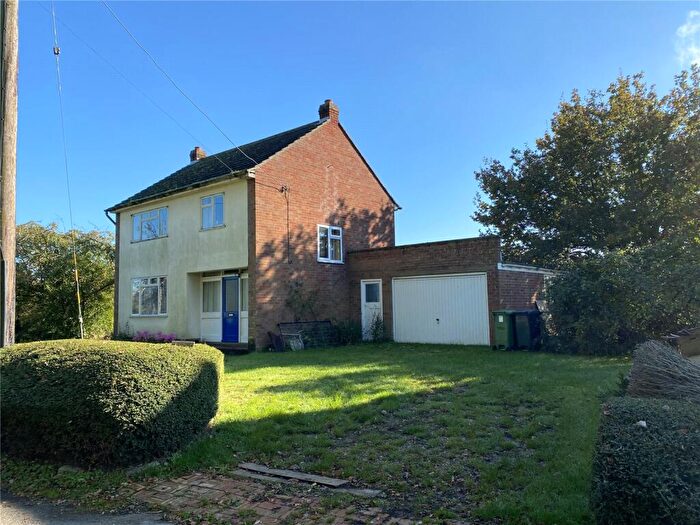
Properties in Black Notley And Terling have an average house price of £635,875.00 and had 20 Property Transactions within the last 3 years¹.
Black Notley And Terling is an area in Chelmsford, Essex with 294 households², where the most expensive property was sold for £1,125,000.00.
Properties for sale in Black Notley And Terling
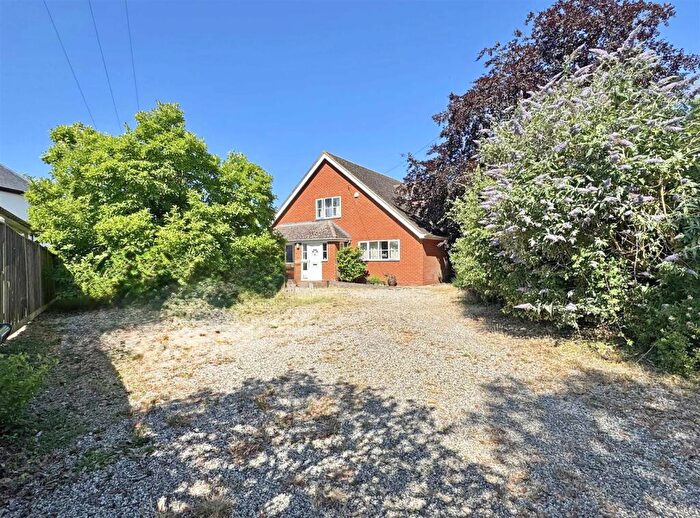
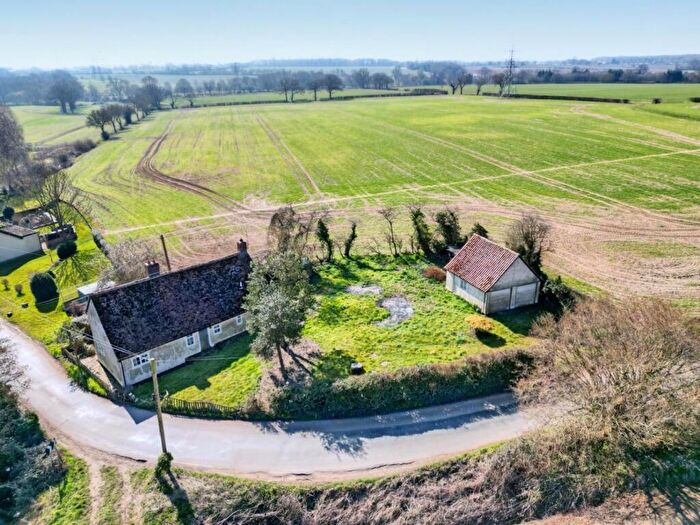
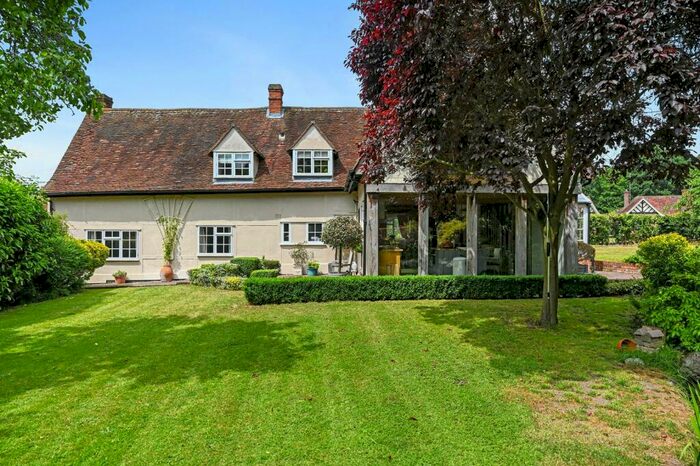
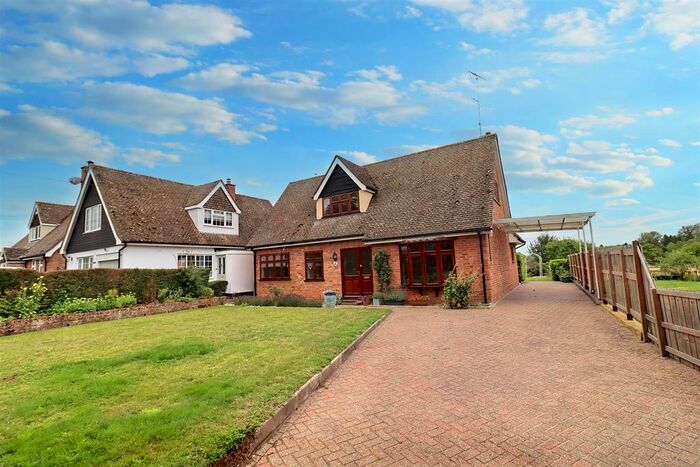
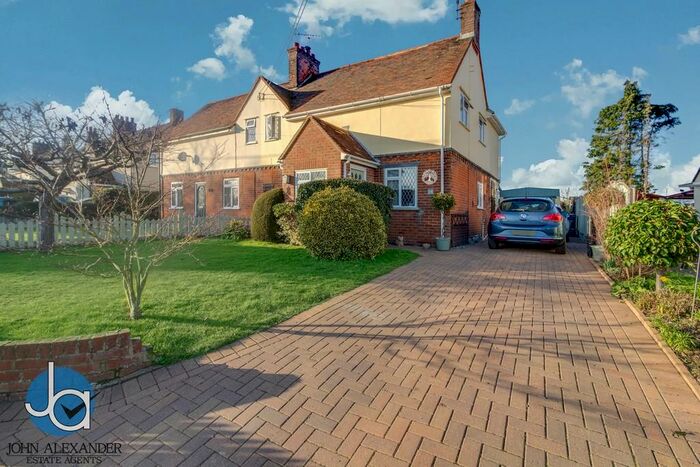
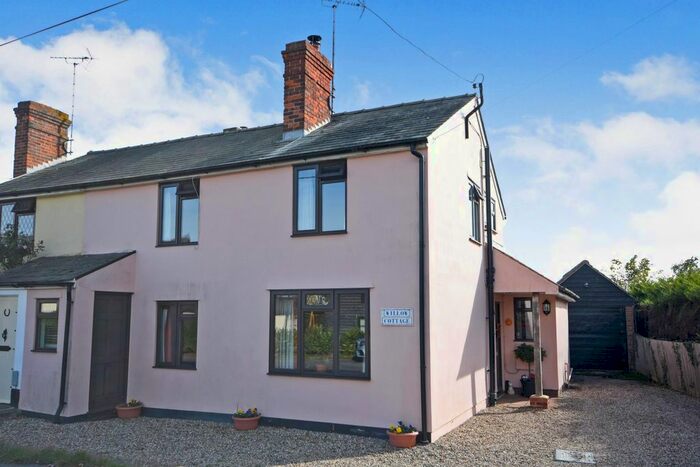
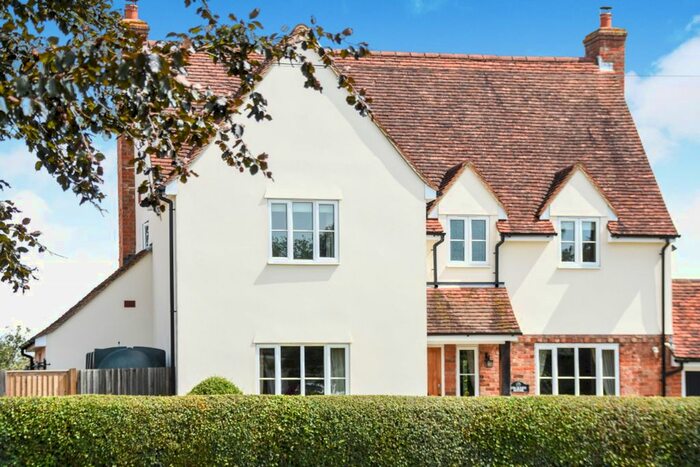
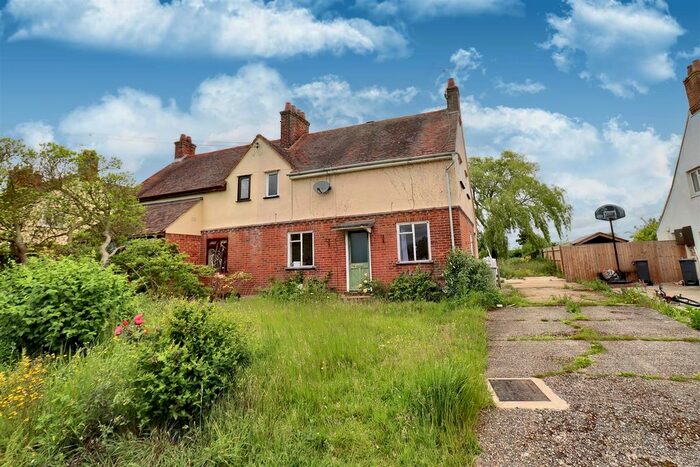
Previously listed properties in Black Notley And Terling
Roads and Postcodes in Black Notley And Terling
Navigate through our locations to find the location of your next house in Black Notley And Terling, Chelmsford for sale or to rent.
| Streets | Postcodes |
|---|---|
| Braintree Road | CM3 2AR CM3 2AW |
| Brookside Cottages | CM3 2BA |
| Fairstead Hall Road | CM3 2AT CM3 2AU |
| Fairstead Road | CM3 2BN CM3 2BU CM3 2BW |
| Flacks Green | CM3 2QS |
| Fuller Street | CM3 2AY CM3 2AZ CM3 2BB |
| Gambles Green | CM3 2QP |
| Garnets Mead | CM3 2PT |
| Griggs Lane | CM3 2QT |
| Hull Lane | CM3 2QX |
| Mill Lane | CM3 2QG |
| New Road | CM3 2PN |
| Norman Hill | CM3 2PZ CM3 2QE |
| Oakfield Lane | CM3 2QU |
| Owls Hill | CM3 2PS CM3 2PW |
| Ranks Green | CM3 2BE CM3 2BG |
| The Estate Yard | CM3 2RH |
| The Street | CM3 2PG |
| Viner Cottages | CM3 2PU |
| Waltham Road | CM3 2QR CM3 2RB |
| CM3 2BD CM3 2BJ CM3 2RA |
Transport near Black Notley And Terling
- FAQ
- Price Paid By Year
- Property Type Price
Frequently asked questions about Black Notley And Terling
What is the average price for a property for sale in Black Notley And Terling?
The average price for a property for sale in Black Notley And Terling is £635,875. This amount is 49% higher than the average price in Chelmsford. There are 27 property listings for sale in Black Notley And Terling.
What streets have the most expensive properties for sale in Black Notley And Terling?
The streets with the most expensive properties for sale in Black Notley And Terling are Fairstead Road at an average of £1,015,000 and Norman Hill at an average of £720,000.
What streets have the most affordable properties for sale in Black Notley And Terling?
The streets with the most affordable properties for sale in Black Notley And Terling are Hull Lane at an average of £506,250 and Owls Hill at an average of £530,500.
Which train stations are available in or near Black Notley And Terling?
Some of the train stations available in or near Black Notley And Terling are White Notley, Hatfield Peverel and Cressing.
Property Price Paid in Black Notley And Terling by Year
The average sold property price by year was:
| Year | Average Sold Price | Price Change |
Sold Properties
|
|---|---|---|---|
| 2024 | £775,000 | 21% |
5 Properties |
| 2023 | £613,750 | 8% |
8 Properties |
| 2022 | £561,785 | -16% |
7 Properties |
| 2021 | £651,818 | 10% |
11 Properties |
| 2020 | £588,333 | 8% |
3 Properties |
| 2019 | £539,307 | -0,3% |
13 Properties |
| 2018 | £540,937 | -6% |
8 Properties |
| 2017 | £574,285 | 18% |
7 Properties |
| 2016 | £470,999 | -36% |
10 Properties |
| 2015 | £640,100 | 23% |
5 Properties |
| 2014 | £491,800 | 20% |
5 Properties |
| 2013 | £394,999 | -7% |
6 Properties |
| 2012 | £421,666 | -56% |
3 Properties |
| 2011 | £657,250 | 26% |
4 Properties |
| 2010 | £483,600 | 25% |
10 Properties |
| 2009 | £362,166 | -13% |
3 Properties |
| 2008 | £407,700 | 6% |
5 Properties |
| 2007 | £384,265 | 20% |
8 Properties |
| 2006 | £307,625 | -20% |
8 Properties |
| 2005 | £367,833 | -52% |
6 Properties |
| 2004 | £558,571 | 50% |
7 Properties |
| 2003 | £280,700 | -0,2% |
10 Properties |
| 2002 | £281,285 | 8% |
7 Properties |
| 2001 | £260,000 | 5% |
13 Properties |
| 2000 | £247,766 | -51% |
15 Properties |
| 1999 | £375,050 | 65% |
6 Properties |
| 1998 | £132,600 | 10% |
10 Properties |
| 1997 | £119,464 | -4% |
6 Properties |
| 1996 | £124,138 | -27% |
9 Properties |
| 1995 | £157,875 | - |
4 Properties |
Property Price per Property Type in Black Notley And Terling
Here you can find historic sold price data in order to help with your property search.
The average Property Paid Price for specific property types in the last three years are:
| Property Type | Average Sold Price | Sold Properties |
|---|---|---|
| Semi Detached House | £529,444.00 | 9 Semi Detached Houses |
| Detached House | £762,600.00 | 10 Detached Houses |
| Terraced House | £326,500.00 | 1 Terraced House |

