
Houses for sale & to rent in Chelmsford, Essex
House Prices in Chelmsford
Properties in Chelmsford have an average house price of £426k and had 7,122 Property Transactions within the last 3 years.¹
Chelmsford is an area in Essex with 72,097 households², where the most expensive property was sold for £2.9M.
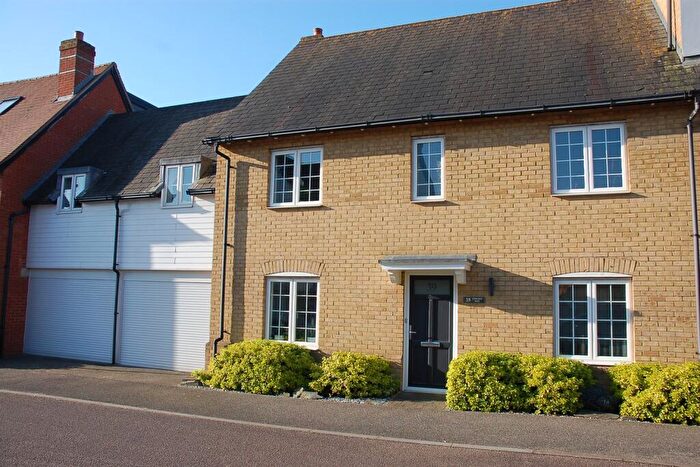
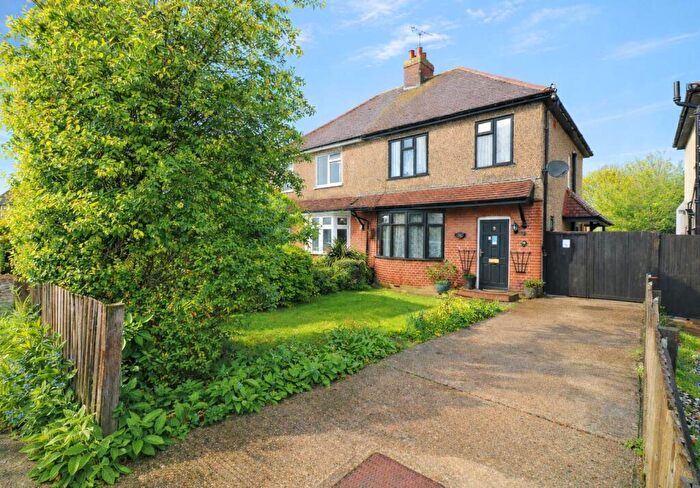
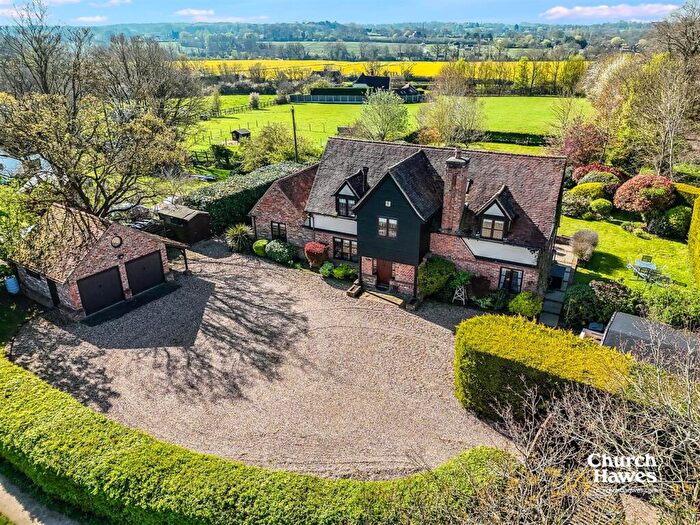
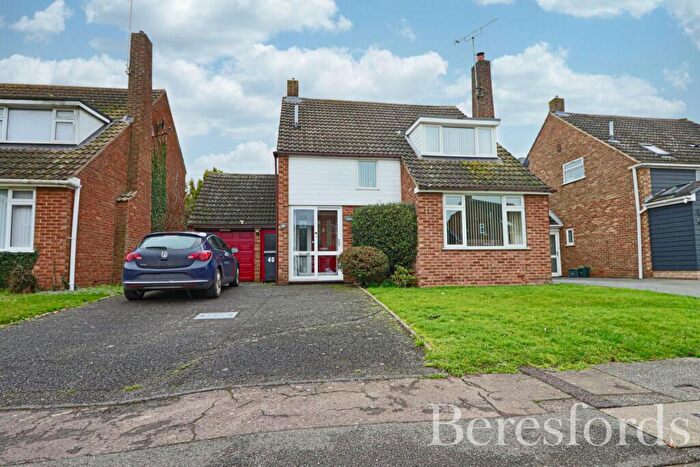
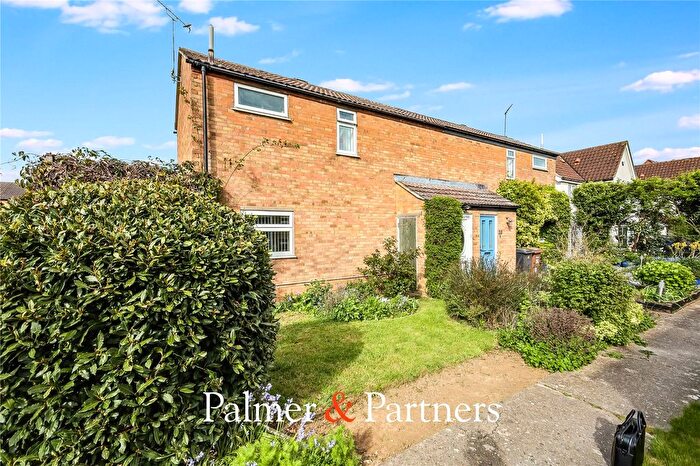
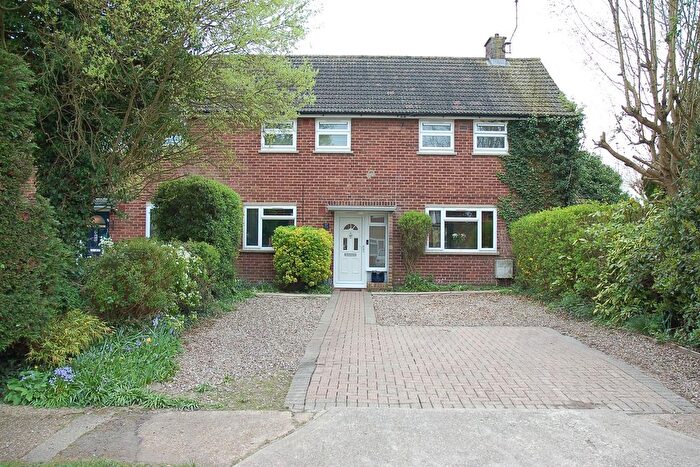
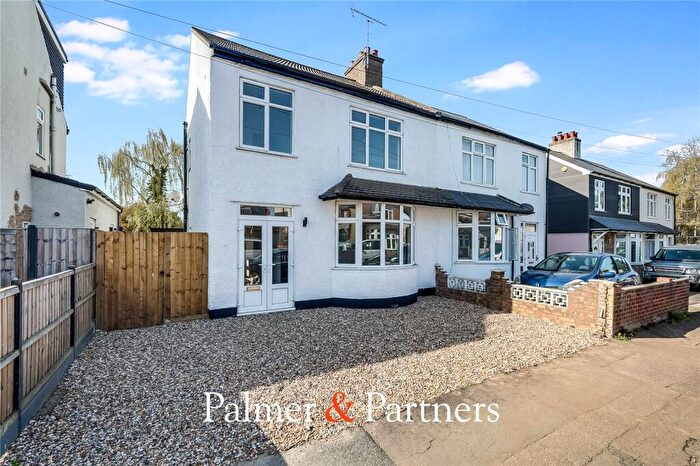
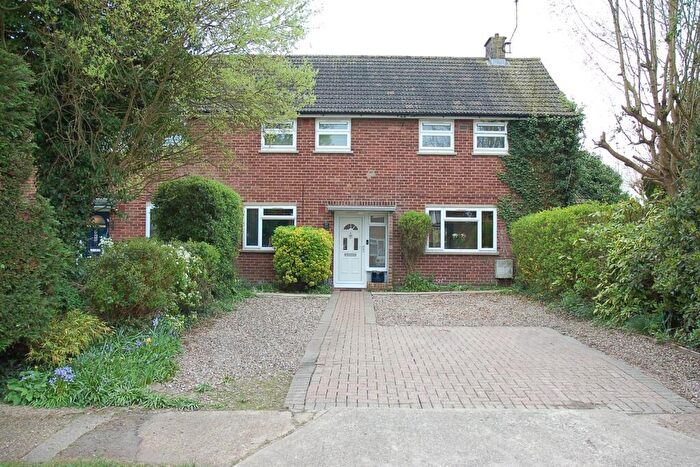
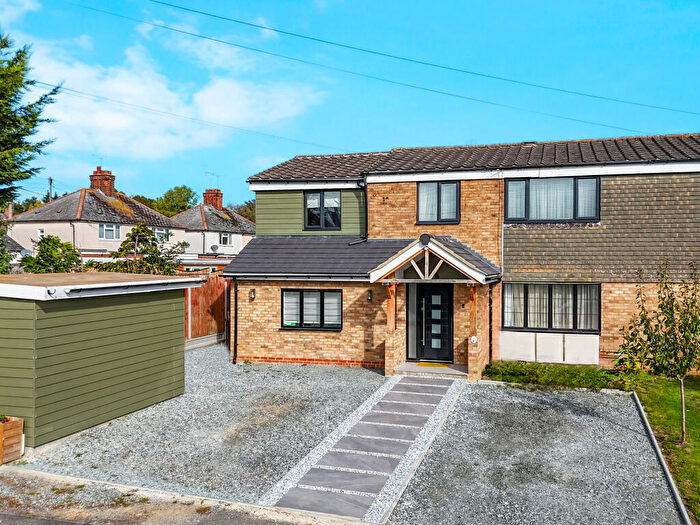
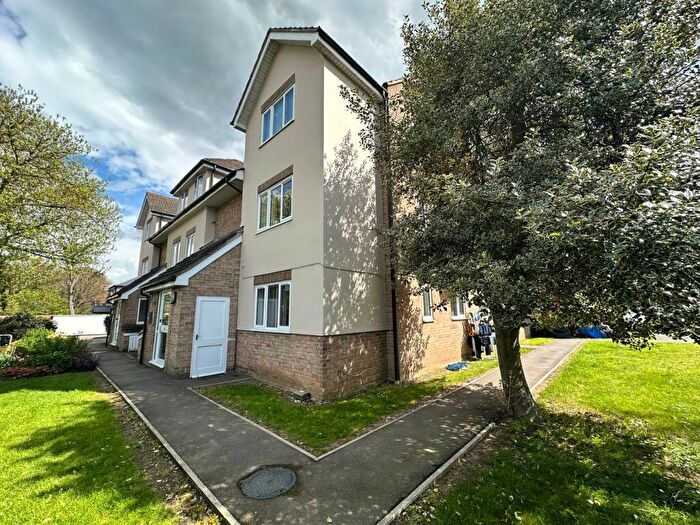
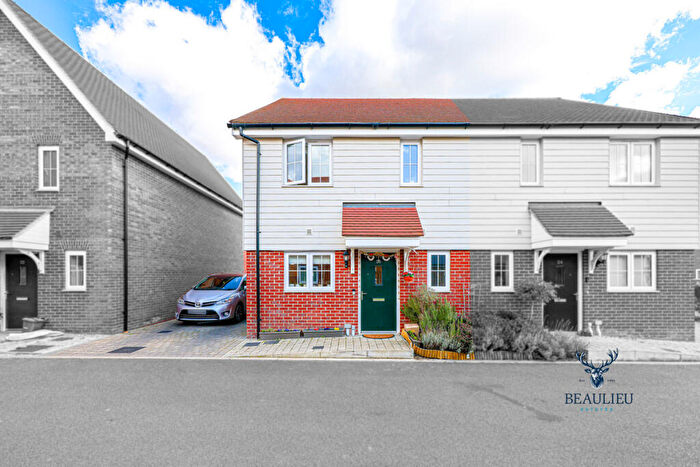
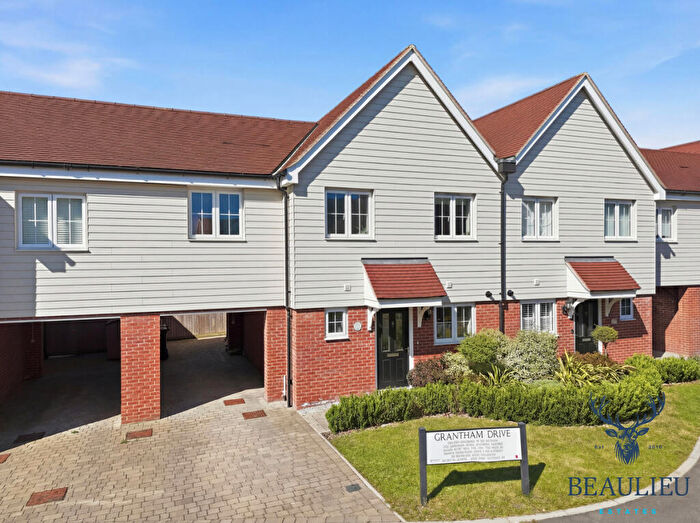
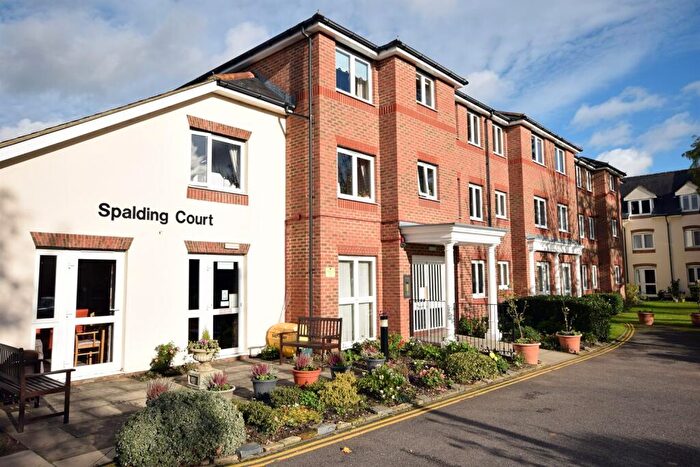
Properties for sale in Chelmsford

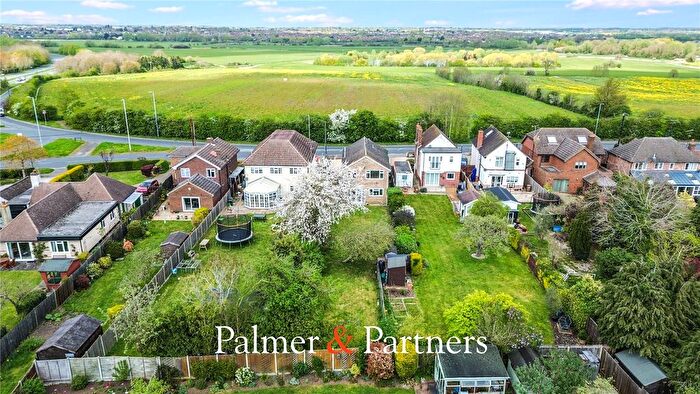

![]()
If you are looking to sell your house, let it out, or receive a property valuation, an expert can help you.
Click the button below to get started.


Neighbourhoods in Chelmsford
Navigate through our locations to find the location of your next house in Chelmsford, Essex for sale or to rent.
- Althorne
- Barnston And High Easter
- Bicknacre And East And West Hanningfield
- Black Notley And Terling
- Boreham And The Leighs
- Broomfield And The Walthams
- Chelmer Village And Beaulieu Park
- Chelmsford Rural West
- Felsted
- Galleywood
- Goat Hall
- Great Baddow East
- Great Baddow West
- Hatfield Peverel
- Little Baddow, Danbury And Sandon
- Marconi
- Mayland
- Moulsham And Central
- Moulsham Lodge
- Patching Hall
- Purleigh
- Rettendon And Runwell
- South Hanningfield, Stock And Margaretting
- South Woodham-chetwood And Collingwood
- South Woodham-elmwood And Woodville
- Southminster
- Springfield North
- St Andrews
- The Lawns
- The Rodings
- Trinity
- Waterhouse Farm
- Wickham Bishops And Woodham
- Writtle
- High Easter & the Rodings
- Felsted & Stebbing
- Hatfield Peverel & Terling
Transport in Chelmsford
Please see below transportation links in this area:
-
 Chelmsford Station
 -
Hatfield Peverel Station
-
South Woodham Ferrers Station
-
Ingatestone Station
-
Witham Station
-
Battlesbridge Station
-
Wickford Station
-
Billericay Station
-
White Notley Station
-
Cressing Station
- FAQ
- Price Paid By Year
- Property Type Price
Frequently asked questions about Chelmsford
What is the average price for a property for sale in Chelmsford?
The average price for a property for sale in Chelmsford is £425,672. This amount is 5% higher than the average price in Essex. There are more than 10,000 property listings for sale in Chelmsford.
What locations have the most expensive properties for sale in Chelmsford?
The locations with the most expensive properties for sale in Chelmsford are Southminster at an average of £2,000,000, Wickham Bishops And Woodham at an average of £1,232,042 and South Hanningfield, Stock And Margaretting at an average of £843,800.
What locations have the most affordable properties for sale in Chelmsford?
The locations with the most affordable properties for sale in Chelmsford are Marconi at an average of £325,588, Waterhouse Farm at an average of £337,134 and Moulsham And Central at an average of £339,918.
Which train stations are available in or near Chelmsford?
Some of the train stations available in or near Chelmsford are Chelmsford, Hatfield Peverel and South Woodham Ferrers.
Property Price Paid in Chelmsford by Year
The average sold property price by year was:
| Year | Average Sold Price | Price Change |
Sold Properties
|
|---|---|---|---|
| 2026 | £420,478 | -4% |
47 Properties |
| 2025 | £438,132 | 4% |
2,400 Properties |
| 2024 | £420,294 | 0,5% |
2,425 Properties |
| 2023 | £418,287 | -4% |
2,250 Properties |
| 2022 | £436,230 | 4% |
3,032 Properties |
| 2021 | £419,365 | 3% |
3,839 Properties |
| 2020 | £406,957 | 6% |
2,607 Properties |
| 2019 | £381,011 | 1% |
3,074 Properties |
| 2018 | £377,320 | 3% |
3,057 Properties |
| 2017 | £366,669 | 5% |
3,236 Properties |
| 2016 | £347,344 | 12% |
3,521 Properties |
| 2015 | £306,660 | 8% |
3,551 Properties |
| 2014 | £281,893 | 8% |
3,407 Properties |
| 2013 | £258,396 | 2% |
2,722 Properties |
| 2012 | £253,908 | 2% |
2,337 Properties |
| 2011 | £249,240 | -2% |
2,335 Properties |
| 2010 | £254,141 | 6% |
2,429 Properties |
| 2009 | £239,503 | -1% |
2,158 Properties |
| 2008 | £241,364 | -4% |
2,044 Properties |
| 2007 | £251,257 | 9% |
4,084 Properties |
| 2006 | £228,968 | 5% |
4,352 Properties |
| 2005 | £218,039 | 3% |
3,395 Properties |
| 2004 | £211,864 | 7% |
4,015 Properties |
| 2003 | £196,411 | 14% |
4,075 Properties |
| 2002 | £169,460 | 19% |
4,348 Properties |
| 2001 | £137,995 | 14% |
4,202 Properties |
| 2000 | £118,099 | 13% |
3,869 Properties |
| 1999 | £102,305 | 12% |
4,316 Properties |
| 1998 | £89,982 | 9% |
3,420 Properties |
| 1997 | £81,527 | 10% |
3,874 Properties |
| 1996 | £73,751 | 4% |
3,500 Properties |
| 1995 | £71,074 | - |
2,790 Properties |
Property Price per Property Type in Chelmsford
Here you can find historic sold price data in order to help with your property search.
The average Property Paid Price for specific property types in the last three years are:
| Property Type | Average Sold Price | Sold Properties |
|---|---|---|
| Semi Detached House | £431,171.00 | 2,004 Semi Detached Houses |
| Terraced House | £357,844.00 | 1,613 Terraced Houses |
| Detached House | £638,294.00 | 1,969 Detached Houses |
| Flat | £217,166.00 | 1,536 Flats |