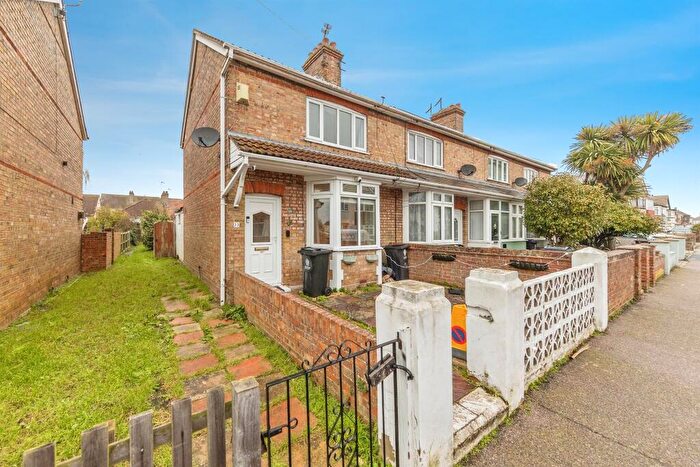
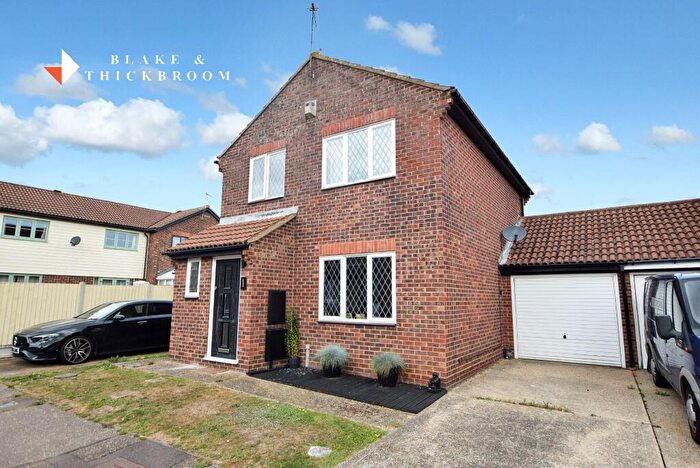
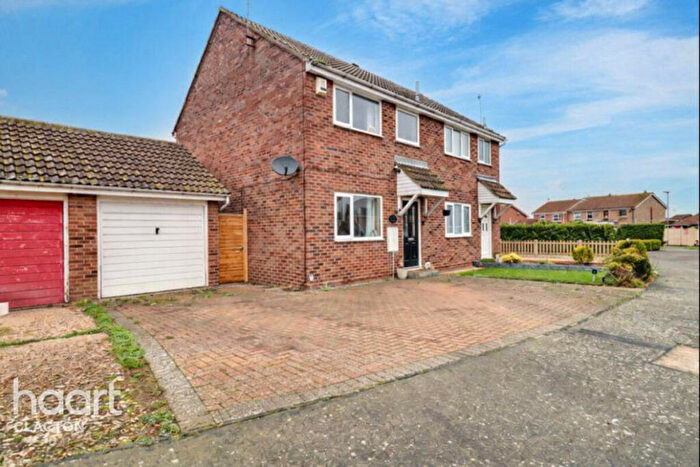
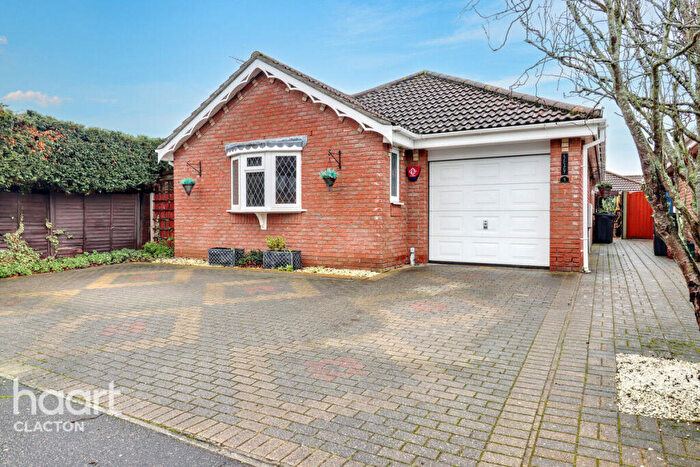
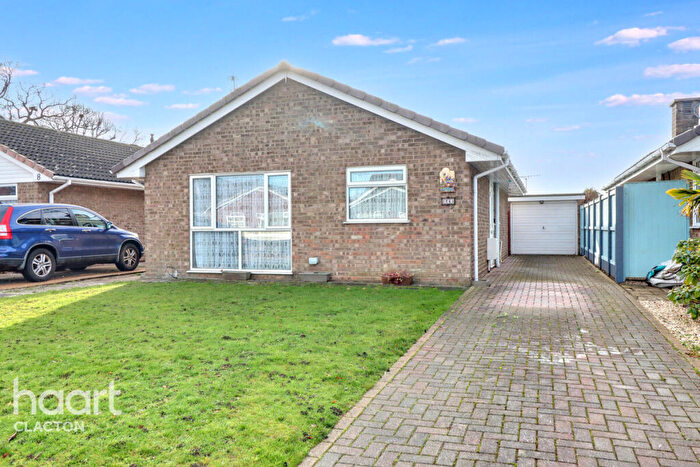
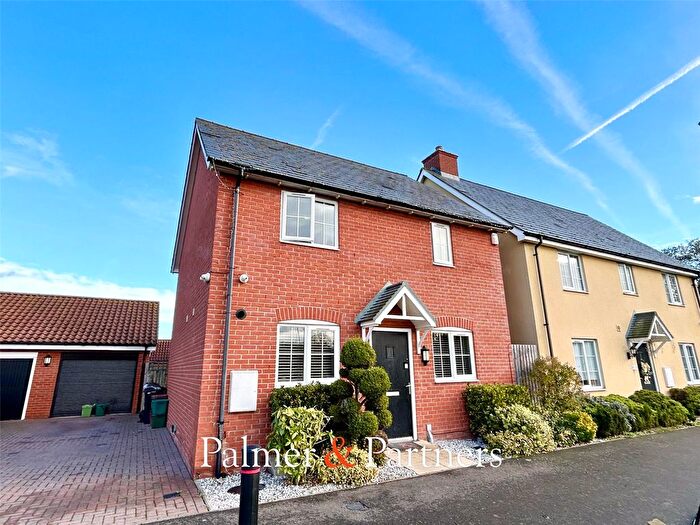
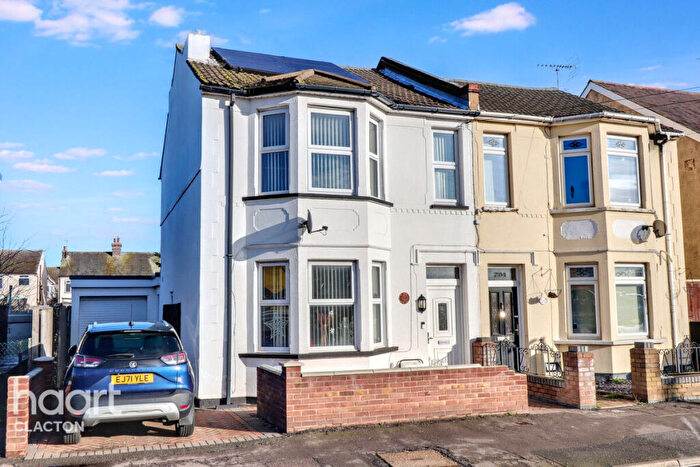
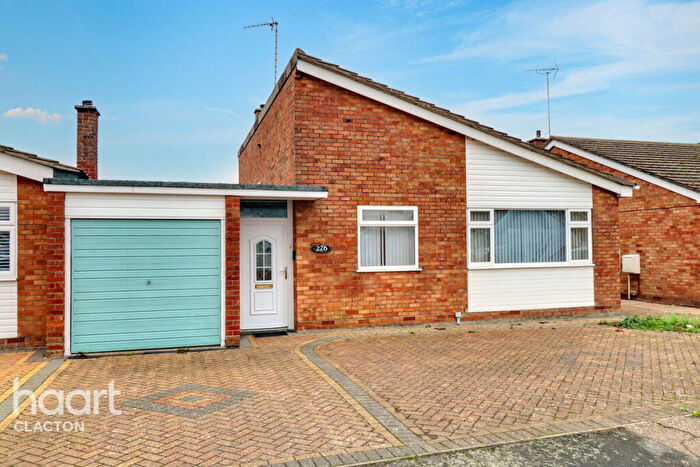
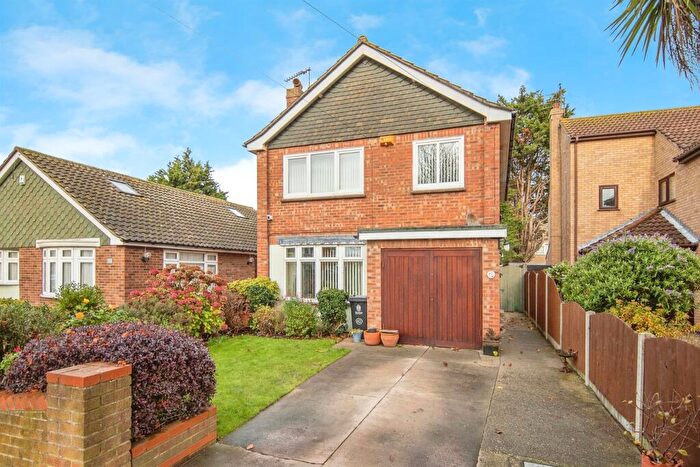
Houses for sale & to rent in Peter Bruff, Clacton-on-sea
House Prices in Peter Bruff
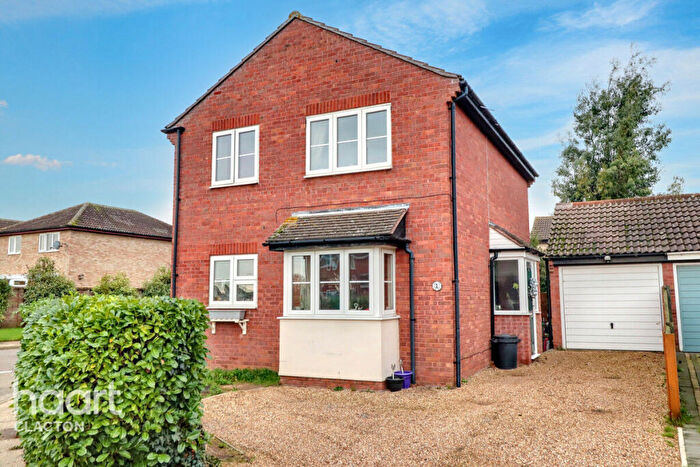
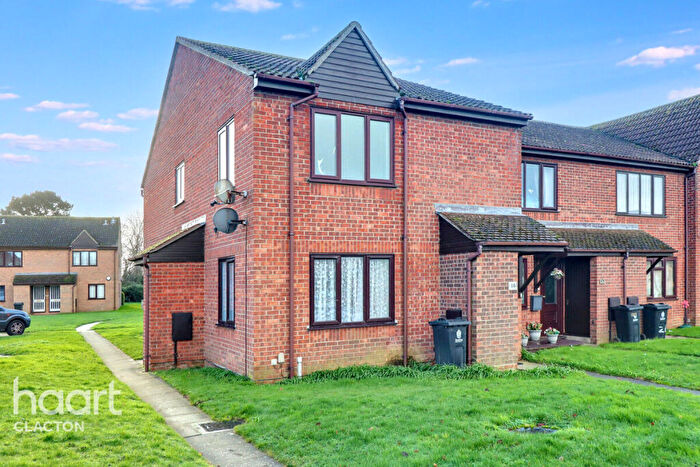
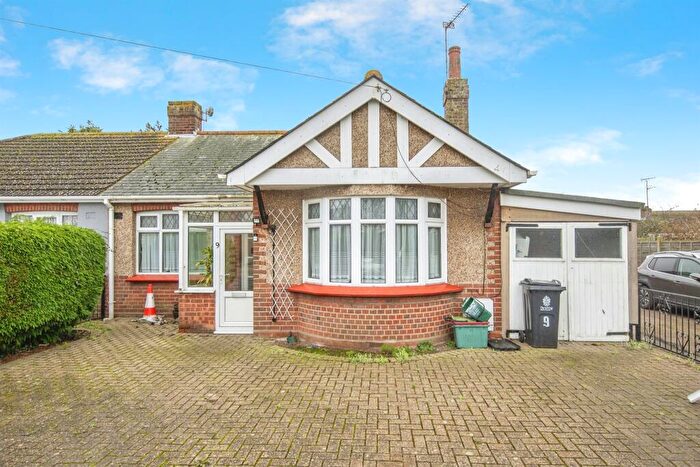
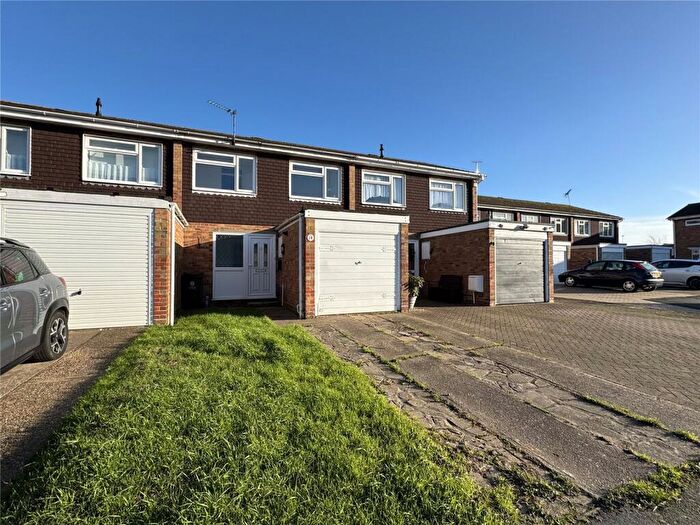
Properties in Peter Bruff have an average house price of £238,516.00 and had 248 Property Transactions within the last 3 years¹.
Peter Bruff is an area in Clacton-on-sea, Essex with 1,744 households², where the most expensive property was sold for £465,000.00.
Properties for sale in Peter Bruff
Roads and Postcodes in Peter Bruff
Navigate through our locations to find the location of your next house in Peter Bruff, Clacton-on-sea for sale or to rent.
| Streets | Postcodes |
|---|---|
| Aster Close | CO16 7DA |
| Azalea Way | CO16 7BY |
| Banister Close | CO16 8XD |
| Begonia Place | CO16 7EE |
| Bluebell Avenue | CO16 7BX |
| Bromley Close | CO16 7HZ |
| Camellia Avenue | CO16 7DE |
| Camellia Crescent | CO16 7ET CO16 7EU |
| Cloes Lane | CO15 3JZ |
| Coppins Road | CO15 3LA CO15 3LB CO15 3LF CO15 3LG CO15 3LH CO15 3LQ |
| Crocus Close | CO16 7DY |
| Dahlia Close | CO16 7BU |
| Douglas Road | CO15 3JN CO15 3JT CO15 3JX CO15 3JY |
| Edgware Road | CO16 7HH |
| Elthorne Park | CO16 7HW |
| Finer Close | CO16 8UD |
| Fuchsia Way | CO16 7DN |
| Gardenia Place | CO16 7DB |
| Geranium Close | CO16 7EA |
| Gilders Way | CO16 8UB CO16 8UU |
| Hampstead Avenue | CO16 7HE CO16 7JF |
| Hanwell Close | CO16 7HF |
| Harman Walk | CO16 8UN |
| Hendon Close | CO16 7HD |
| Hoxton Close | CO16 7HN |
| Hudson Close | CO16 8UP |
| Hyacinth Close | CO16 7DG |
| Kilburn Gardens | CO16 7HB |
| Kingsman Drive | CO16 8UL CO16 8UR |
| Land Close | CO16 8UJ |
| London Road | CO15 3ST |
| Lupin Way | CO16 7DX |
| Marigold Avenue | CO16 7DZ |
| Melbourne Road | CO15 3HX CO15 3HY CO15 3HZ CO15 3JA |
| Muswell Walk | CO16 7HA |
| Neasden Avenue | CO16 7HG |
| Nien Oord | CO16 8TT |
| Orchard Close | CO16 8DT |
| Parry Drive | CO16 8UH |
| Pathfields Road | CO15 3JH |
| Peter Bruff Avenue | CO16 8UA CO16 8UE |
| Pollard Walk | CO16 8XQ |
| Primula Close | CO16 7DD |
| Redrose Walk | CO16 7ED |
| Reed Close | CO16 8UG |
| Ruaton Drive | CO16 7BT |
| Salvia Close | CO16 7BZ |
| Southgreen Gardens | CO16 7DS |
| Spring Close | CO16 8UX |
| St Johns Road | CO16 8DD CO16 8DF |
| Stambridge Road | CO15 3JR |
| Stanmore Close | CO16 7HQ |
| Tapsworth Close | CO16 8UF |
| Thomas Road | CO15 3JB CO15 3JD CO15 3JE |
| Totteridge Close | CO16 7HJ |
| Towse Close | CO16 8US |
| Tulip Way | CO16 7BW |
| Upper Branston Road | CO15 3JP CO15 3JS |
| Wistaria Place | CO16 7EF |
| Witting Close | CO16 8UZ |
| Woolwich Road | CO16 8UW |
| Young Close | CO16 8UQ |
| Zinnia Mews | CO16 7DT |
Transport near Peter Bruff
- FAQ
- Price Paid By Year
- Property Type Price
Frequently asked questions about Peter Bruff
What is the average price for a property for sale in Peter Bruff?
The average price for a property for sale in Peter Bruff is £238,516. This amount is 9% lower than the average price in Clacton-on-sea. There are 1,645 property listings for sale in Peter Bruff.
What streets have the most expensive properties for sale in Peter Bruff?
The streets with the most expensive properties for sale in Peter Bruff are Neasden Avenue at an average of £334,888, St Johns Road at an average of £333,333 and Stambridge Road at an average of £327,500.
What streets have the most affordable properties for sale in Peter Bruff?
The streets with the most affordable properties for sale in Peter Bruff are Bluebell Avenue at an average of £147,500, Gardenia Place at an average of £157,500 and Hoxton Close at an average of £157,500.
Which train stations are available in or near Peter Bruff?
Some of the train stations available in or near Peter Bruff are Clacton, Thorpe-le-Soken and Weeley.
Property Price Paid in Peter Bruff by Year
The average sold property price by year was:
| Year | Average Sold Price | Price Change |
Sold Properties
|
|---|---|---|---|
| 2025 | £231,184 | 0,1% |
46 Properties |
| 2024 | £231,050 | -12% |
70 Properties |
| 2023 | £258,323 | 7% |
41 Properties |
| 2022 | £239,042 | 12% |
91 Properties |
| 2021 | £210,034 | 1% |
80 Properties |
| 2020 | £207,687 | 8% |
56 Properties |
| 2019 | £190,468 | -1% |
64 Properties |
| 2018 | £192,585 | 2% |
78 Properties |
| 2017 | £188,867 | 10% |
108 Properties |
| 2016 | £170,281 | 12% |
86 Properties |
| 2015 | £149,898 | 8% |
89 Properties |
| 2014 | £137,813 | -3% |
94 Properties |
| 2013 | £142,197 | 11% |
73 Properties |
| 2012 | £126,060 | -11% |
41 Properties |
| 2011 | £139,763 | 2% |
61 Properties |
| 2010 | £137,609 | 4% |
47 Properties |
| 2009 | £132,405 | -18% |
46 Properties |
| 2008 | £155,794 | 5% |
51 Properties |
| 2007 | £148,456 | 7% |
103 Properties |
| 2006 | £138,585 | 1% |
102 Properties |
| 2005 | £136,766 | 1% |
97 Properties |
| 2004 | £135,064 | 14% |
116 Properties |
| 2003 | £115,984 | 14% |
122 Properties |
| 2002 | £100,146 | 19% |
174 Properties |
| 2001 | £81,244 | 11% |
170 Properties |
| 2000 | £72,032 | 15% |
175 Properties |
| 1999 | £61,118 | 13% |
174 Properties |
| 1998 | £53,298 | 14% |
143 Properties |
| 1997 | £45,870 | 7% |
132 Properties |
| 1996 | £42,863 | 3% |
123 Properties |
| 1995 | £41,694 | - |
95 Properties |
Property Price per Property Type in Peter Bruff
Here you can find historic sold price data in order to help with your property search.
The average Property Paid Price for specific property types in the last three years are:
| Property Type | Average Sold Price | Sold Properties |
|---|---|---|
| Semi Detached House | £241,358.00 | 83 Semi Detached Houses |
| Detached House | £291,800.00 | 78 Detached Houses |
| Terraced House | £207,601.00 | 59 Terraced Houses |
| Flat | £146,803.00 | 28 Flats |

