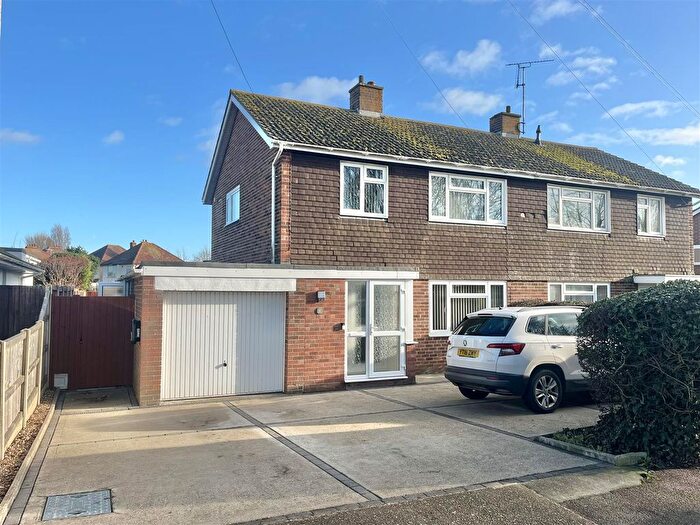
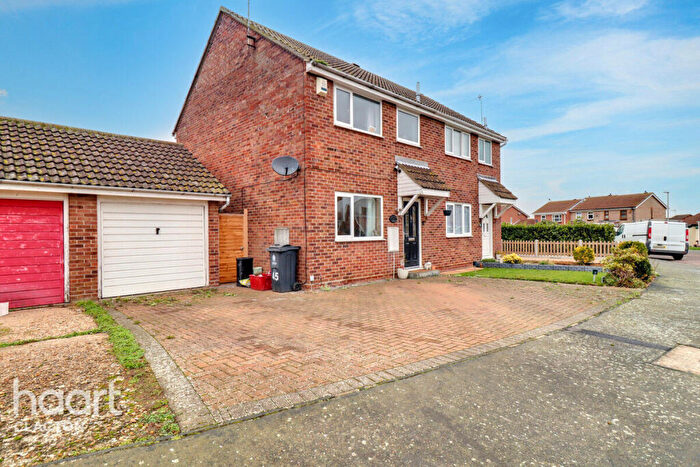
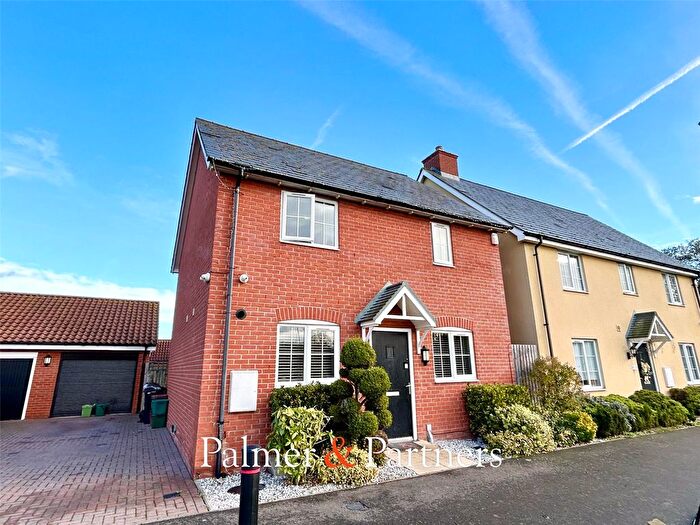
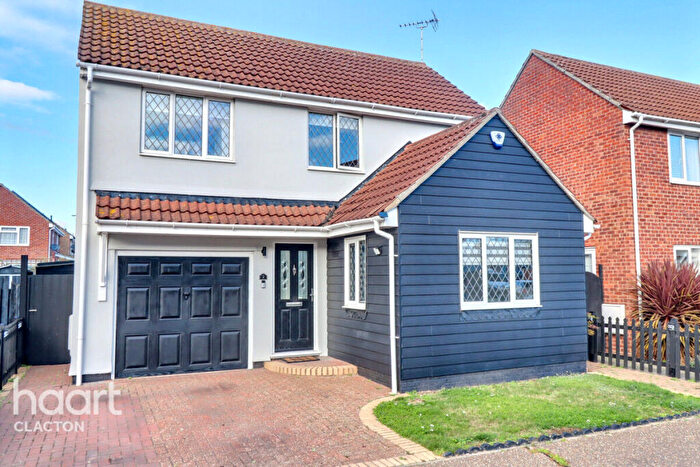
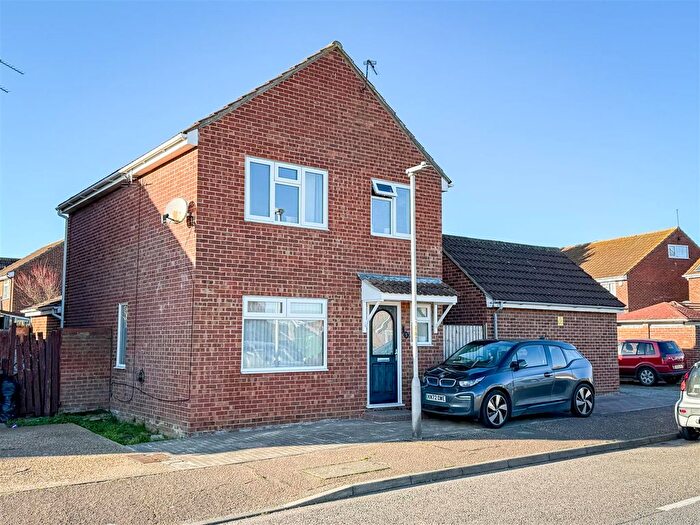
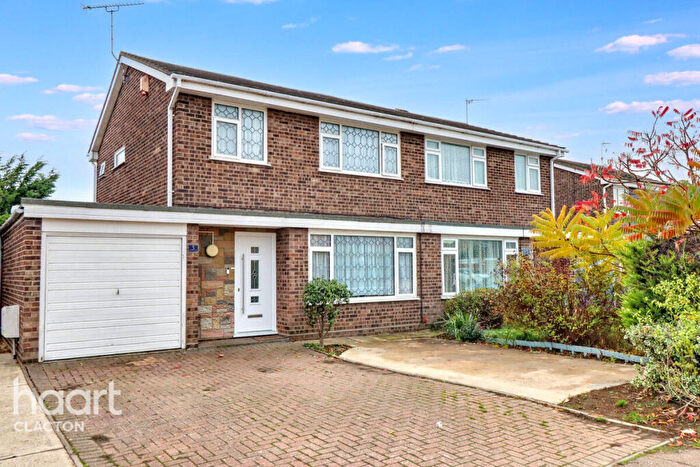
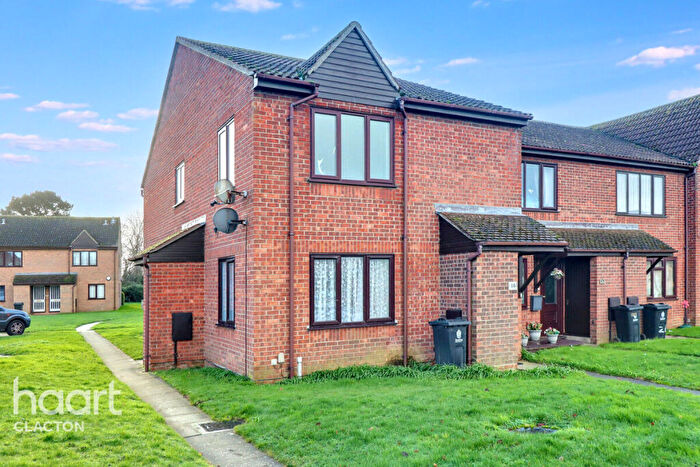
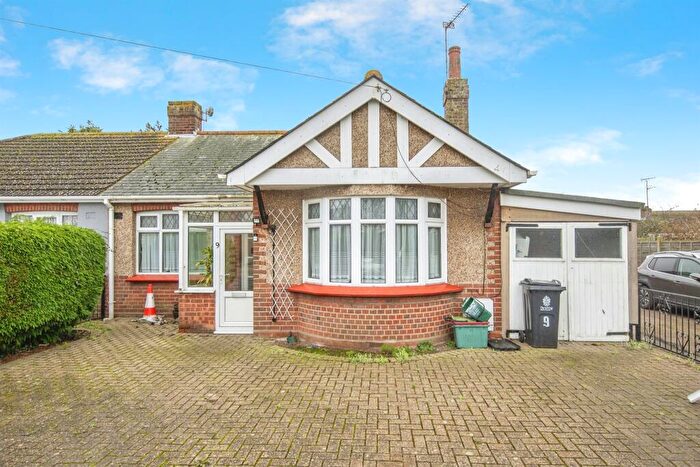
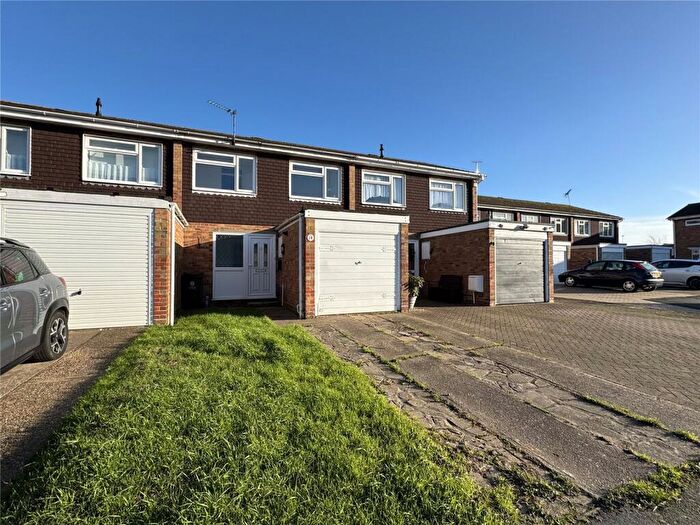
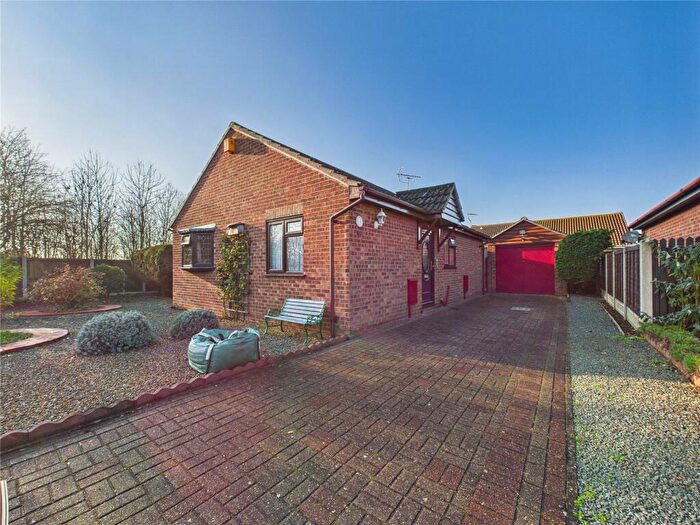
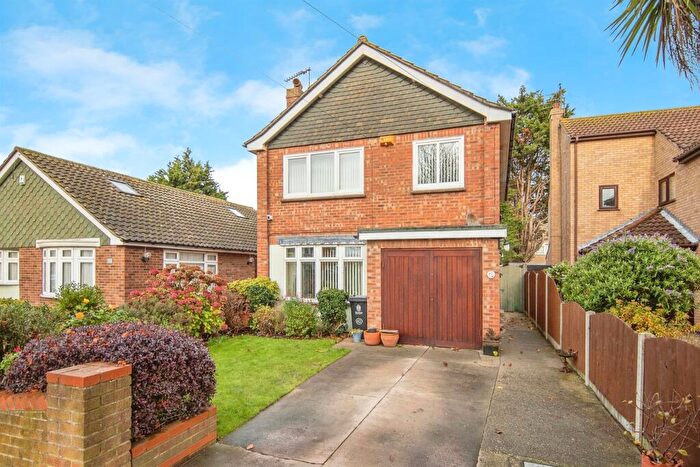
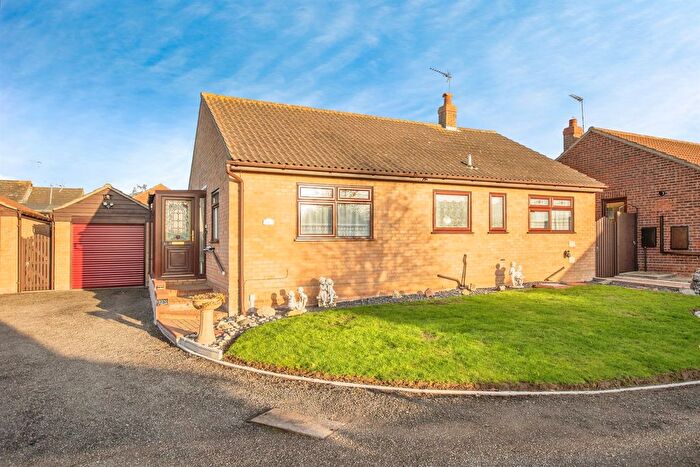
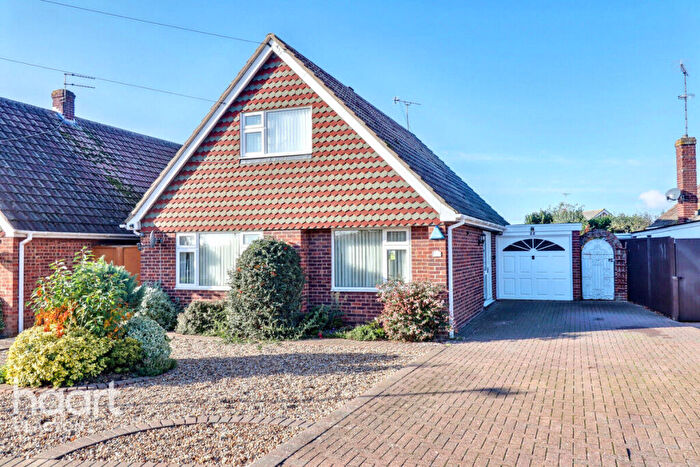
Houses for sale & to rent in Rush Green, Clacton-on-sea
House Prices in Rush Green
Properties in Rush Green have an average house price of £235,138.00 and had 194 Property Transactions within the last 3 years¹.
Rush Green is an area in Clacton-on-sea, Essex with 1,895 households², where the most expensive property was sold for £435,000.00.
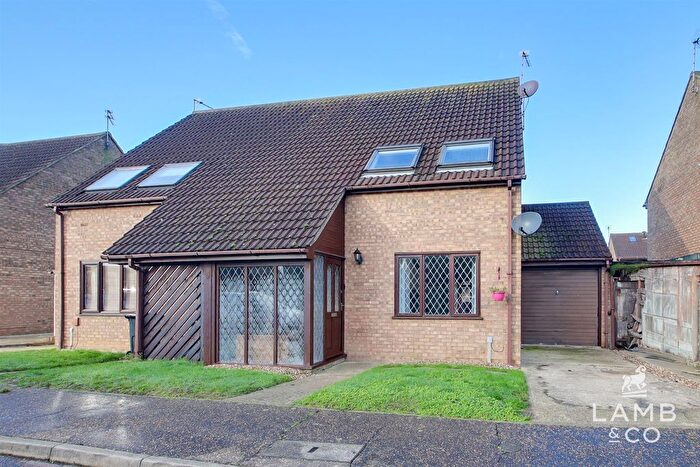
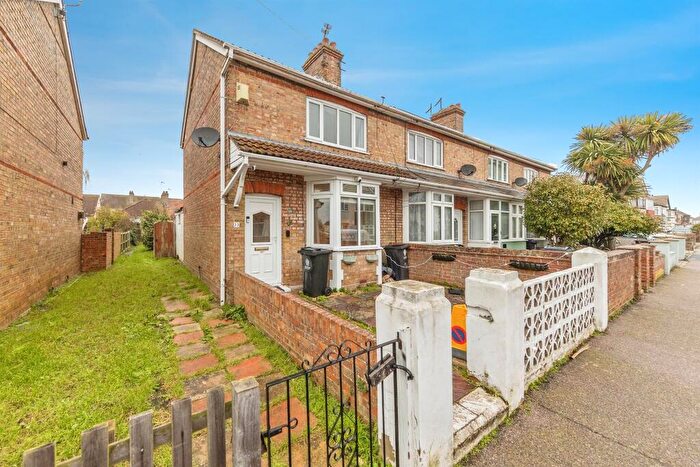
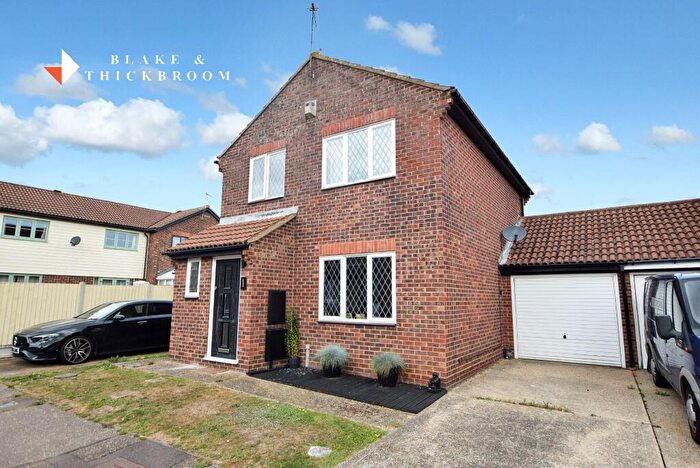
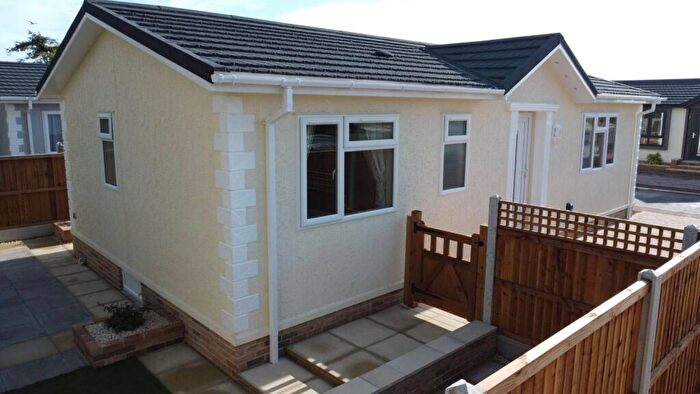
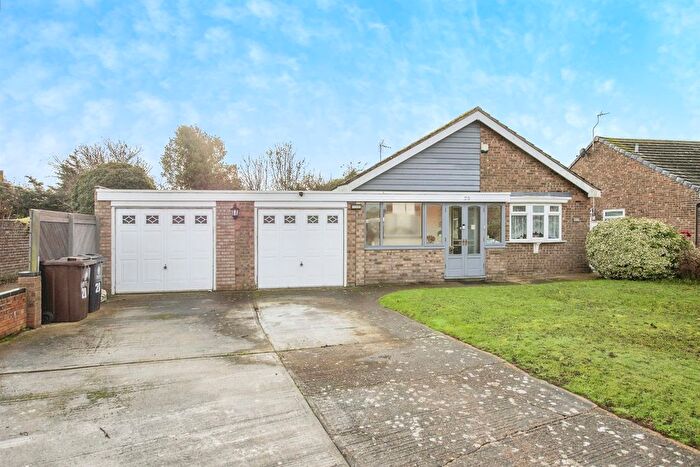
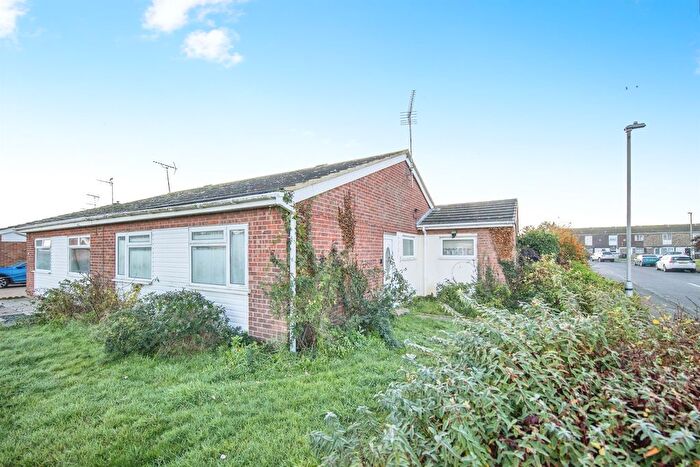
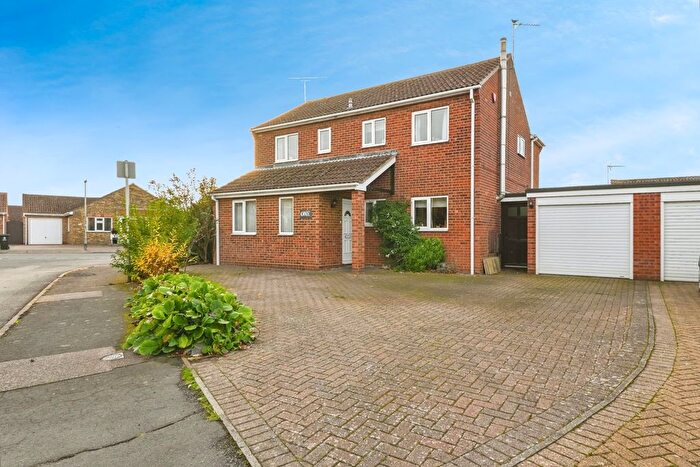
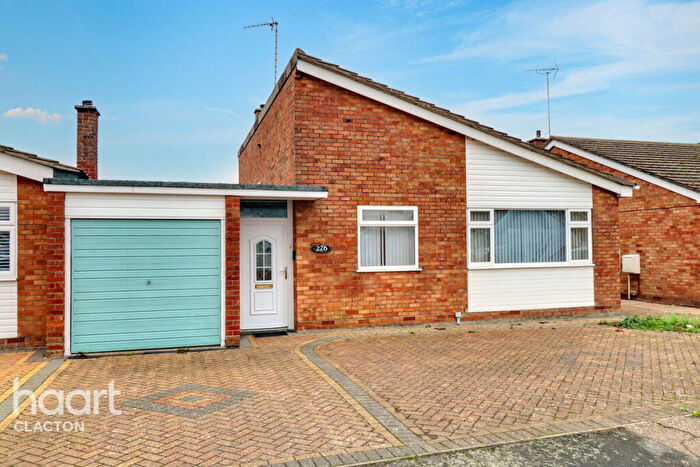
Properties for sale in Rush Green
Roads and Postcodes in Rush Green
Navigate through our locations to find the location of your next house in Rush Green, Clacton-on-sea for sale or to rent.
| Streets | Postcodes |
|---|---|
| Aldeburgh Close | CO16 8BA |
| Almond Close | CO15 2BW |
| Ash Close | CO15 2DE |
| Balmoral Avenue | CO15 2AJ |
| Battisford Drive | CO16 7LB CO16 7LD CO16 7LS |
| Bawdsey Close | CO16 7LL |
| Benhall Close | CO16 7PB |
| Birch Close | CO15 2DJ |
| Boxted Avenue | CO16 7AE |
| Burmanny Close | CO15 2BA |
| Carters Close | CO16 7AT |
| Cattermole Close | CO16 7EY |
| Chandlers Close | CO16 7AX |
| Chestnut Avenue | CO15 2BG CO15 2BQ |
| Cloes Lane | CO16 7BS CO16 8AG |
| Coopers Lane | CO15 2AT CO15 2AU CO15 2BX CO15 2BY CO15 2DA CO15 2DG |
| Dedham Avenue | CO16 8AL CO16 8AN |
| Farmers Way | CO16 7AY |
| Felixstowe Close | CO16 7LP |
| Flatford Drive | CO16 8AH CO16 8AJ CO16 8BT CO16 8BU |
| Greenford Road | CO15 2AZ |
| Hadleigh Road | CO16 8TL CO16 8TN |
| Hawkendon Road | CO16 7LE |
| Holbrook Close | CO16 8TH |
| Ivy Terrace | CO16 7BQ |
| Kersey Drive | CO16 8AP |
| Laburnum Close | CO15 2DD |
| Langham Drive | CO16 7AG CO16 7AQ |
| Lavenham Close | CO16 8BZ |
| Lime Close | CO15 2BZ |
| Maple Close | CO15 2DH |
| Mason Road | CO16 7AN CO16 7AW |
| Nayland Drive | CO16 8TJ CO16 8TZ |
| Ongar Close | CO16 7PF |
| Polstead Way | CO16 7AJ |
| Poplar Close | CO15 2BN |
| Porter Way | CO16 7AR CO16 7AU |
| Raglan Mews | CO15 2DS |
| Risby Close | CO16 7LF |
| Rowan Close | CO15 2DB |
| Rush Green Road | CO16 7AA CO16 7AB CO16 7AD CO16 7AL CO16 7BG CO16 7BL |
| Saxmundham Way | CO16 7PD CO16 7PG CO16 7PQ |
| Saxstead Drive | CO16 7LH |
| Shotley Close | CO16 7LJ |
| Snape Close | CO16 7LQ |
| St Ives Close | CO16 7BJ |
| Stanley Road | CO15 2AX CO15 2BD CO15 2BE CO15 2BJ CO15 2BL CO15 2BP CO15 2BS |
| Stoke Ash Close | CO16 7LN |
| Sycamore Way | CO15 2BH |
| Tanner Close | CO16 7AS |
| The Green | CO16 7BH |
| The Lane | CO15 2DP |
| Trimley Close | CO16 7AZ |
| Trunette Road | CO15 2BB |
| Tyler Avenue | CO16 7AP |
| Walnut Way | CO15 2BT |
| Windsor Avenue | CO15 2AG CO15 2AH CO15 2AQ |
| Writtle Close | CO16 7PE |
Transport near Rush Green
- FAQ
- Price Paid By Year
- Property Type Price
Frequently asked questions about Rush Green
What is the average price for a property for sale in Rush Green?
The average price for a property for sale in Rush Green is £235,138. This amount is 10% lower than the average price in Clacton-on-sea. There are 1,304 property listings for sale in Rush Green.
What streets have the most expensive properties for sale in Rush Green?
The streets with the most expensive properties for sale in Rush Green are Carters Close at an average of £361,250, Benhall Close at an average of £355,000 and Rush Green Road at an average of £306,714.
What streets have the most affordable properties for sale in Rush Green?
The streets with the most affordable properties for sale in Rush Green are Hadleigh Road at an average of £148,500, Nayland Drive at an average of £150,875 and Trimley Close at an average of £172,600.
Which train stations are available in or near Rush Green?
Some of the train stations available in or near Rush Green are Clacton, Thorpe-le-Soken and Weeley.
Property Price Paid in Rush Green by Year
The average sold property price by year was:
| Year | Average Sold Price | Price Change |
Sold Properties
|
|---|---|---|---|
| 2025 | £238,333 | 8% |
36 Properties |
| 2024 | £218,605 | -4% |
38 Properties |
| 2023 | £227,177 | -9% |
48 Properties |
| 2022 | £247,575 | 17% |
72 Properties |
| 2021 | £204,331 | 12% |
95 Properties |
| 2020 | £179,320 | -3% |
50 Properties |
| 2019 | £183,950 | -3% |
61 Properties |
| 2018 | £189,259 | 6% |
55 Properties |
| 2017 | £177,190 | 6% |
68 Properties |
| 2016 | £165,991 | 11% |
70 Properties |
| 2015 | £148,467 | 3% |
78 Properties |
| 2014 | £144,479 | 19% |
77 Properties |
| 2013 | £117,367 | -10% |
49 Properties |
| 2012 | £128,759 | -5% |
57 Properties |
| 2011 | £134,863 | 3% |
60 Properties |
| 2010 | £130,715 | 9% |
51 Properties |
| 2009 | £119,165 | -20% |
48 Properties |
| 2008 | £142,928 | -2% |
42 Properties |
| 2007 | £145,099 | 2% |
85 Properties |
| 2006 | £142,156 | 1% |
79 Properties |
| 2005 | £140,158 | -1% |
63 Properties |
| 2004 | £141,976 | 23% |
99 Properties |
| 2003 | £109,604 | 4% |
102 Properties |
| 2002 | £104,717 | 23% |
112 Properties |
| 2001 | £80,951 | 23% |
130 Properties |
| 2000 | £62,223 | 10% |
85 Properties |
| 1999 | £55,923 | 11% |
115 Properties |
| 1998 | £49,829 | 0,3% |
93 Properties |
| 1997 | £49,658 | 17% |
135 Properties |
| 1996 | £41,235 | -13% |
108 Properties |
| 1995 | £46,617 | - |
76 Properties |
Property Price per Property Type in Rush Green
Here you can find historic sold price data in order to help with your property search.
The average Property Paid Price for specific property types in the last three years are:
| Property Type | Average Sold Price | Sold Properties |
|---|---|---|
| Semi Detached House | £227,848.00 | 63 Semi Detached Houses |
| Detached House | £281,857.00 | 77 Detached Houses |
| Terraced House | £198,679.00 | 39 Terraced Houses |
| Flat | £120,733.00 | 15 Flats |

