
Houses for sale & to rent in Clacton-on-sea, Essex
House Prices in Clacton-on-sea
Properties in Clacton-on-sea have an average house price of £256k and had 3,411 Property Transactions within the last 3 years.¹
Clacton-on-sea is an area in Essex with 30,577 households², where the most expensive property was sold for £3.76M.
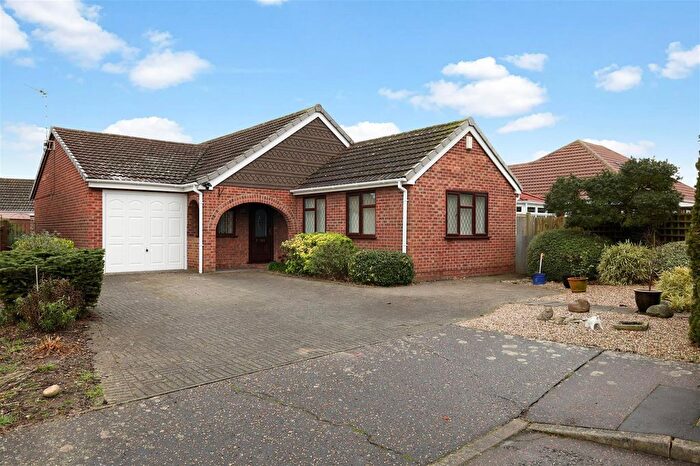
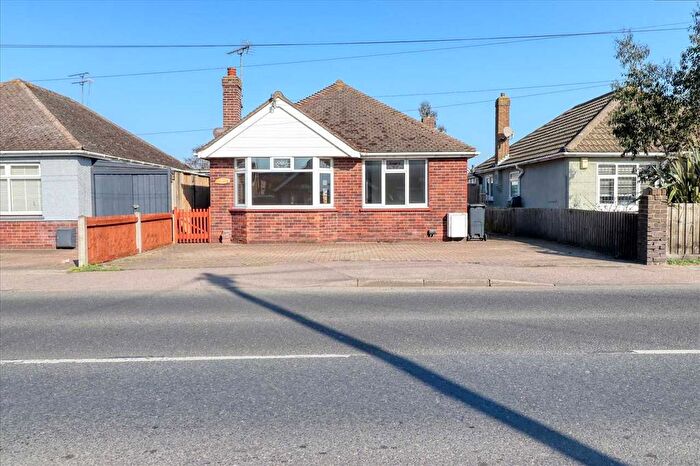
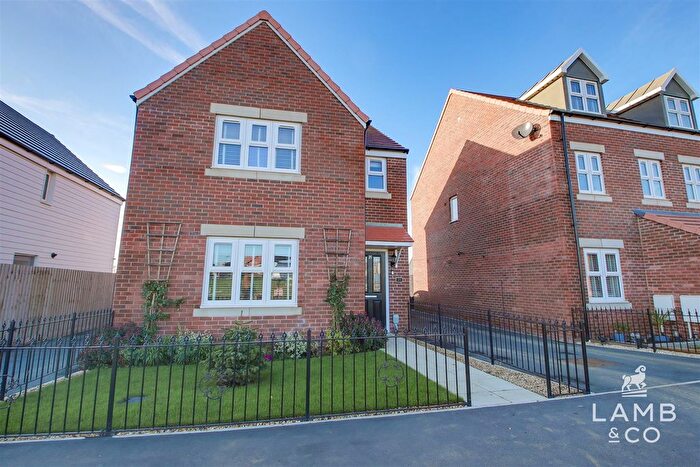
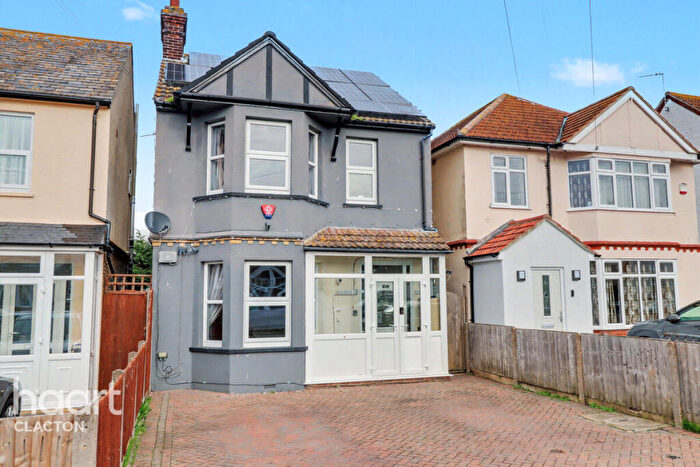
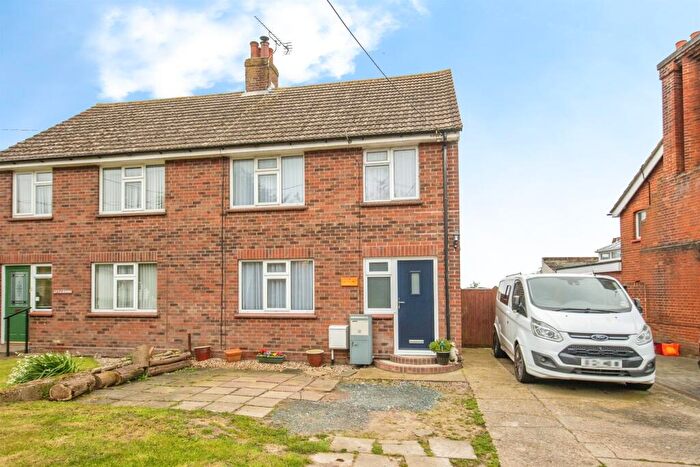
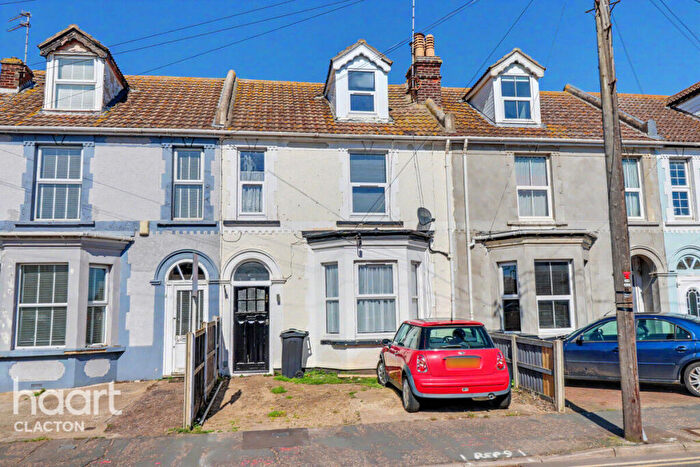
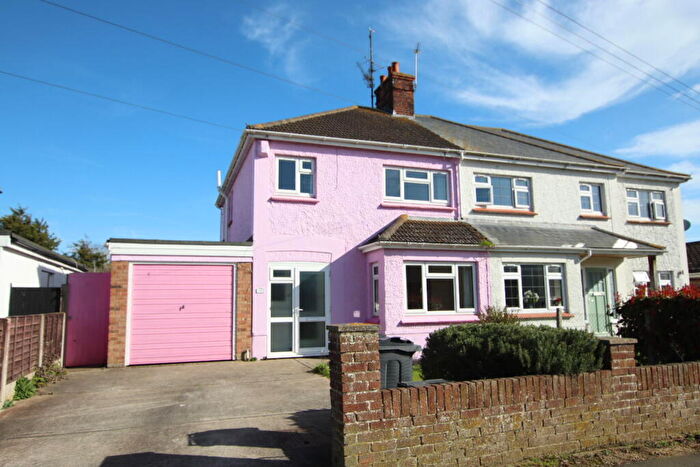
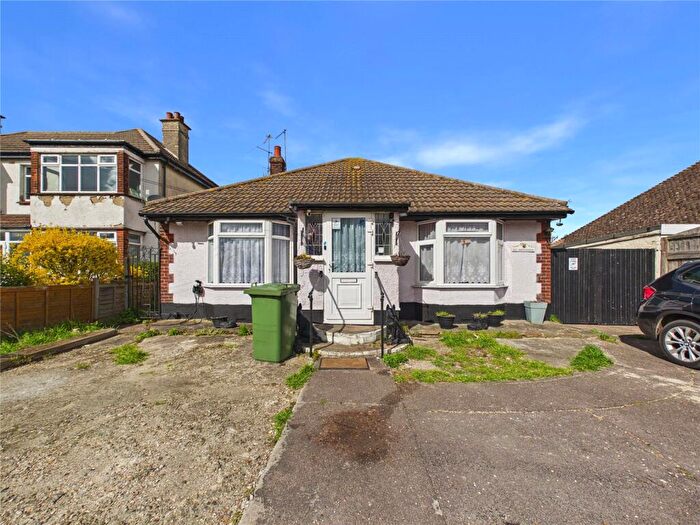
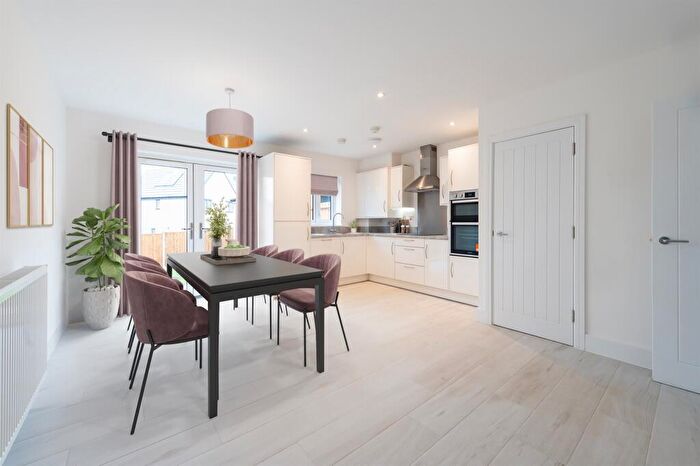
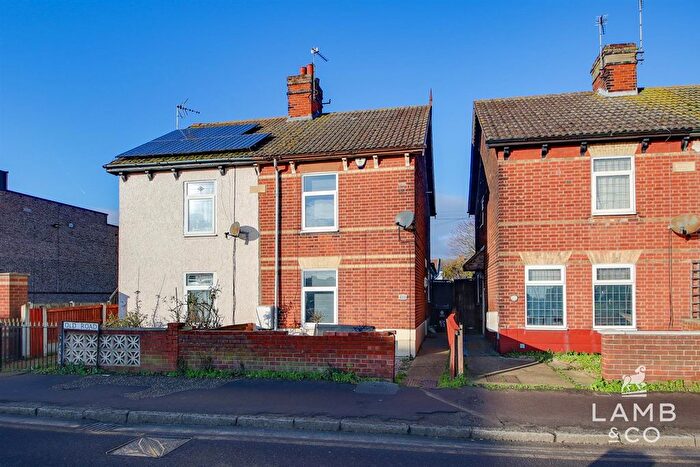
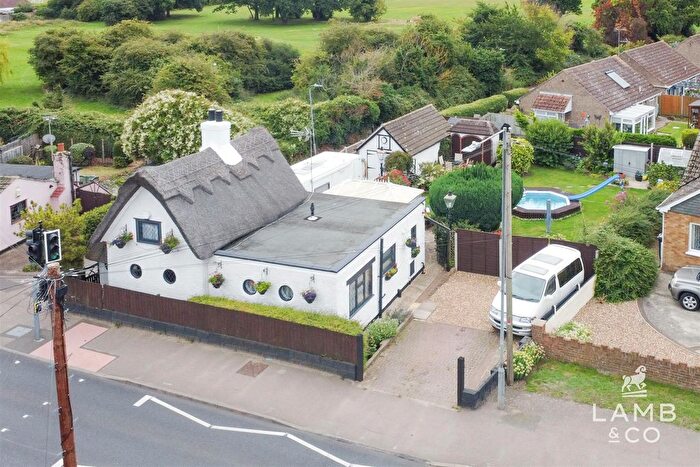
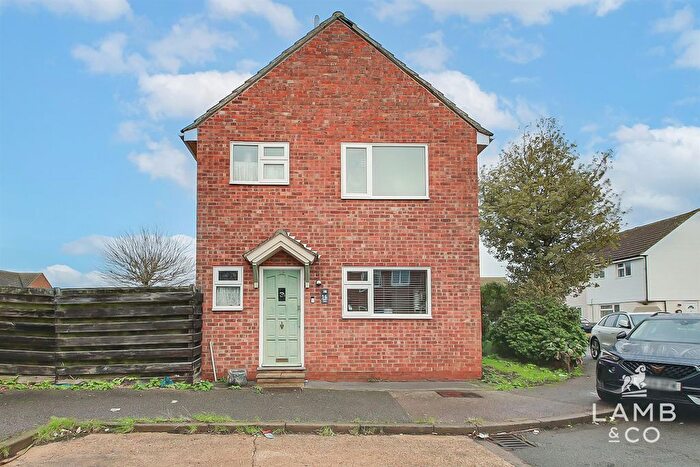
Properties for sale in Clacton-on-sea
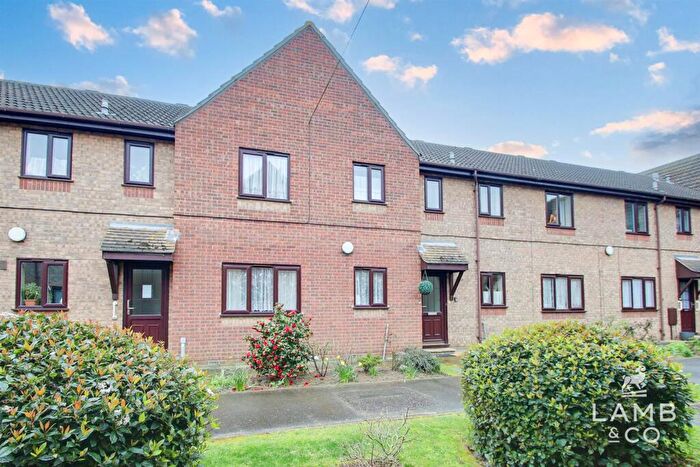
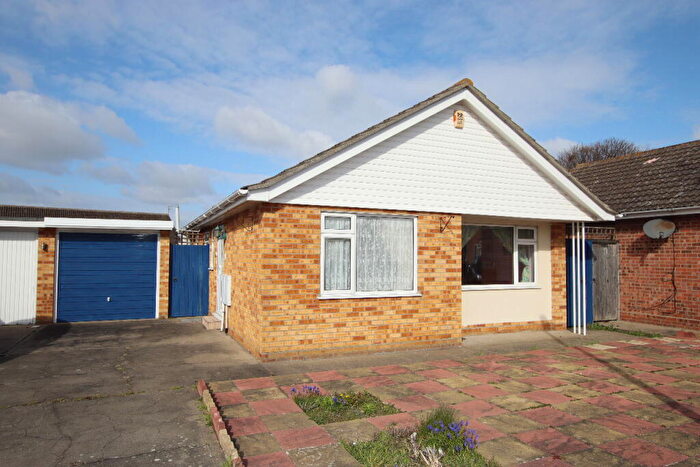
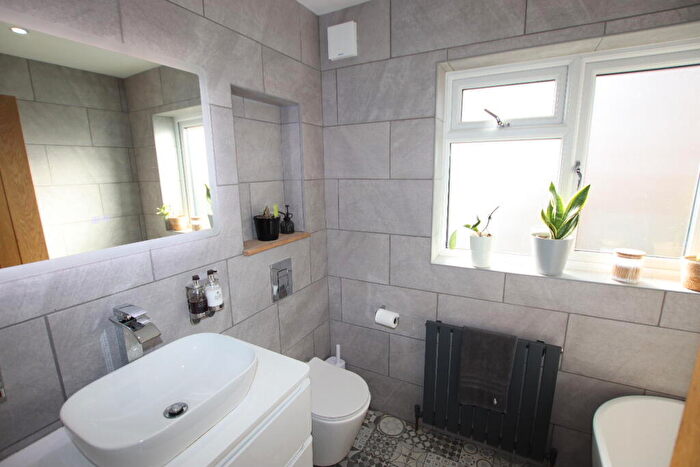
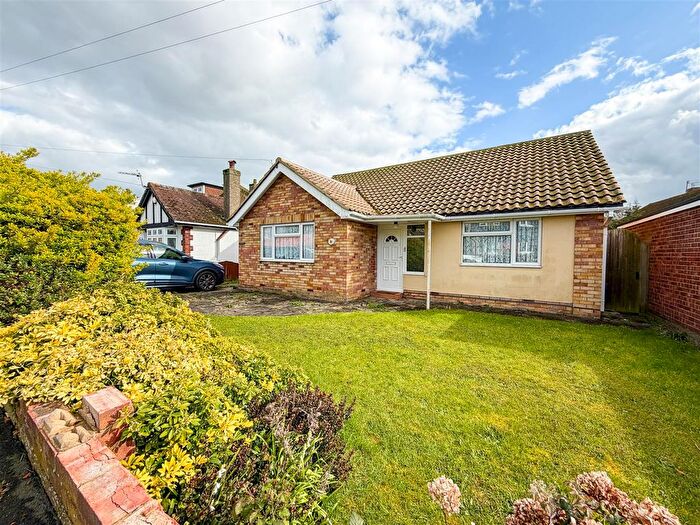
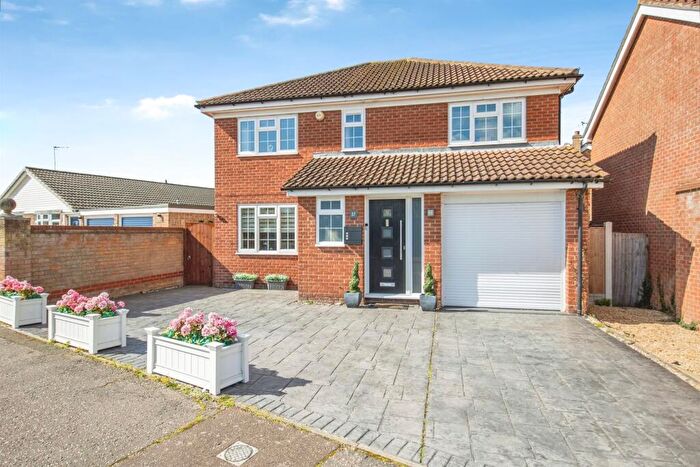
![]()
If you are looking to sell your house, let it out, or receive a property valuation, an expert can help you.
Click the button below to get started.
Neighbourhoods in Clacton-on-sea
Navigate through our locations to find the location of your next house in Clacton-on-sea, Essex for sale or to rent.
- Alton Park
- Beaumont And Thorpe
- Bockings Elm
- Burrsville
- Golf Green
- Haven
- Little Clacton And Weeley
- Manningtree, Mistley, Little Bentley And Tendring
- Peter Bruff
- Pier
- Rush Green
- St Bartholomews
- St James
- St Johns
- St Marys
- St Osyth And Point Clear
- St Pauls
- Coppins
- West Clacton & Jaywick Sands
- Thorpe, Beaumont & Great Holland
- Weeley & Tendring
- Bluehouse
- St Osyth
- Little Clacton
- Eastcliff
- Cann Hall
Transport in Clacton-on-sea
Please see below transportation links in this area:
-
 Clacton Station
 -
Thorpe-le-Soken Station
-
Weeley Station
-
Kirby Cross Station
-
Great Bentley Station
-
Frinton Station
- FAQ
- Price Paid By Year
- Property Type Price
Frequently asked questions about Clacton-on-sea
What is the average price for a property for sale in Clacton-on-sea?
The average price for a property for sale in Clacton-on-sea is £256,240. This amount is 37% lower than the average price in Essex. There are more than 10,000 property listings for sale in Clacton-on-sea.
What locations have the most expensive properties for sale in Clacton-on-sea?
The locations with the most expensive properties for sale in Clacton-on-sea are Manningtree, Mistley, Little Bentley And Tendring at an average of £585,052, Weeley & Tendring at an average of £522,404 and St Osyth at an average of £481,032.
What locations have the most affordable properties for sale in Clacton-on-sea?
The locations with the most affordable properties for sale in Clacton-on-sea are Golf Green at an average of £158,515, Pier at an average of £171,085 and Cann Hall at an average of £180,000.
Which train stations are available in or near Clacton-on-sea?
Some of the train stations available in or near Clacton-on-sea are Clacton, Thorpe-le-Soken and Weeley.
Property Price Paid in Clacton-on-sea by Year
The average sold property price by year was:
| Year | Average Sold Price | Price Change |
Sold Properties
|
|---|---|---|---|
| 2026 | £274,234 | 5% |
32 Properties |
| 2025 | £260,524 | 4% |
1,043 Properties |
| 2024 | £250,093 | -3% |
1,238 Properties |
| 2023 | £258,576 | -8% |
1,098 Properties |
| 2022 | £278,695 | 9% |
1,491 Properties |
| 2021 | £253,061 | 7% |
1,952 Properties |
| 2020 | £235,055 | 4% |
1,367 Properties |
| 2019 | £224,948 | 3% |
1,445 Properties |
| 2018 | £219,052 | 2% |
1,428 Properties |
| 2017 | £214,039 | 13% |
1,603 Properties |
| 2016 | £185,732 | 7% |
1,660 Properties |
| 2015 | £173,079 | 7% |
1,714 Properties |
| 2014 | £161,336 | 4% |
1,704 Properties |
| 2013 | £154,159 | 0,4% |
1,192 Properties |
| 2012 | £153,470 | 1% |
958 Properties |
| 2011 | £151,923 | -2% |
1,058 Properties |
| 2010 | £155,590 | 6% |
971 Properties |
| 2009 | £145,682 | -18% |
991 Properties |
| 2008 | £172,605 | 2% |
1,006 Properties |
| 2007 | £169,353 | 5% |
2,001 Properties |
| 2006 | £160,668 | 6% |
1,981 Properties |
| 2005 | £151,698 | 3% |
1,670 Properties |
| 2004 | £147,887 | 12% |
2,067 Properties |
| 2003 | £129,753 | 17% |
1,947 Properties |
| 2002 | £108,068 | 19% |
2,317 Properties |
| 2001 | £88,071 | 15% |
2,289 Properties |
| 2000 | £75,105 | 14% |
2,176 Properties |
| 1999 | £64,433 | 11% |
2,281 Properties |
| 1998 | £57,401 | 10% |
2,059 Properties |
| 1997 | £51,727 | 8% |
2,106 Properties |
| 1996 | £47,651 | -3% |
1,902 Properties |
| 1995 | £49,026 | - |
1,519 Properties |
Property Price per Property Type in Clacton-on-sea
Here you can find historic sold price data in order to help with your property search.
The average Property Paid Price for specific property types in the last three years are:
| Property Type | Average Sold Price | Sold Properties |
|---|---|---|
| Semi Detached House | £247,961.00 | 1,026 Semi Detached Houses |
| Terraced House | £213,424.00 | 352 Terraced Houses |
| Detached House | £313,482.00 | 1,511 Detached Houses |
| Flat | £135,689.00 | 522 Flats |