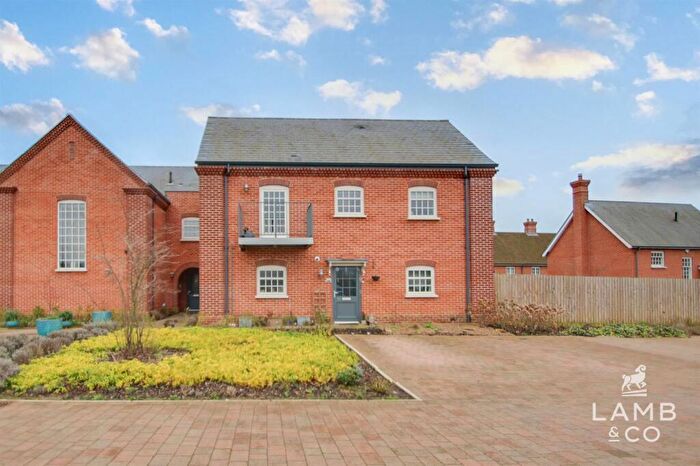
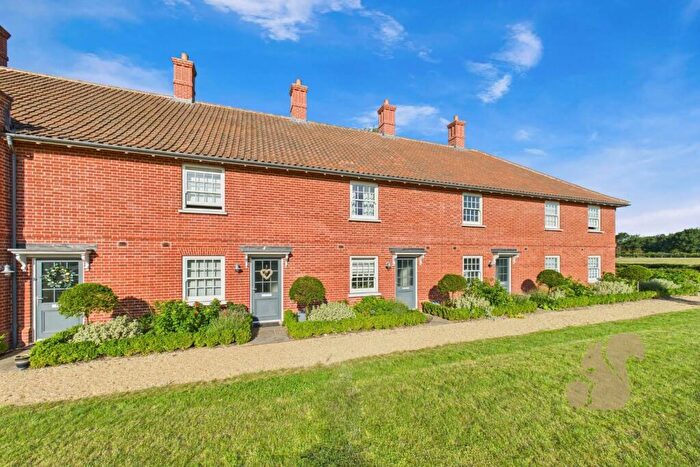
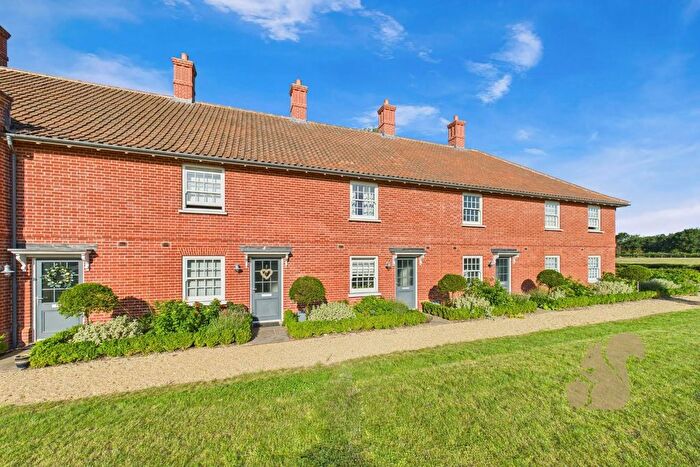
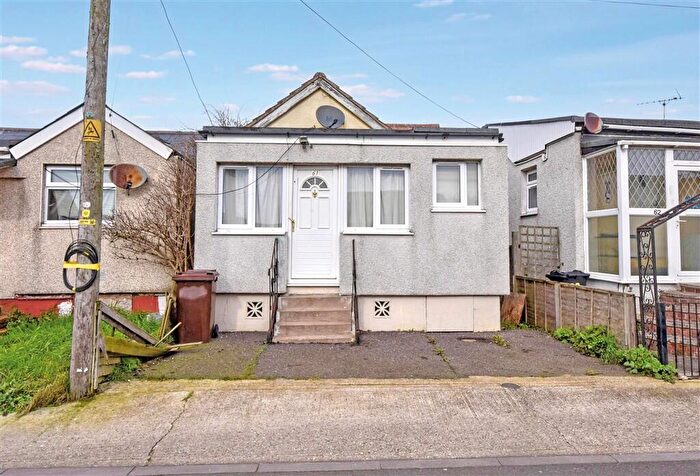
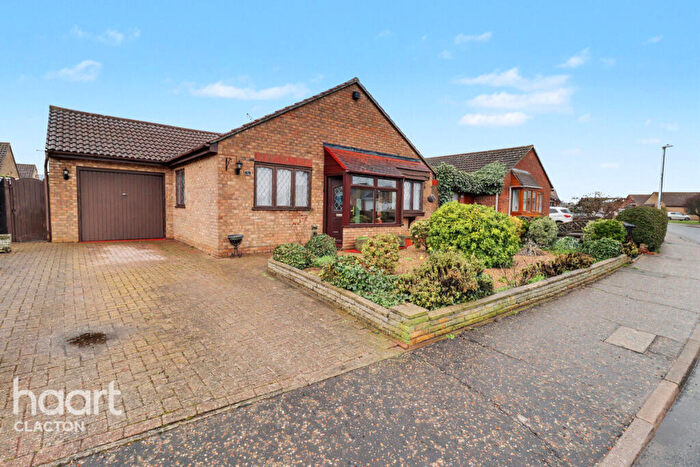
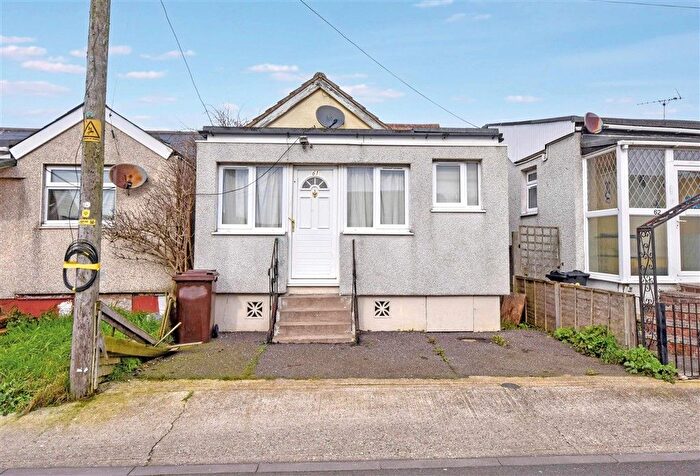
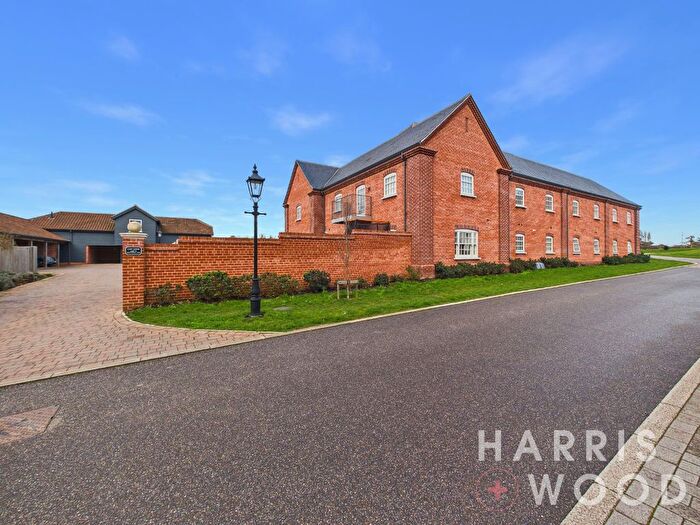
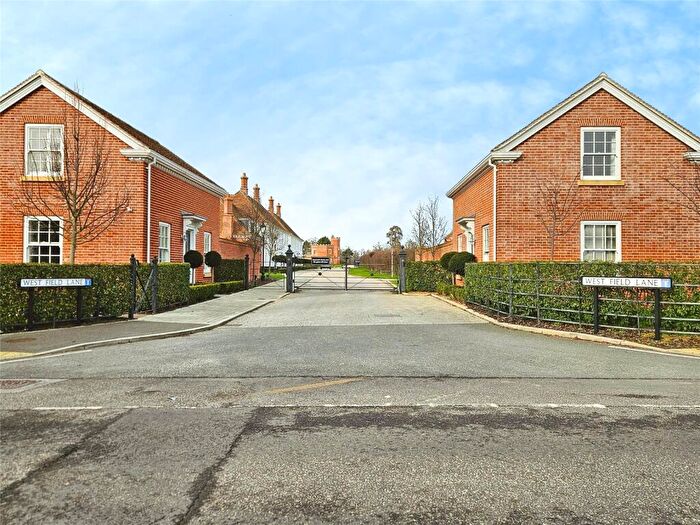
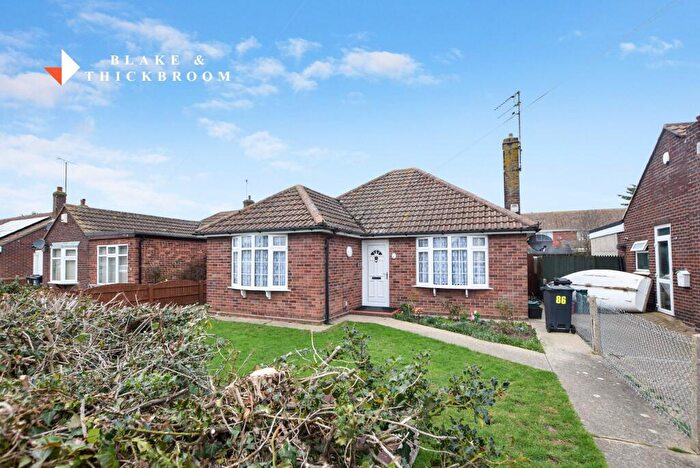
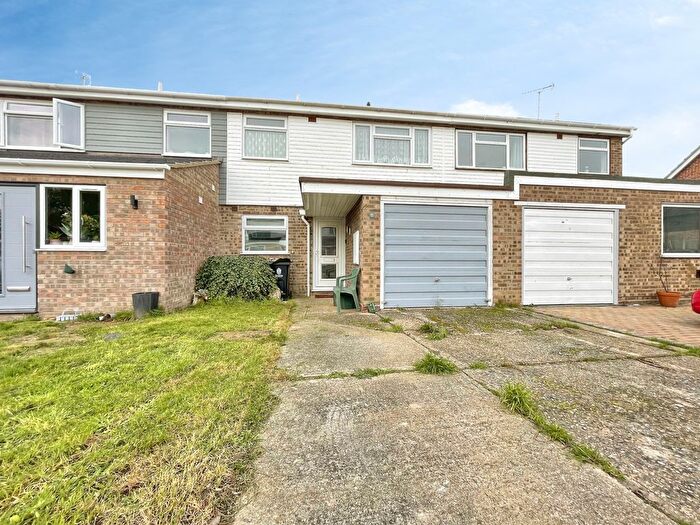
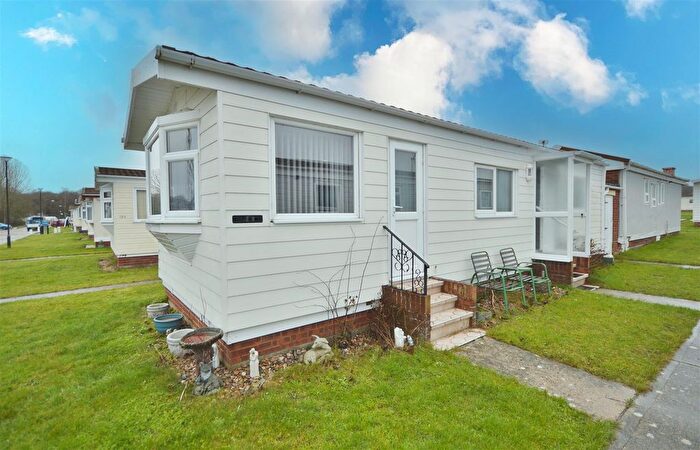
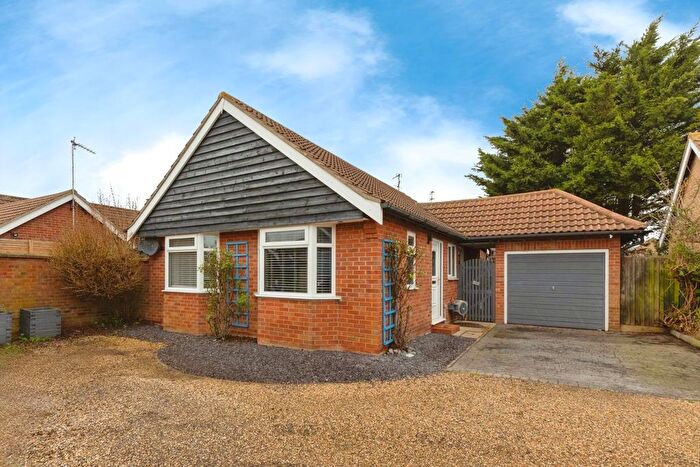
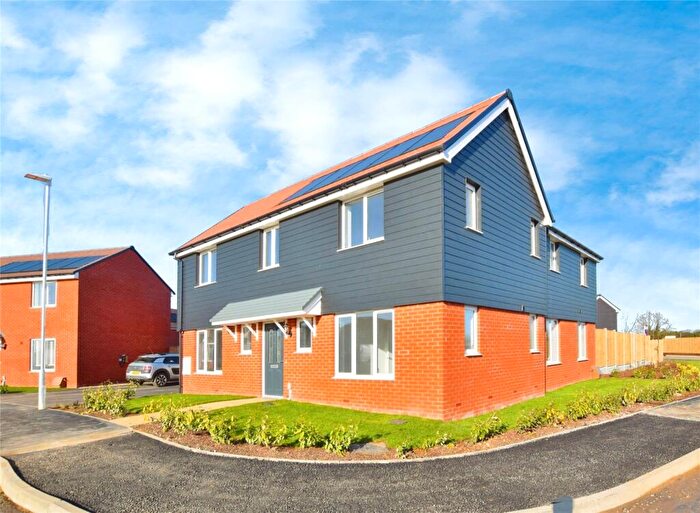
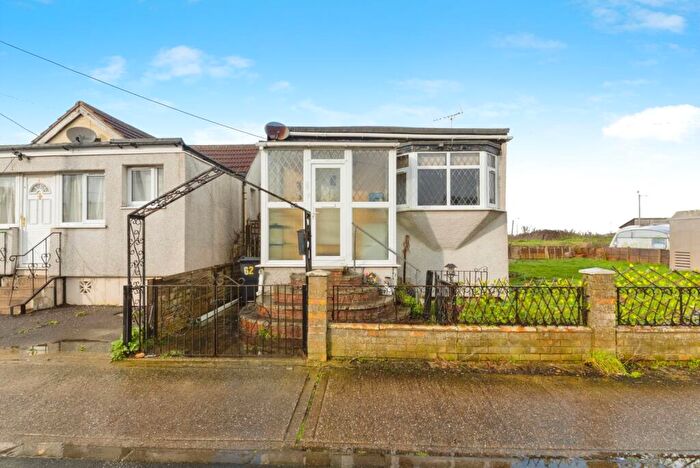
Houses for sale & to rent in St Osyth, Clacton-on-sea
House Prices in St Osyth
Properties in St Osyth have an average house price of £481,032.00 and had 31 Property Transactions within the last 3 years¹.
St Osyth is an area in Clacton-on-sea, Essex with 124 households², where the most expensive property was sold for £785,000.00.
Properties for sale in St Osyth
Roads and Postcodes in St Osyth
Navigate through our locations to find the location of your next house in St Osyth, Clacton-on-sea for sale or to rent.
| Streets | Postcodes |
|---|---|
| Beach Approach | CO16 8SP |
| Beach Road | CO16 8TB |
| Castle Way | CO16 8RA |
| Clacton Road | CO16 8HE CO16 8HF |
| Clinton Close | CO16 8AF |
| Cockett Wick Lane | CO16 8SE |
| Colchester Road | CO16 8HP CO16 8HW |
| Colne Way | CO16 8GT |
| Cow Lane | CO16 8JH |
| Daltes Lane | CO16 8SA |
| Frowick Lane | CO16 8HJ CO16 8HL |
| Golding Way | CO16 8TD |
| High Birch Road | CO16 9AB |
| Honey Pot Lane | CO16 9BJ CO16 9BQ |
| Kincaid Road | CO16 8QZ |
| Maypole Drive | CO16 8QS |
| Meadow View | CO16 8PQ |
| Melinda Lane | CO16 8HX |
| North Wall | CO16 8NJ |
| Park Drive | CO16 8GZ |
| South Close | CO16 8QT |
| Spring Road | CO16 8PY |
| St Johns Road | CO16 8LQ CO16 8LR |
| West Field Lane | CO16 8GW |
| CO16 8EH CO16 8LJ CO16 8NZ |
Transport near St Osyth
- FAQ
- Price Paid By Year
- Property Type Price
Frequently asked questions about St Osyth
What is the average price for a property for sale in St Osyth?
The average price for a property for sale in St Osyth is £481,032. This amount is 88% higher than the average price in Clacton-on-sea. There are 5,029 property listings for sale in St Osyth.
Which train stations are available in or near St Osyth?
Some of the train stations available in or near St Osyth are Clacton, Great Bentley and Weeley.
Property Price Paid in St Osyth by Year
The average sold property price by year was:
| Year | Average Sold Price | Price Change |
Sold Properties
|
|---|---|---|---|
| 2025 | £623,748 | 22% |
4 Properties |
| 2024 | £484,000 | 6% |
5 Properties |
| 2023 | £454,409 | 18% |
22 Properties |
| 2022 | £373,496 | 1% |
15 Properties |
| 2021 | £370,368 | 7% |
19 Properties |
| 2020 | £344,408 | 11% |
17 Properties |
| 2017 | £307,000 | 64% |
1 Property |
| 2016 | £110,000 | -6% |
1 Property |
| 2015 | £117,000 | 81% |
1 Property |
| 2011 | £22,500 | -811% |
1 Property |
| 2009 | £205,000 | 85% |
1 Property |
| 2008 | £31,000 | -70% |
1 Property |
| 2003 | £52,750 | 69% |
2 Properties |
| 2002 | £16,500 | -360% |
2 Properties |
| 2001 | £75,975 | 87% |
2 Properties |
| 1998 | £9,750 | 23% |
2 Properties |
| 1997 | £7,500 | -700% |
1 Property |
| 1996 | £60,000 | 86% |
1 Property |
| 1995 | £8,500 | - |
2 Properties |
Property Price per Property Type in St Osyth
Here you can find historic sold price data in order to help with your property search.
The average Property Paid Price for specific property types in the last three years are:
| Property Type | Average Sold Price | Sold Properties |
|---|---|---|
| Semi Detached House | £404,583.00 | 6 Semi Detached Houses |
| Flat | £271,999.00 | 5 Flats |
| Terraced House | £422,000.00 | 5 Terraced Houses |
| Detached House | £600,966.00 | 15 Detached Houses |

