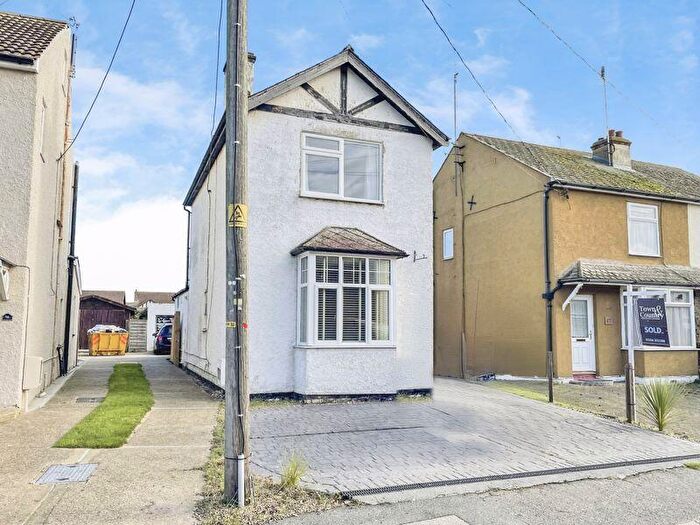
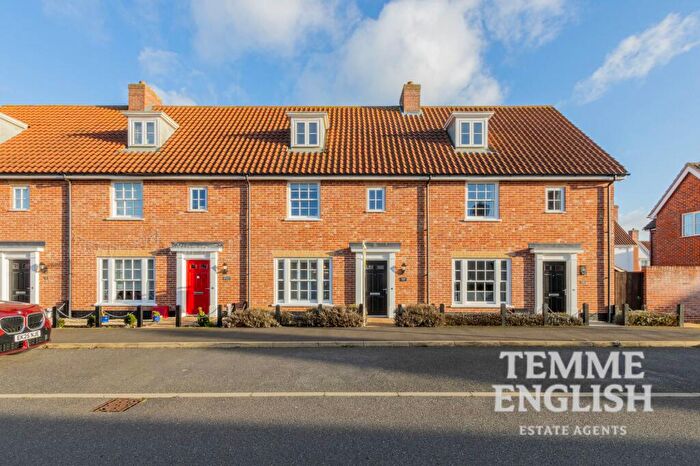
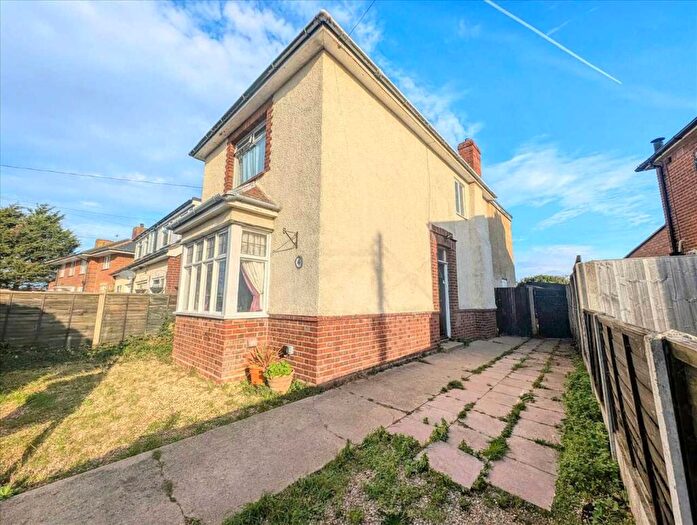
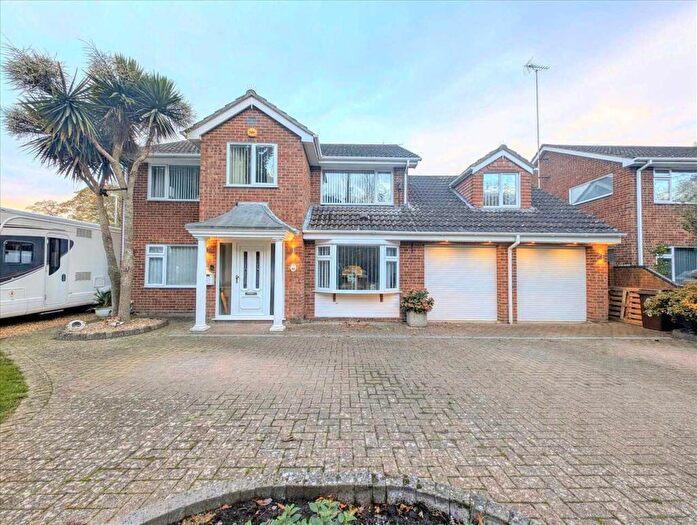
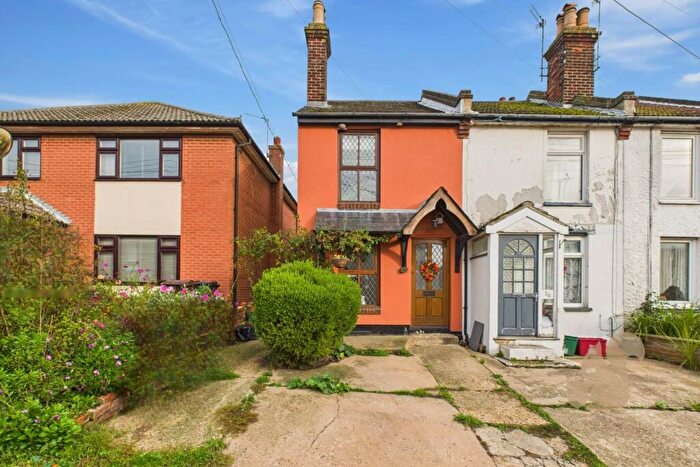
Houses for sale & to rent in Brightlingsea, Colchester
House Prices in Brightlingsea
Properties in Brightlingsea have an average house price of £278,684.00 and had 571 Property Transactions within the last 3 years¹.
Brightlingsea is an area in Colchester, Essex with 3,628 households², where the most expensive property was sold for £725,000.00.
Properties for sale in Brightlingsea
Roads and Postcodes in Brightlingsea
Navigate through our locations to find the location of your next house in Brightlingsea, Colchester for sale or to rent.
| Streets | Postcodes |
|---|---|
| Albert Road | CO7 0NB |
| Anne Close | CO7 0LS |
| Ash Close | CO7 0JY |
| Back Waterside Lane | CO7 0EQ |
| Bateman Road | CO7 0SG |
| Bayard Avenue | CO7 0NH |
| Beacon Close | CO7 0LF |
| Beaumont Avenue | CO7 0NG |
| Bell Green | CO7 0SS |
| Bellfield Avenue | CO7 0NT CO7 0NX |
| Bellfield Close | CO7 0NU |
| Beriffe Place | CO7 0NP |
| Birch Close | CO7 0LE |
| Blind Lane | CO7 0GY |
| Brian House Court | CO7 0FL |
| Campernell Close | CO7 0TA CO7 0TB |
| Cedar Avenue | CO7 0JZ |
| Chapel Mews | CO7 0FJ |
| Chapel Road | CO7 0HB CO7 0HD CO7 0HE |
| Chapman Close | CO7 0FS |
| Charles Road | CO7 0LT |
| Chestnut Way | CO7 0UA CO7 0UH |
| Church Road | CO7 0JE CO7 0JF CO7 0QH CO7 0QJ CO7 0QP CO7 0QT CO7 0QU CO7 0RZ CO7 0GG CO7 0QG CO7 0QL |
| Churchill Close | CO7 0RS |
| Cinque Port Road | CO7 0PX CO7 0QA |
| Colne Road | CO7 0DL CO7 0DU |
| Copperas Road | CO7 0AP |
| Creekhurst Close | CO7 0ET |
| Darcy Way | CO7 0LN |
| Deal Way | CO7 0RR |
| Dean Street | CO7 0JH CO7 0JJ |
| Dover Road | CO7 0PS CO7 0PU |
| Duke Street | CO7 0EA CO7 0BS |
| East End Green | CO7 0SX |
| Eastern Road | CO7 0HU |
| Edward Avenue | CO7 0LZ |
| Elizabeth Way | CO7 0LR |
| Elm Drive | CO7 0LA |
| Fair Close | CO7 0EN |
| Fieldgate Dock | CO7 0BA CO7 0BL |
| Florence Place | CO7 0FR |
| Folkards Lane | CO7 0SP |
| Fordwich Road | CO7 0RE |
| Francis Street | CO7 0DG |
| George Avenue | CO7 0NE |
| Granville Way | CO7 0SY |
| Greenhurst Road | CO7 0EX |
| Hall Cut | CO7 0BY |
| Harbour Square | CO7 0GE |
| Hastings Place | CO7 0PB |
| Haven Village | CO7 0LW |
| Hazel Mews | CO7 0UZ |
| High Street | CO7 0AE CO7 0AG CO7 0AQ CO7 0EG |
| Hill House Court | CO7 0HF |
| Hurst Close | CO7 0ER |
| Hurst Green | CO7 0EH CO7 0EZ CO7 0HA CO7 0HG |
| Hythe Grove | CO7 0RD |
| James Street | CO7 0DA |
| John Street | CO7 0NA CO7 0NQ |
| Keats Crescent | CO7 0FT |
| Kent Close | CO7 0PZ |
| Kirkhurst Close | CO7 0EY |
| Ladysmith Avenue | CO7 0JB CO7 0JD |
| Lime Street | CO7 0BH |
| Lodge Road | CO7 0JQ |
| Love Lane | CO7 0QQ |
| Lower Farm Lane | CO7 0SU |
| Lower Park Road | CO7 0JS CO7 0JX CO7 0LQ CO7 0HP CO7 0LG |
| Maltings Road | CO7 0RG |
| Manor House Way | CO7 0QN CO7 0QR |
| Marennes Crescent | CO7 0RU CO7 0RX |
| Margaret Close | CO7 0PA |
| Marsh Way | CO7 0LH |
| Middleton Mews | CO7 0FU CO7 0FZ |
| Mill Street | CO7 0EJ CO7 0EL CO7 0SZ |
| Morses Lane | CO7 0SD CO7 0SF CO7 0SQ |
| Moverons Lane | CO7 0SA CO7 0SB |
| Nelson Street | CO7 0DN CO7 0DZ |
| New Park Gardens | CO7 0PQ |
| New Street | CO7 0BZ CO7 0DD CO7 0DH CO7 0DJ |
| North Road | CO7 0PL |
| Olde Forge | CO7 0QZ |
| Ophir Road | CO7 0GZ |
| Osbornes Court | CO7 0EB |
| Oyster Tank Road | CO7 0DW CO7 0DY |
| Oysters Reach | CO7 0HY |
| Pannell Place | CO7 0FW |
| Park Drive | CO7 0JT CO7 0JU CO7 0UB CO7 0UD |
| Pertwee Close | CO7 0RT |
| Planton Way | CO7 0LB |
| Promenade Way | CO7 0HH CO7 0HJ |
| Pyefleet Close | CO7 0LL |
| Queen Street | CO7 0PH |
| Recreation Way | CO7 0NJ |
| Red Barn Close | CO7 0FA |
| Red Barn Road | CO7 0HX CO7 0SH CO7 0SJ CO7 0SL CO7 0SN |
| Regent Close | CO7 0NY |
| Regent Road | CO7 0NL CO7 0NN CO7 0NR CO7 0NW CO7 0NZ |
| Richard Avenue | CO7 0LP CO7 0LX |
| Robinson Road | CO7 0ST |
| Romney Close | CO7 0RJ |
| Rye Close | CO7 0RA |
| Samsons Close | CO7 0RP |
| Samsons Road | CO7 0RB CO7 0RL CO7 0RN CO7 0RW |
| Sandwich Road | CO7 0PT |
| Sarre Way | CO7 0RQ |
| Seaview Gardens | CO7 0PW |
| Seaview Road | CO7 0PP CO7 0PR |
| Shipyard Estate | CO7 0AR |
| Silcott Street | CO7 0DP CO7 0DR CO7 0DS |
| Southways | CO7 0NS |
| Spring Chase | CO7 0JR |
| Spring Road | CO7 0PJ CO7 0PN |
| Springfields | CO7 0LU |
| St Andrews Place | CO7 0RH |
| Stanley Avenue | CO7 0ND |
| Station Road | CO7 0BT CO7 0DF CO7 0DT |
| Stephens Drive | CO7 0FN |
| Stoney Lane | CO7 0SR |
| Sycamore Mews | CO7 0FQ |
| Sydney Street | CO7 0BD CO7 0BE CO7 0BG CO7 0HN CO7 0FG CO7 0GH |
| Tabor Close | CO7 0QS |
| The Grove | CO7 0QX |
| The Mead | CO7 0UL |
| The Woodlands | CO7 0RY |
| Thomas Street | CO7 0FD |
| Tower Cut | CO7 0AJ |
| Tower Street | CO7 0AL CO7 0AN CO7 0AW |
| Tudor Close | CO7 0QW |
| Upper Park Road | CO7 0JG CO7 0JL CO7 0JP |
| Victoria Place | CO7 0AB CO7 0BP CO7 0BX CO7 0AA CO7 0HT |
| Walmer Close | CO7 0PE |
| Walnut Way | CO7 0LJ |
| Waterside | CO7 0AX CO7 0AY CO7 0AZ CO7 0BB CO7 0FH CO7 0AU CO7 0FX CO7 0FY |
| Waterside Marina | CO7 0GA CO7 0GB CO7 0GD CO7 0FE CO7 0FF CO7 0GF |
| Well Street | CO7 0JN CO7 0JW |
| Wellington Street | CO7 0DB |
| Western Road | CO7 0HZ |
| Whitegate Road | CO7 0EP CO7 0ES CO7 0EU |
| Wilfreds Way | CO7 0FP |
| Willow Close | CO7 0LD |
| Winchelsea Place | CO7 0PD |
| Windsor Court | CO7 0QB |
| York Road | CO7 0JA |
| CO7 5AN CO7 5AP CO7 5AQ CO7 8WG CO7 5AR CO7 5AX CO7 5AY |
Transport near Brightlingsea
- FAQ
- Price Paid By Year
- Property Type Price
Frequently asked questions about Brightlingsea
What is the average price for a property for sale in Brightlingsea?
The average price for a property for sale in Brightlingsea is £278,684. This amount is 20% lower than the average price in Colchester. There are 964 property listings for sale in Brightlingsea.
What streets have the most expensive properties for sale in Brightlingsea?
The streets with the most expensive properties for sale in Brightlingsea are Robinson Road at an average of £543,333, Love Lane at an average of £530,000 and Church Road at an average of £499,600.
What streets have the most affordable properties for sale in Brightlingsea?
The streets with the most affordable properties for sale in Brightlingsea are Haven Village at an average of £68,000, Springfields at an average of £120,142 and Hill House Court at an average of £132,500.
Which train stations are available in or near Brightlingsea?
Some of the train stations available in or near Brightlingsea are Alresford, Great Bentley and Wivenhoe.
Property Price Paid in Brightlingsea by Year
The average sold property price by year was:
| Year | Average Sold Price | Price Change |
Sold Properties
|
|---|---|---|---|
| 2025 | £274,468 | -2% |
97 Properties |
| 2024 | £278,805 | -2% |
154 Properties |
| 2023 | £283,293 | 2% |
144 Properties |
| 2022 | £277,132 | 1% |
176 Properties |
| 2021 | £275,243 | 5% |
221 Properties |
| 2020 | £260,239 | 6% |
186 Properties |
| 2019 | £244,221 | 1% |
167 Properties |
| 2018 | £241,161 | 2% |
181 Properties |
| 2017 | £236,909 | 8% |
208 Properties |
| 2016 | £217,702 | 15% |
201 Properties |
| 2015 | £185,932 | 2% |
197 Properties |
| 2014 | £182,300 | 3% |
194 Properties |
| 2013 | £176,767 | -0,1% |
166 Properties |
| 2012 | £176,882 | 2% |
125 Properties |
| 2011 | £172,624 | 6% |
122 Properties |
| 2010 | £161,569 | 8% |
130 Properties |
| 2009 | £148,754 | -29% |
134 Properties |
| 2008 | £192,365 | -1% |
114 Properties |
| 2007 | £193,767 | 17% |
277 Properties |
| 2006 | £160,934 | 2% |
246 Properties |
| 2005 | £158,277 | 10% |
160 Properties |
| 2004 | £142,898 | 8% |
259 Properties |
| 2003 | £131,948 | 18% |
201 Properties |
| 2002 | £108,689 | 25% |
257 Properties |
| 2001 | £81,069 | 5% |
208 Properties |
| 2000 | £76,739 | 20% |
241 Properties |
| 1999 | £61,622 | -0,3% |
242 Properties |
| 1998 | £61,797 | 16% |
237 Properties |
| 1997 | £52,065 | 11% |
216 Properties |
| 1996 | £46,563 | -3% |
175 Properties |
| 1995 | £47,765 | - |
132 Properties |
Property Price per Property Type in Brightlingsea
Here you can find historic sold price data in order to help with your property search.
The average Property Paid Price for specific property types in the last three years are:
| Property Type | Average Sold Price | Sold Properties |
|---|---|---|
| Flat | £169,922.00 | 88 Flats |
| Semi Detached House | £271,233.00 | 219 Semi Detached Houses |
| Detached House | £396,826.00 | 140 Detached Houses |
| Terraced House | £235,644.00 | 124 Terraced Houses |

