
Houses for sale & to rent in Colchester, Essex
House Prices in Colchester
Properties in Colchester have an average house price of £348k and had 9,304 Property Transactions within the last 3 years.¹
Colchester is an area in Essex with 86,381 households², where the most expensive property was sold for £3.12M.
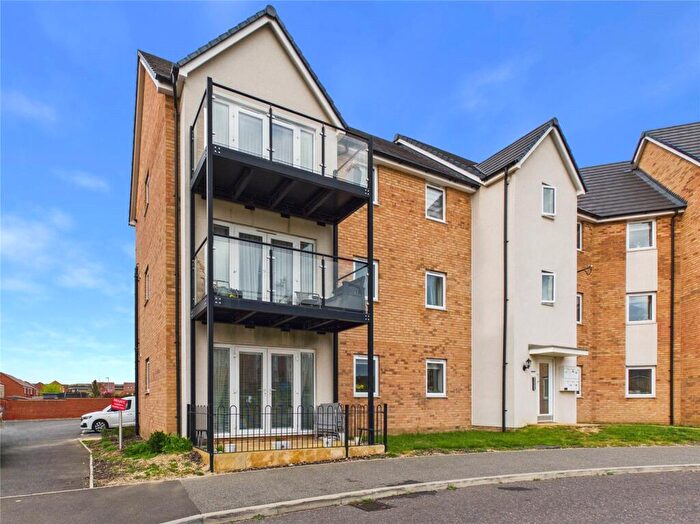
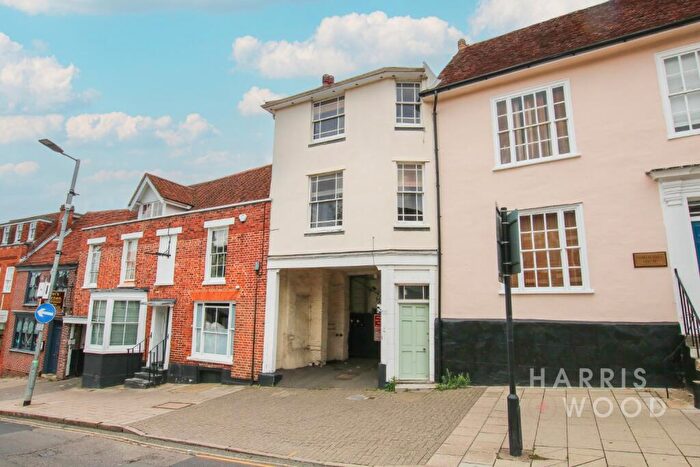
Properties for sale in Colchester
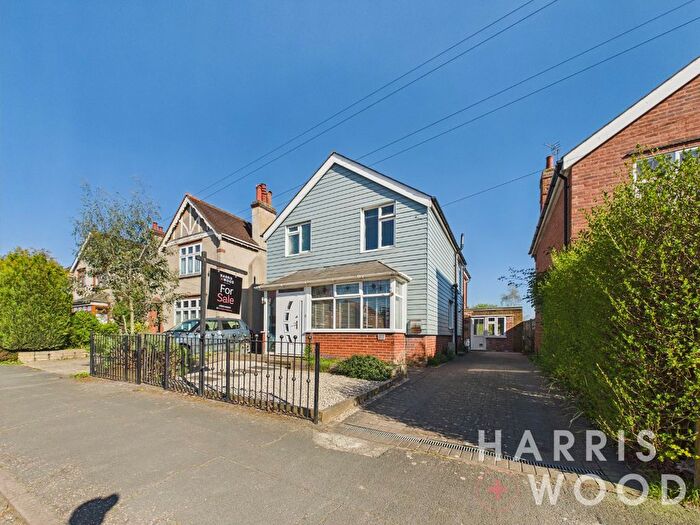


![]()
If you are looking to sell your house, let it out, or receive a property valuation, an expert can help you.
Click the button below to get started.


Neighbourhoods in Colchester
Navigate through our locations to find the location of your next house in Colchester, Essex for sale or to rent.
- Alresford
- Ardleigh And Little Bromley
- Berechurch
- Birch And Winstree
- Bradwell, Silver End And Rivenhall
- Brightlingsea
- Castle
- Christ Church
- Coggeshall And North Feering
- Copford And West Stanway
- Dedham And Langham
- East Donyland
- Fordham And Stour
- Gosfield And Greenstead Green
- Great Bentley
- Great Tey
- Great Totham
- Highwoods
- Kelvedon
- Lexden
- Manningtree, Mistley, Little Bentley And Tendring
- Marks Tey
- Mile End
- New Town
- Old Heath
- Prettygate
- Pyefleet
- Shrub End
- St Andrews
- St Annes
- St Johns
- St Osyth And Point Clear
- Stanway
- The Three Colnes
- Thorrington, Frating, Elmstead And Great Bromley
- Tiptree
- Tolleshunt Darcy
- West Bergholt And Eight Ash Green
- West Mersea
- Wivenhoe Cross
- Wivenhoe Quay
- New Town and Christ Church
- Old Heath and The Hythe
- Greenstead
- Marks Tey and Layer
- Lexden and Braiswick
- St Anne's and St John's
- Wivenhoe
- Rural North
- Ardleigh & Little Bromley
- Mersea and Pyefleet
- Kelvedon & Feering
- The Colnes
- Coggeshall
- Gosfield & Greenstead Green
- Alresford & Elmstead
- The Bentleys & Frating
- St Osyth
- Weeley & Tendring
- St John's
- Dovercourt All Saints
Transport in Colchester
Please see below transportation links in this area:

- FAQ
- Price Paid By Year
- Property Type Price
Frequently asked questions about Colchester
What is the average price for a property for sale in Colchester?
The average price for a property for sale in Colchester is £348,021. This amount is 14% lower than the average price in Essex. There are more than 10,000 property listings for sale in Colchester.
What locations have the most expensive properties for sale in Colchester?
The locations with the most expensive properties for sale in Colchester are Great Totham at an average of £1,237,500, Coggeshall at an average of £670,000 and Rural North at an average of £659,038.
What locations have the most affordable properties for sale in Colchester?
The locations with the most affordable properties for sale in Colchester are Greenstead at an average of £170,000, St Andrews at an average of £221,695 and New Town at an average of £234,959.
Which train stations are available in or near Colchester?
Some of the train stations available in or near Colchester are Colchester Town, Colchester and Hythe.
Property Price Paid in Colchester by Year
The average sold property price by year was:
| Year | Average Sold Price | Price Change |
Sold Properties
|
|---|---|---|---|
| 2026 | £360,898 | 3% |
79 Properties |
| 2025 | £350,549 | 2% |
3,075 Properties |
| 2024 | £343,495 | -2% |
3,189 Properties |
| 2023 | £349,927 | 1% |
2,961 Properties |
| 2022 | £345,933 | 4% |
3,961 Properties |
| 2021 | £333,573 | 5% |
5,344 Properties |
| 2020 | £315,883 | 7% |
3,696 Properties |
| 2019 | £293,711 | -0,4% |
4,192 Properties |
| 2018 | £294,772 | 3% |
4,632 Properties |
| 2017 | £286,172 | 8% |
4,557 Properties |
| 2016 | £264,292 | 7% |
4,884 Properties |
| 2015 | £246,105 | 9% |
4,710 Properties |
| 2014 | £223,399 | 4% |
4,616 Properties |
| 2013 | £215,485 | 2% |
3,906 Properties |
| 2012 | £211,997 | 1% |
3,329 Properties |
| 2011 | £208,875 | -0,4% |
3,192 Properties |
| 2010 | £209,692 | 7% |
3,095 Properties |
| 2009 | £194,182 | -5% |
3,086 Properties |
| 2008 | £203,030 | -4% |
2,981 Properties |
| 2007 | £210,205 | 5% |
5,775 Properties |
| 2006 | £198,667 | 4% |
5,831 Properties |
| 2005 | £191,059 | 4% |
4,562 Properties |
| 2004 | £183,846 | 12% |
5,246 Properties |
| 2003 | £162,023 | 14% |
5,128 Properties |
| 2002 | £139,618 | 17% |
5,412 Properties |
| 2001 | £115,412 | 12% |
5,112 Properties |
| 2000 | £101,452 | 14% |
4,708 Properties |
| 1999 | £87,033 | 8% |
5,199 Properties |
| 1998 | £79,759 | 11% |
4,525 Properties |
| 1997 | £71,175 | 6% |
4,768 Properties |
| 1996 | £67,228 | 5% |
3,868 Properties |
| 1995 | £64,202 | - |
3,148 Properties |
Property Price per Property Type in Colchester
Here you can find historic sold price data in order to help with your property search.
The average Property Paid Price for specific property types in the last three years are:
| Property Type | Average Sold Price | Sold Properties |
|---|---|---|
| Semi Detached House | £331,463.00 | 2,776 Semi Detached Houses |
| Terraced House | £278,434.00 | 2,126 Terraced Houses |
| Detached House | £504,701.00 | 2,866 Detached Houses |
| Flat | £181,917.00 | 1,536 Flats |