
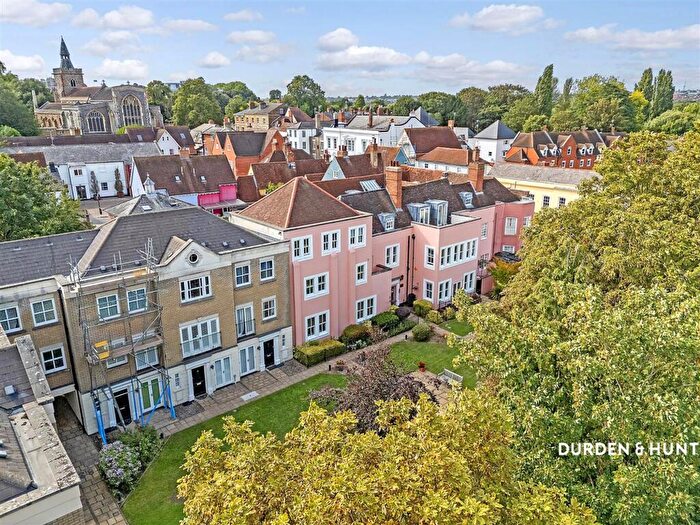
Houses for sale & to rent in Castle, Colchester
House Prices in Castle
Properties in Castle have an average house price of £251k and had 622 Property Transactions within the last 3 years¹.
Castle is an area in Colchester, Essex with 4,962 households², where the most expensive property was sold for £3.12M.
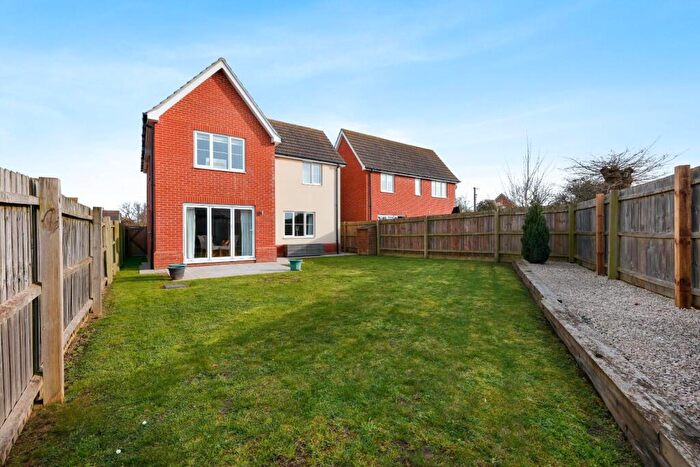
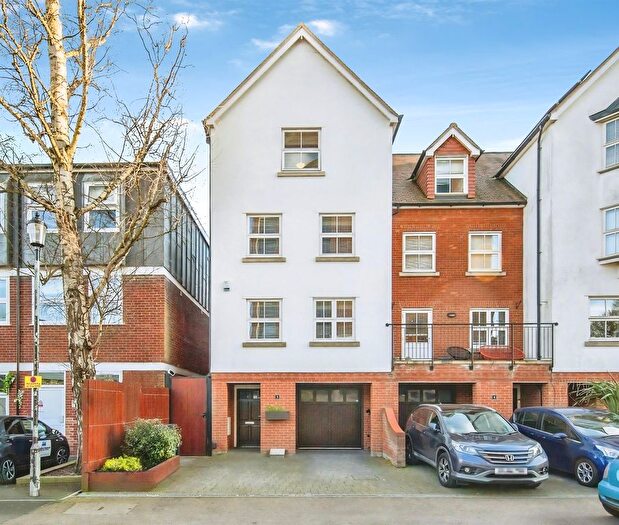
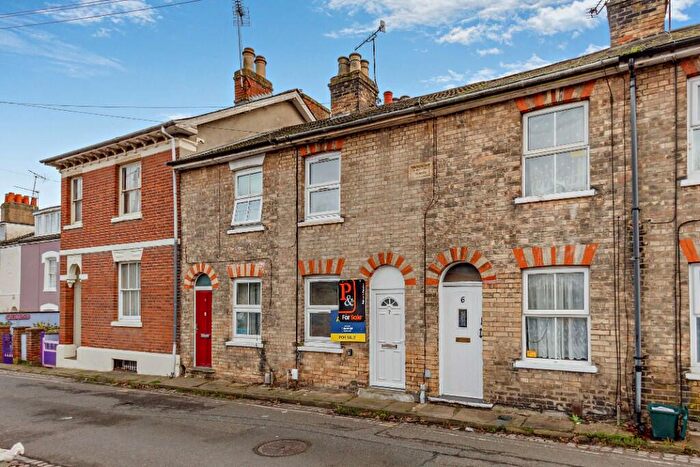
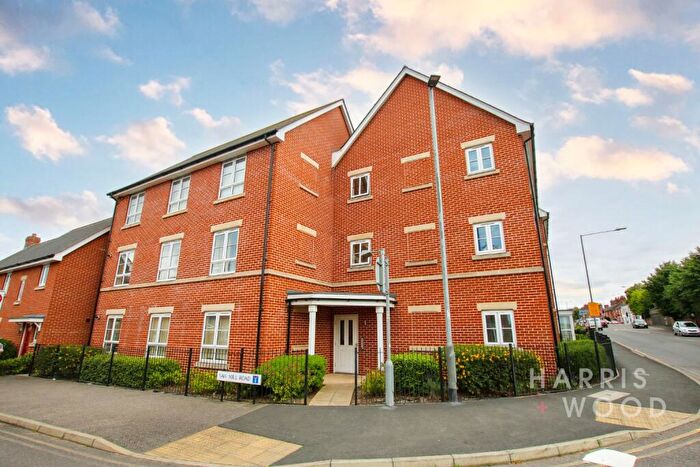
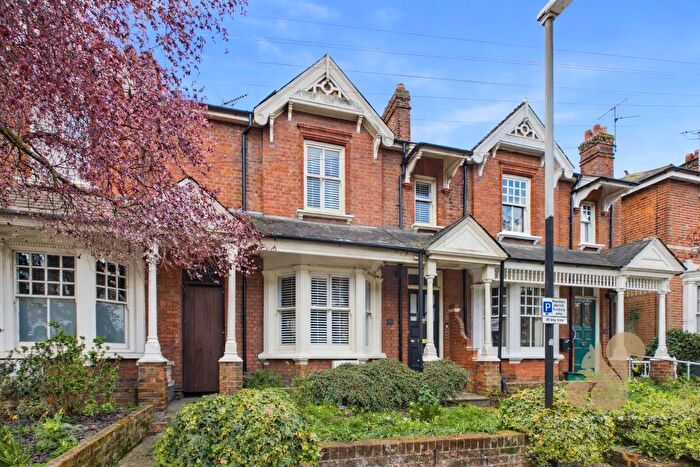
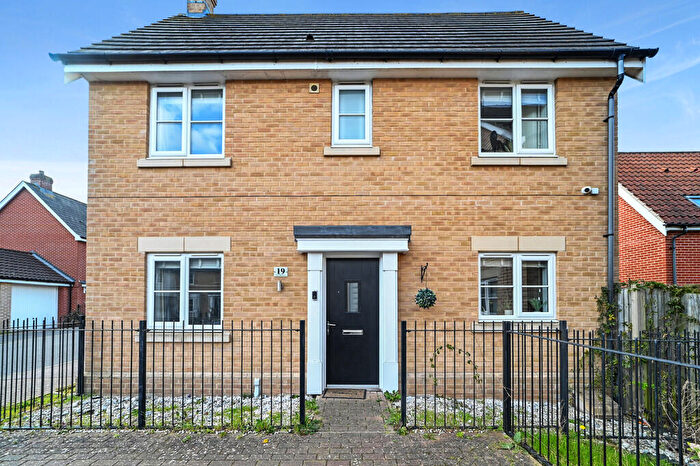
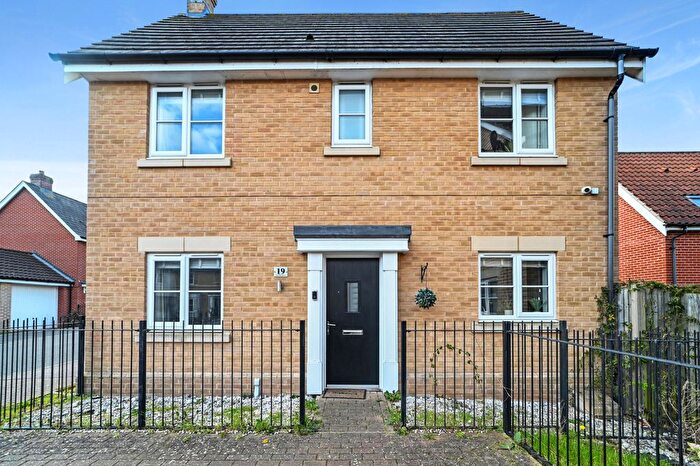
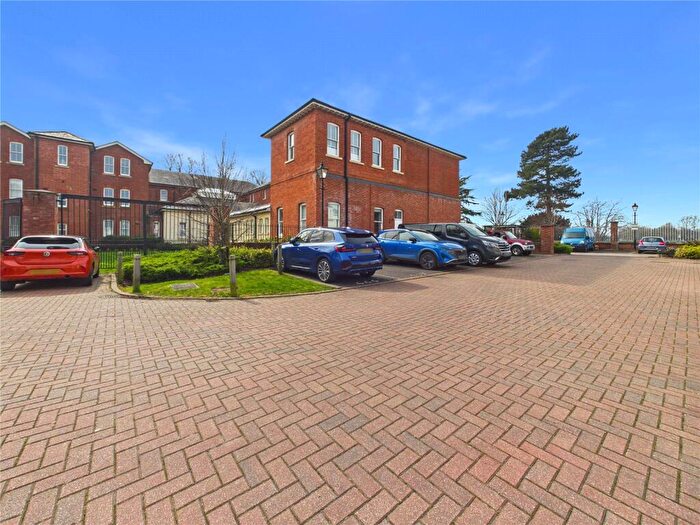
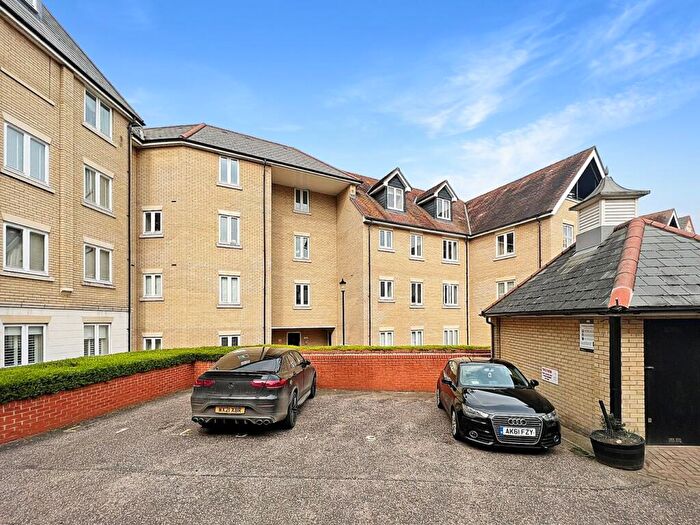
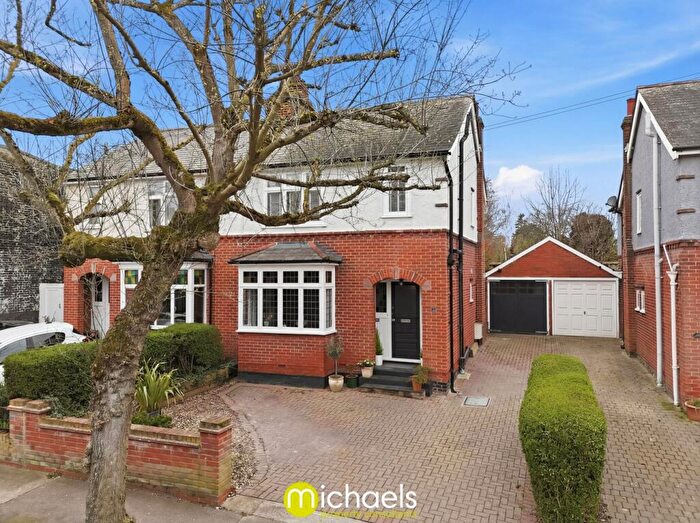
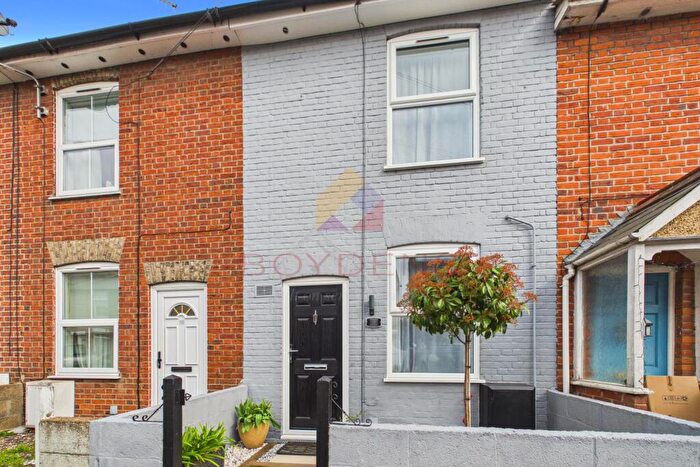
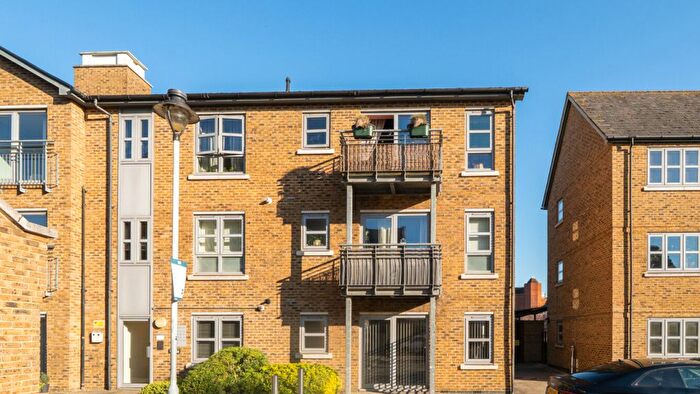
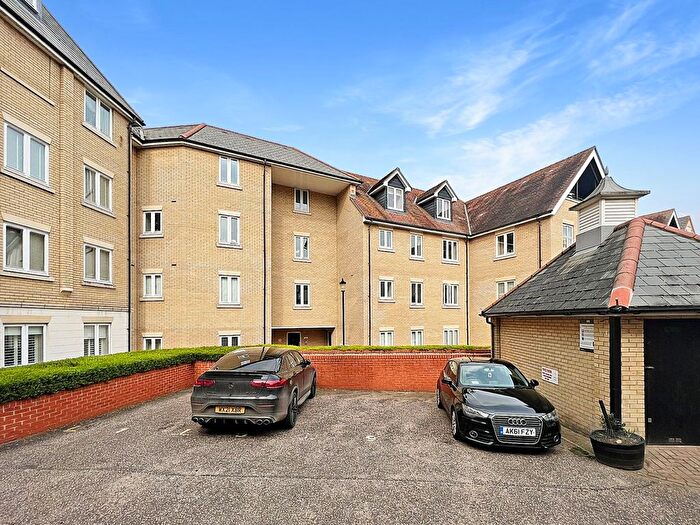
Properties for sale in Castle


![]()
If you are looking to sell your house, let it out, or receive a property valuation, an expert can help you.
Click the button below to get started.


Roads and Postcodes in Castle
Navigate through our locations to find the location of your next house in Castle, Colchester for sale or to rent.
Transport near Castle

- FAQ
- Price Paid By Year
- Property Type Price
Frequently asked questions about Castle
What is the average price for a property for sale in Castle?
The average price for a property for sale in Castle is £251,015. This amount is 28% lower than the average price in Colchester. There are 2,520 property listings for sale in Castle.
What streets have the most expensive properties for sale in Castle?
The streets with the most expensive properties for sale in Castle are Headgate at an average of £3,120,000, Lexden Road at an average of £916,500 and Oaks Drive at an average of £539,166.
What streets have the most affordable properties for sale in Castle?
The streets with the most affordable properties for sale in Castle are The Dell at an average of £88,857, Exeter Drive at an average of £96,909 and Whitewell Road at an average of £132,000.
Which train stations are available in or near Castle?
Some of the train stations available in or near Castle are Colchester Town, Colchester and Hythe.
Property Price Paid in Castle by Year
The average sold property price by year was:
| Year | Average Sold Price | Price Change |
Sold Properties
|
|---|---|---|---|
| 2026 | £281,600 | 10% |
5 Properties |
| 2025 | £254,204 | 2% |
204 Properties |
| 2024 | £248,682 | -0,3% |
210 Properties |
| 2023 | £249,470 | -1% |
203 Properties |
| 2022 | £252,488 | 4% |
310 Properties |
| 2021 | £243,286 | 10% |
301 Properties |
| 2020 | £219,830 | -4% |
222 Properties |
| 2019 | £228,546 | 8% |
262 Properties |
| 2018 | £209,451 | -3% |
335 Properties |
| 2017 | £216,516 | 8% |
334 Properties |
| 2016 | £199,664 | 10% |
420 Properties |
| 2015 | £180,163 | -5% |
304 Properties |
| 2014 | £188,853 | 7% |
311 Properties |
| 2013 | £176,414 | 1% |
238 Properties |
| 2012 | £174,300 | -5% |
205 Properties |
| 2011 | £183,794 | 7% |
174 Properties |
| 2010 | £170,020 | -7% |
198 Properties |
| 2009 | £181,716 | 12% |
244 Properties |
| 2008 | £159,989 | -21% |
259 Properties |
| 2007 | £192,850 | 5% |
438 Properties |
| 2006 | £182,482 | 4% |
543 Properties |
| 2005 | £174,666 | -1% |
346 Properties |
| 2004 | £176,475 | 18% |
368 Properties |
| 2003 | £143,977 | 14% |
377 Properties |
| 2002 | £123,695 | 23% |
356 Properties |
| 2001 | £95,013 | 17% |
342 Properties |
| 2000 | £78,571 | 9% |
327 Properties |
| 1999 | £71,761 | 13% |
336 Properties |
| 1998 | £62,256 | 10% |
275 Properties |
| 1997 | £56,204 | -4% |
280 Properties |
| 1996 | £58,191 | 14% |
219 Properties |
| 1995 | £49,858 | - |
200 Properties |
Property Price per Property Type in Castle
Here you can find historic sold price data in order to help with your property search.
The average Property Paid Price for specific property types in the last three years are:
| Property Type | Average Sold Price | Sold Properties |
|---|---|---|
| Semi Detached House | £321,859.00 | 96 Semi Detached Houses |
| Detached House | £524,785.00 | 42 Detached Houses |
| Terraced House | £277,714.00 | 204 Terraced Houses |
| Flat | £166,207.00 | 280 Flats |