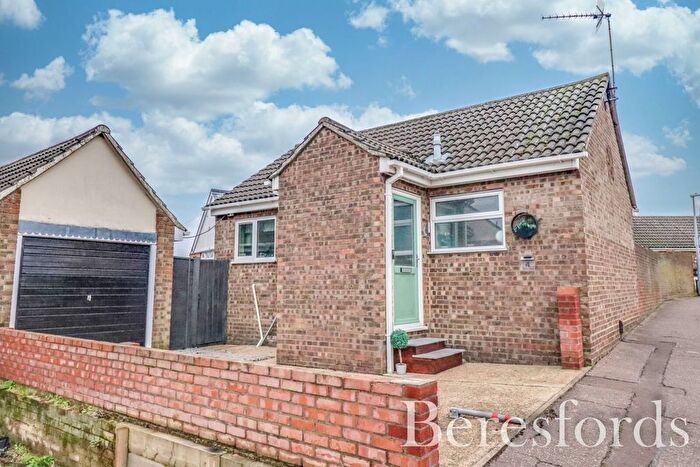
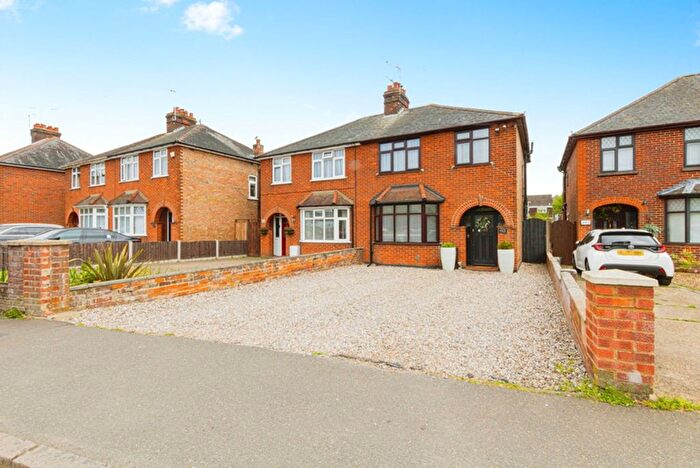
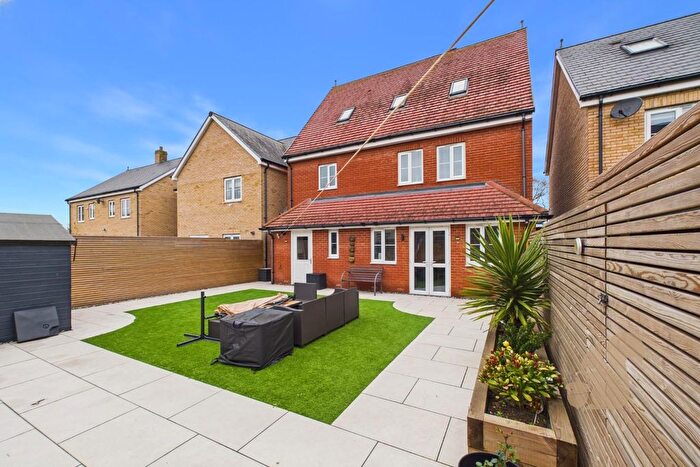
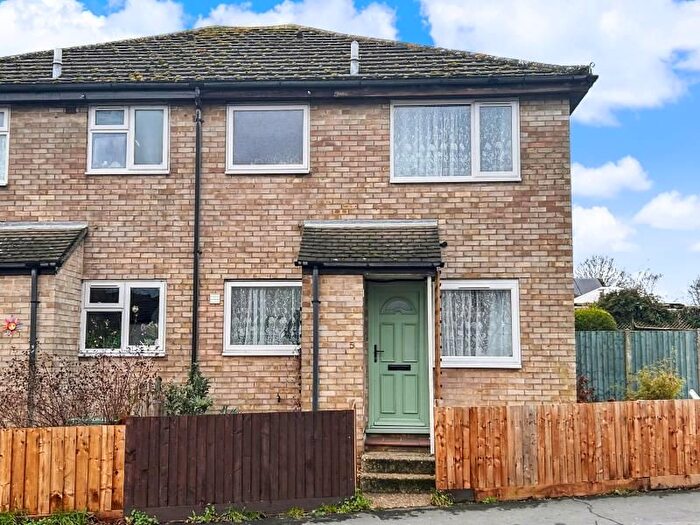
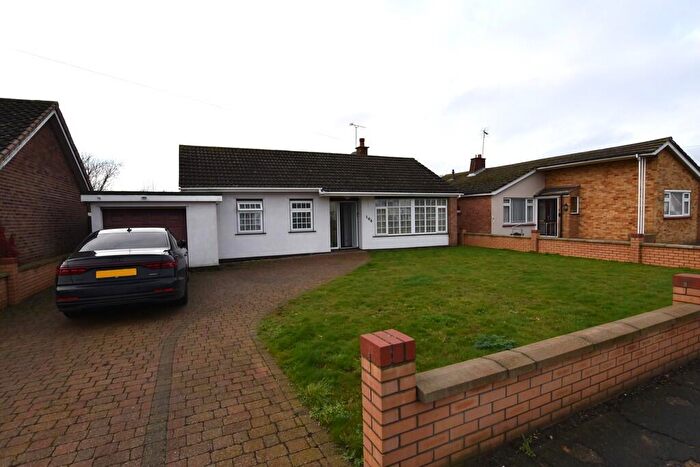
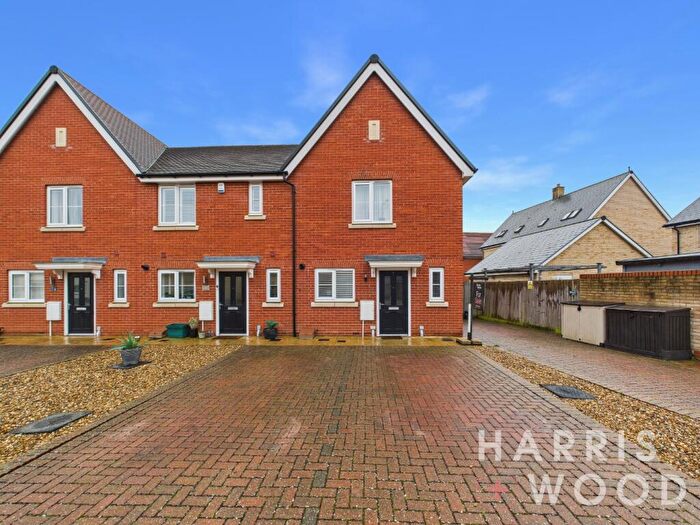
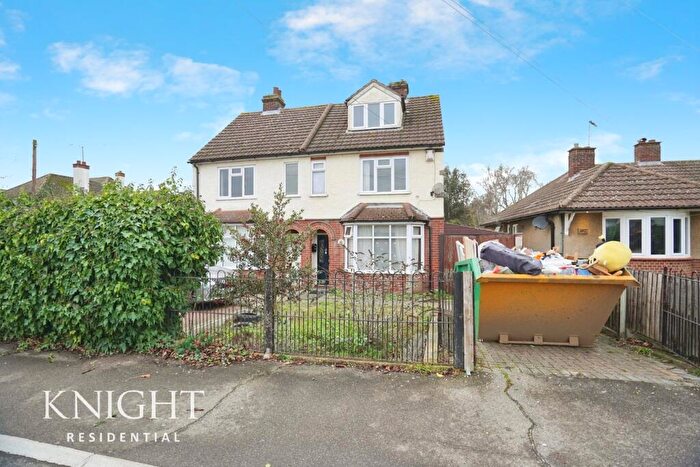
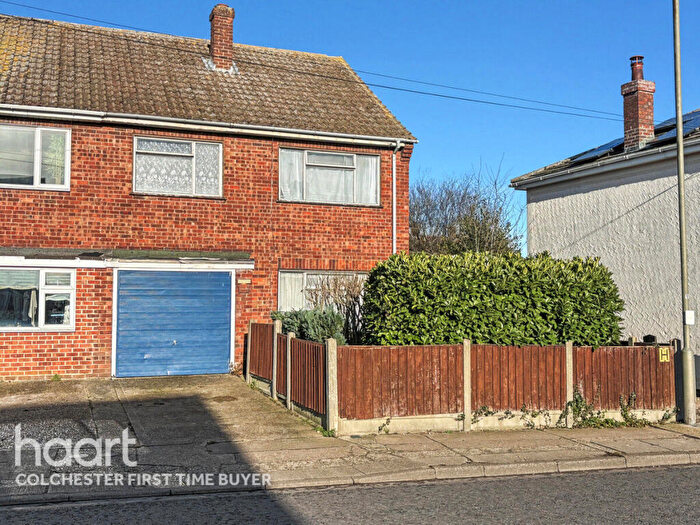
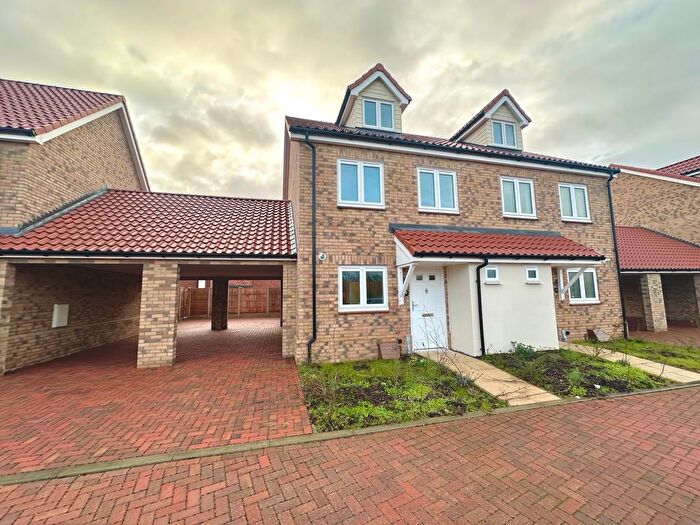
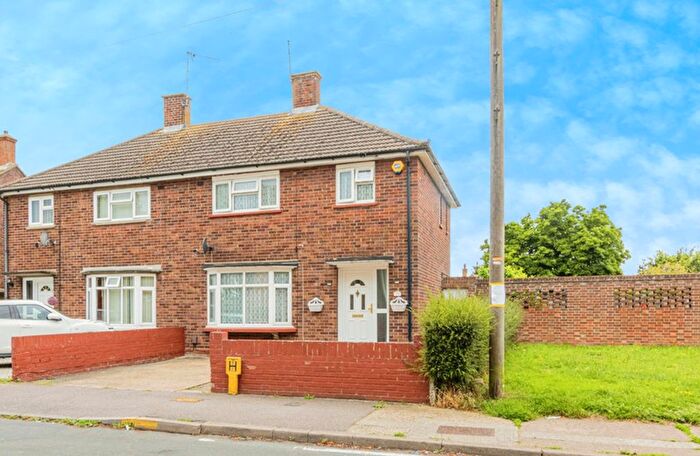
Houses for sale & to rent in St Johns, Colchester
House Prices in St Johns
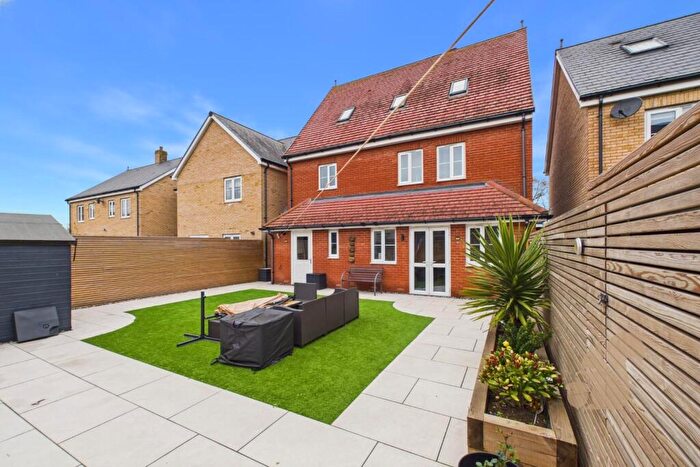
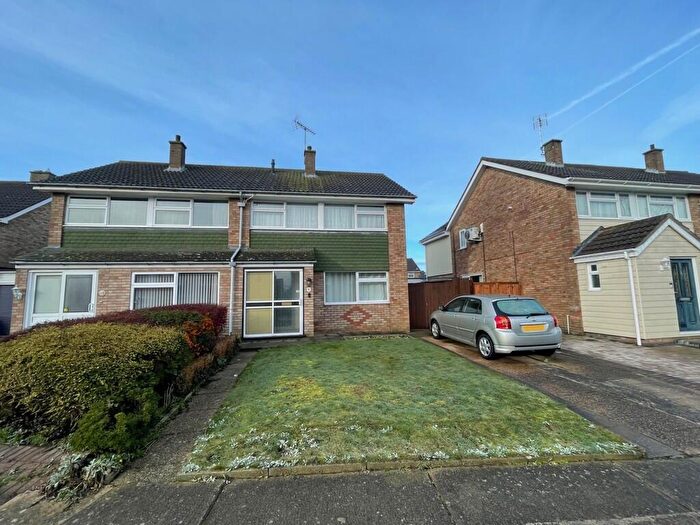
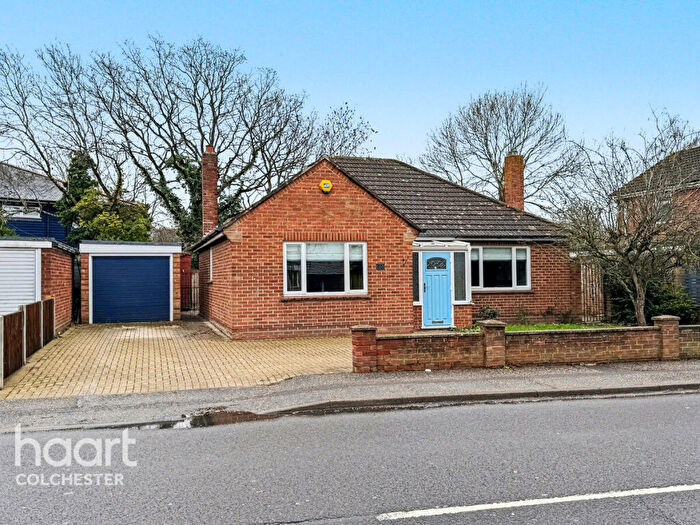
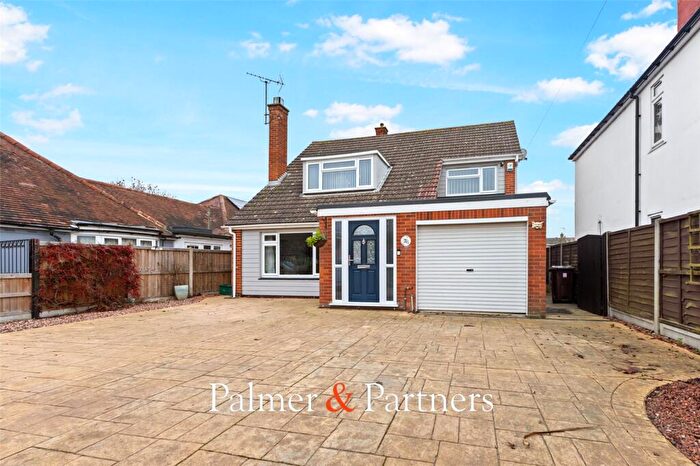
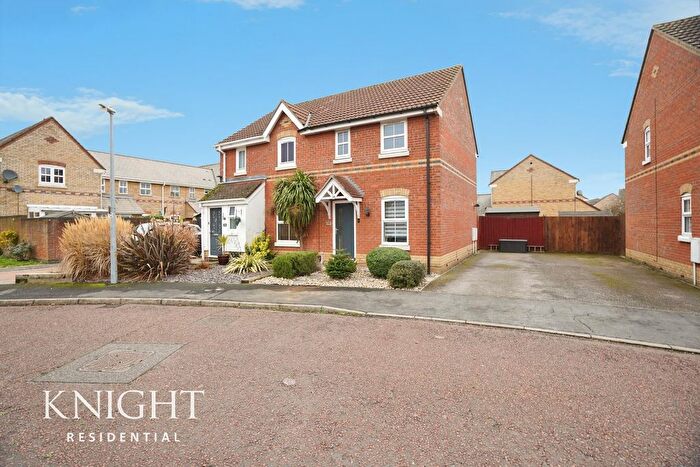
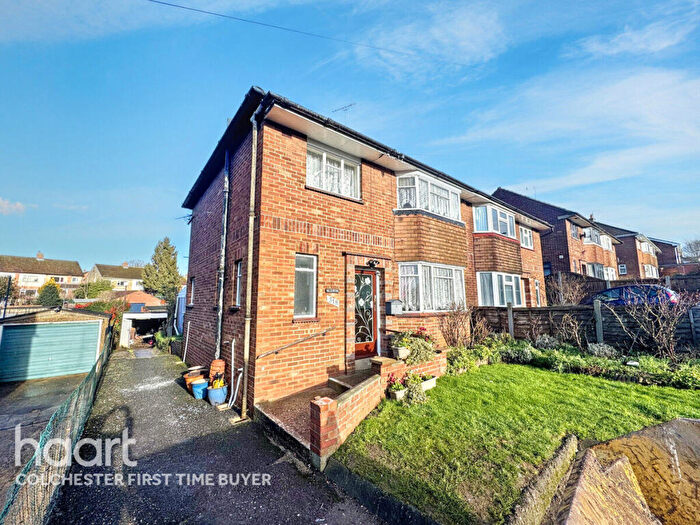
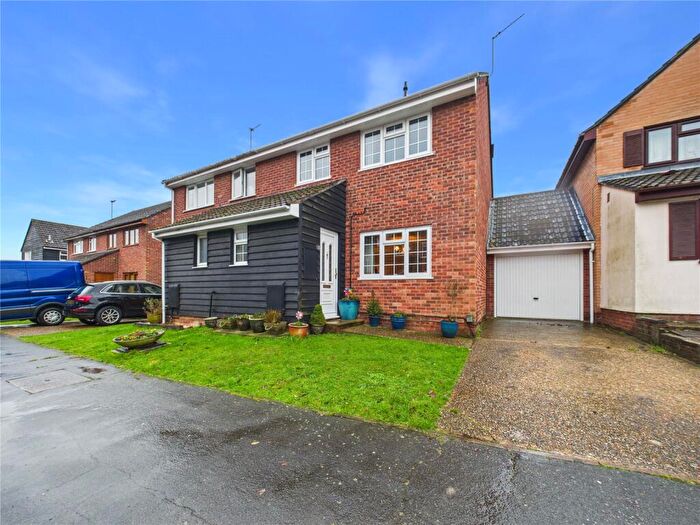
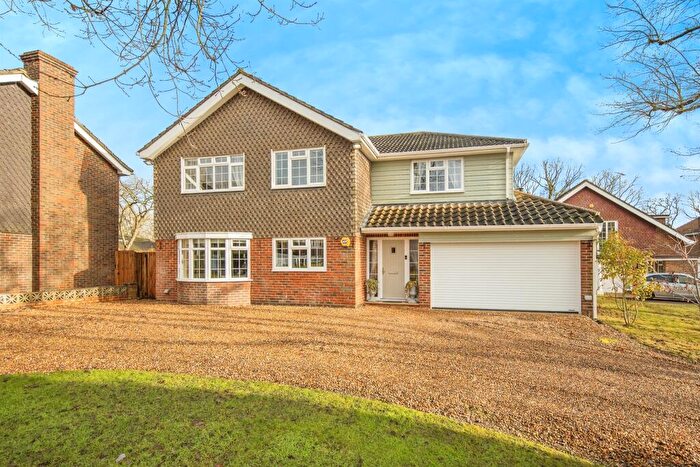
Properties in St Johns have an average house price of £371,650.00 and had 165 Property Transactions within the last 3 years¹.
St Johns is an area in Colchester, Essex with 1,964 households², where the most expensive property was sold for £1,300,000.00.
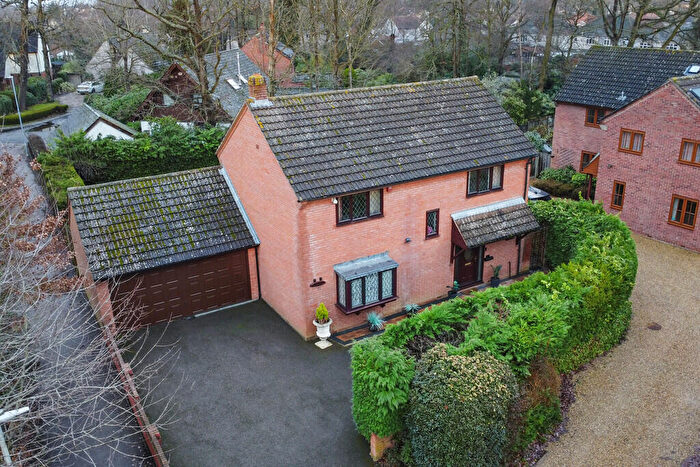
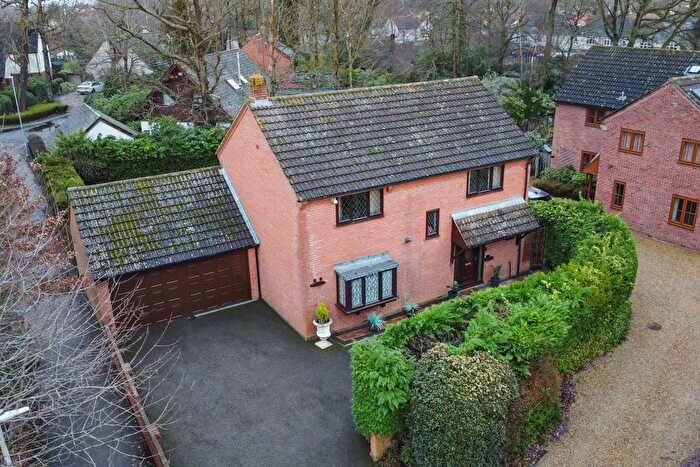
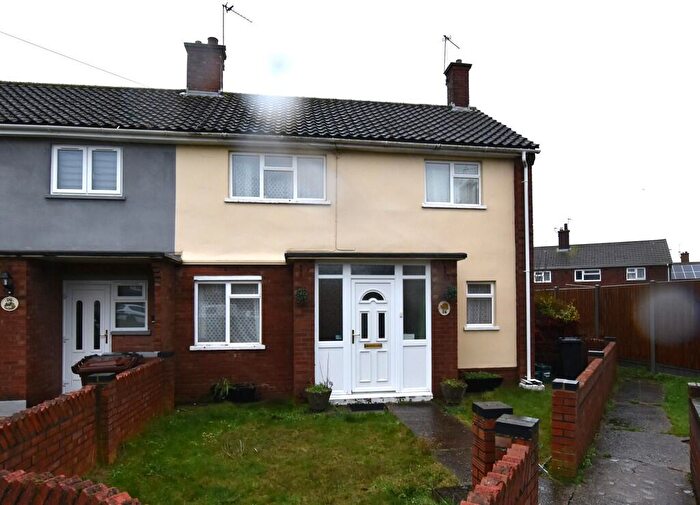
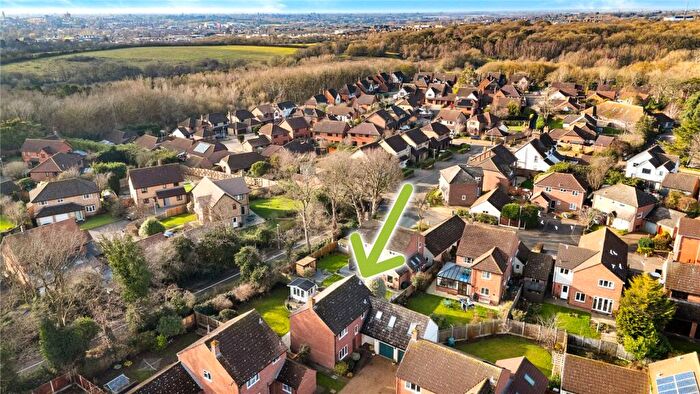
Properties for sale in St Johns
Roads and Postcodes in St Johns
Navigate through our locations to find the location of your next house in St Johns, Colchester for sale or to rent.
| Streets | Postcodes |
|---|---|
| Acorn Close | CO4 0HY |
| Anthony Close | CO4 0LD |
| Arden Close | CO4 0JP |
| Belmont Crescent | CO4 0LX |
| Blackwater Avenue | CO4 3UY |
| Braemore Close | CO4 0NN |
| Broad Oaks Park | CO4 0JX CO4 0JY |
| Bullace Close | CO4 0YP |
| Bullock Wood Close | CO4 0HX |
| Campbell Drive | CO4 0JN |
| Chalfont Road | CO4 0NT CO4 0NY |
| Clay Lane Grove | CO4 0HH |
| Cloverlands | CO4 0QE CO4 0QF |
| Deben Road | CO4 3UZ |
| Delamere Road | CO4 0NH |
| Dunthorne Road | CO4 0HZ |
| Evergreen Drive | CO4 0HU |
| Gilderdale Close | CO4 0NL |
| Glendale Grove | CO4 0LU |
| Glentress Close | CO4 0NZ |
| Green Lane | CO4 0JA |
| Ipswich Road | CO4 0EW CO4 0HF CO4 0HG CO4 0HJ CO4 0HL CO4 0HN CO4 0HQ CO4 0HW CO4 9HD |
| Kildermorie Close | CO4 0NW |
| Mayfield Close | CO4 0QL |
| Mountain Ash Close | CO4 0QB |
| Orwell Close | CO4 3YW |
| Parsons Heath | CO4 3EP CO4 3ER CO4 3HT CO4 3HX CO4 3HY |
| Pegasus Way | CO4 0QG |
| Porters Brook Walk | CO4 0QD |
| Roach Vale | CO4 3HH CO4 3YN |
| Rockingham Close | CO4 0NJ |
| Rossendale Close | CO4 0RA |
| Silcock Close | CO4 0PA |
| Southland Close | CO4 0QH |
| St Austell Road | CO4 0LJ CO4 0LL |
| St Bartholomew Close | CO4 0LT |
| St Bernard Road | CO4 0LE CO4 0LF |
| St Bride Court | CO4 0PQ |
| St Christopher Road | CO4 0LA CO4 0LB CO4 0NA CO4 0ND CO4 0NE CO4 0NF |
| St Clement Road | CO4 0LN |
| St Columb Court | CO4 0NP |
| St Cyrus Road | CO4 0LR CO4 0NG CO4 0NX |
| St Dominic Road | CO4 0PX CO4 0PY |
| St Faith Road | CO4 0PS |
| St Fillan Road | CO4 0PT |
| St Johns Close | CO4 0HP |
| St Johns Road | CO4 0JE CO4 0JF CO4 0JG CO4 0JH CO4 0JL CO4 0JQ CO4 0JR |
| St Joseph Road | CO4 0LS |
| St Jude Close | CO4 0PP |
| St Lawrence Road | CO4 0LG CO4 0LH CO4 0LQ |
| St Lukes Close | CO4 0LZ |
| St Mark Drive | CO4 0LP |
| St Monance Way | CO4 0PG CO4 0PH CO4 0PJ CO4 0PN |
| St Neots Close | CO4 0PL |
| St Saviour Close | CO4 0PW |
| St Thomas Close | CO4 0JD |
| Stour Walk | CO4 3UX |
| Temple Court | CO4 0PR |
| The Glade | CO4 3JD |
| Tyehurst Crescent | CO4 0NU |
| Upland Drive | CO4 0PZ CO4 0QA CO4 0QN |
| Vale Close | CO4 0JS |
| Welshwood Park Road | CO4 3HZ CO4 3JB |
| Wilmington Road | CO4 0NR CO4 0NS |
| Woodlands | CO4 3JA |
| Woodview Close | CO4 0QW |
Transport near St Johns
- FAQ
- Price Paid By Year
- Property Type Price
Frequently asked questions about St Johns
What is the average price for a property for sale in St Johns?
The average price for a property for sale in St Johns is £371,650. This amount is 7% higher than the average price in Colchester. There are 1,134 property listings for sale in St Johns.
What streets have the most expensive properties for sale in St Johns?
The streets with the most expensive properties for sale in St Johns are Welshwood Park Road at an average of £822,500, Woodlands at an average of £720,000 and The Glade at an average of £630,000.
What streets have the most affordable properties for sale in St Johns?
The streets with the most affordable properties for sale in St Johns are Silcock Close at an average of £160,850, Roach Vale at an average of £239,375 and Orwell Close at an average of £262,812.
Which train stations are available in or near St Johns?
Some of the train stations available in or near St Johns are Hythe, Colchester and Colchester Town.
Property Price Paid in St Johns by Year
The average sold property price by year was:
| Year | Average Sold Price | Price Change |
Sold Properties
|
|---|---|---|---|
| 2025 | £373,171 | -1% |
57 Properties |
| 2024 | £376,007 | 3% |
63 Properties |
| 2023 | £363,622 | 1% |
45 Properties |
| 2022 | £359,012 | 2% |
79 Properties |
| 2021 | £351,030 | 10% |
137 Properties |
| 2020 | £314,836 | -2% |
68 Properties |
| 2019 | £320,642 | -0,2% |
70 Properties |
| 2018 | £321,415 | 10% |
74 Properties |
| 2017 | £288,793 | -8% |
68 Properties |
| 2016 | £312,422 | 13% |
72 Properties |
| 2015 | £272,567 | 10% |
84 Properties |
| 2014 | £246,227 | 7% |
84 Properties |
| 2013 | £228,424 | 5% |
58 Properties |
| 2012 | £215,877 | -9% |
57 Properties |
| 2011 | £234,556 | 8% |
59 Properties |
| 2010 | £216,783 | 4% |
64 Properties |
| 2009 | £208,867 | 6% |
54 Properties |
| 2008 | £195,650 | -7% |
43 Properties |
| 2007 | £209,353 | -5% |
109 Properties |
| 2006 | £220,076 | 12% |
114 Properties |
| 2005 | £193,166 | -1% |
80 Properties |
| 2004 | £195,737 | 13% |
81 Properties |
| 2003 | £171,105 | 17% |
95 Properties |
| 2002 | £141,887 | 14% |
82 Properties |
| 2001 | £121,976 | 13% |
95 Properties |
| 2000 | £106,402 | 15% |
82 Properties |
| 1999 | £90,725 | 10% |
97 Properties |
| 1998 | £81,656 | 9% |
75 Properties |
| 1997 | £74,095 | 1% |
102 Properties |
| 1996 | £73,250 | -5% |
98 Properties |
| 1995 | £76,653 | - |
66 Properties |
Property Price per Property Type in St Johns
Here you can find historic sold price data in order to help with your property search.
The average Property Paid Price for specific property types in the last three years are:
| Property Type | Average Sold Price | Sold Properties |
|---|---|---|
| Semi Detached House | £336,585.00 | 66 Semi Detached Houses |
| Detached House | £444,555.00 | 75 Detached Houses |
| Terraced House | £272,833.00 | 18 Terraced Houses |
| Flat | £142,500.00 | 6 Flats |

