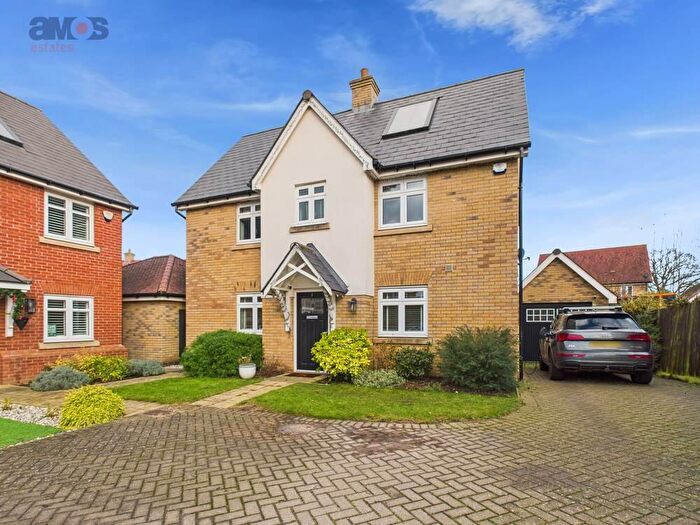
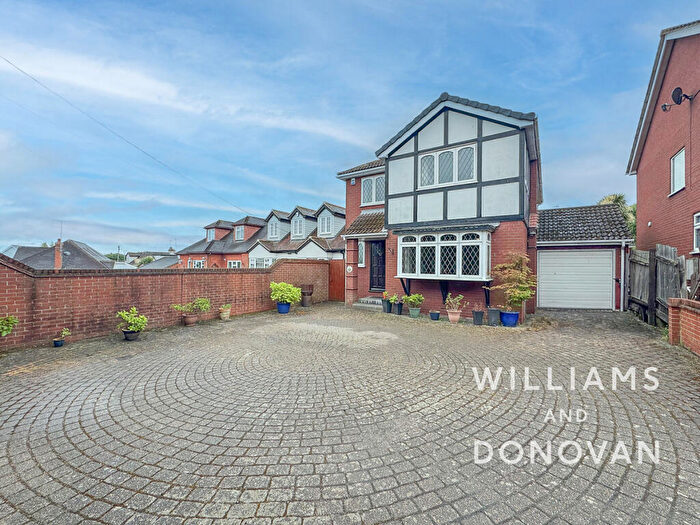
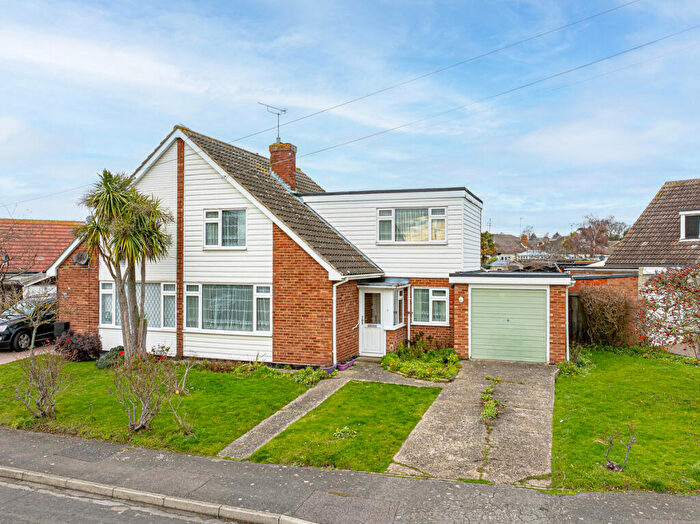
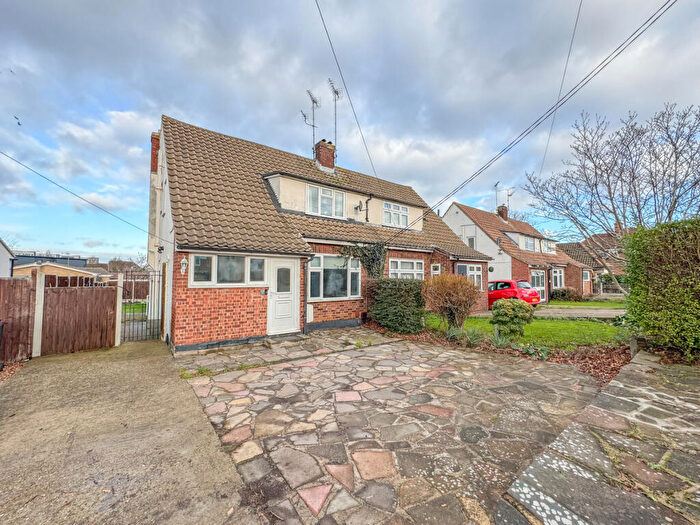
Houses for sale & to rent in Hawkwell West, Hockley
House Prices in Hawkwell West
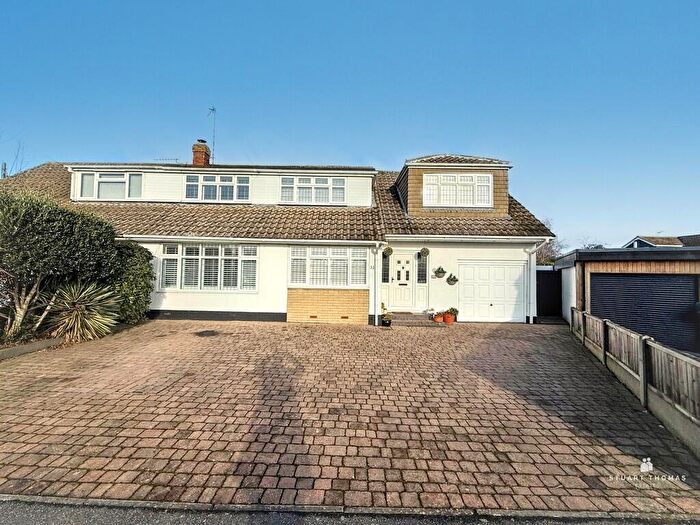
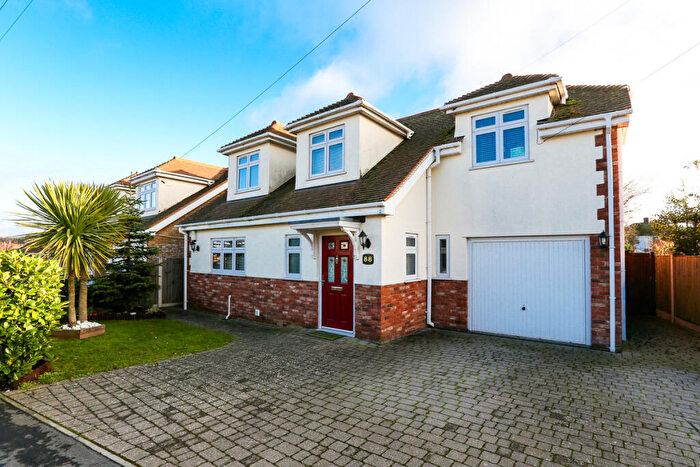
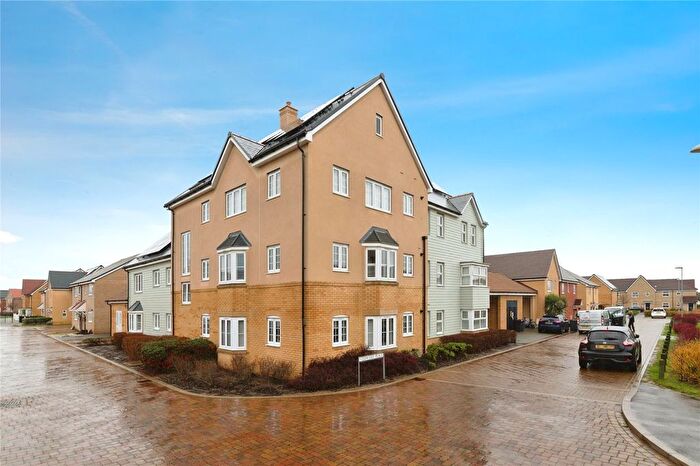
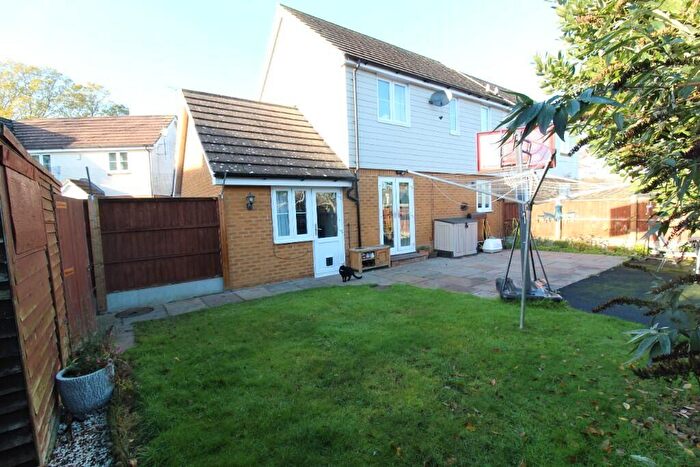
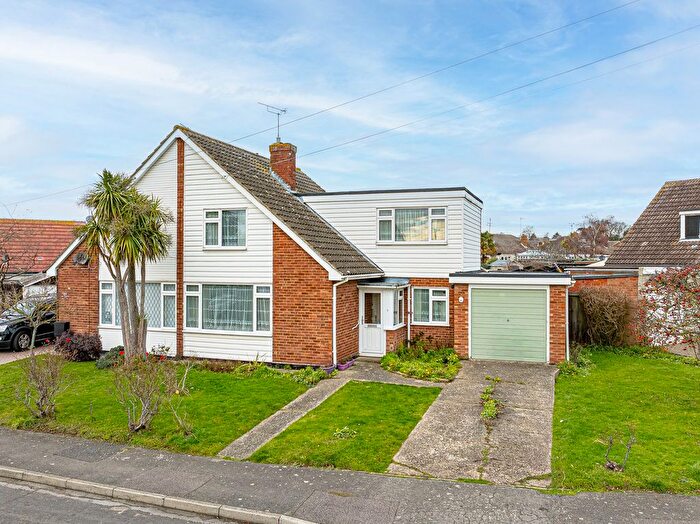
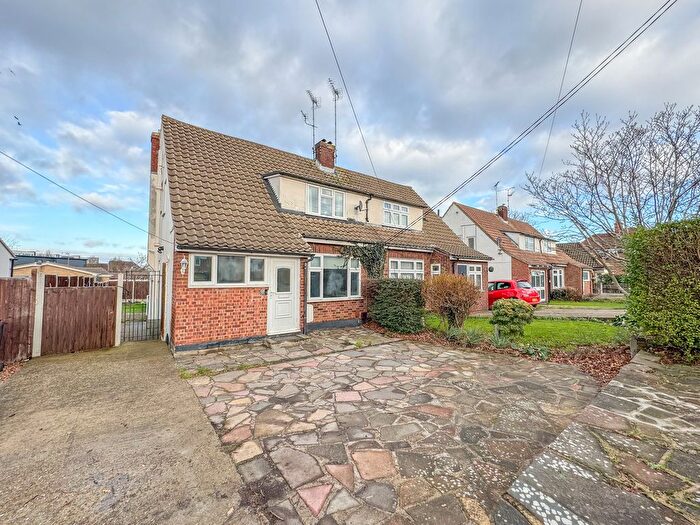
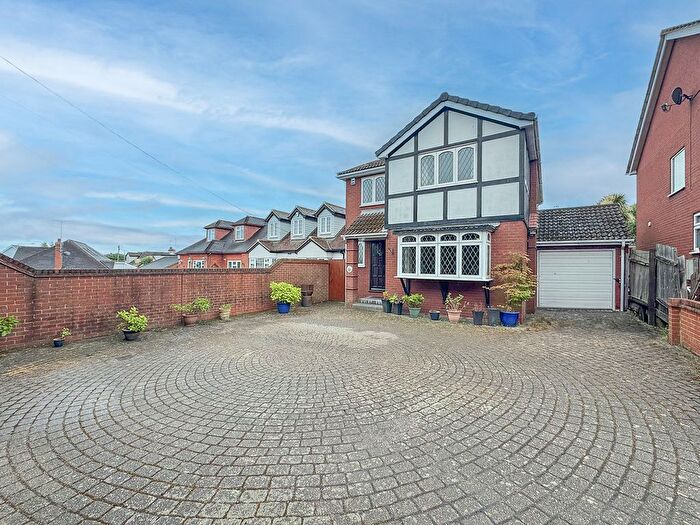
Properties in Hawkwell West have an average house price of £486,722.00 and had 228 Property Transactions within the last 3 years¹.
Hawkwell West is an area in Hockley, Essex with 1,574 households², where the most expensive property was sold for £1,136,000.00.
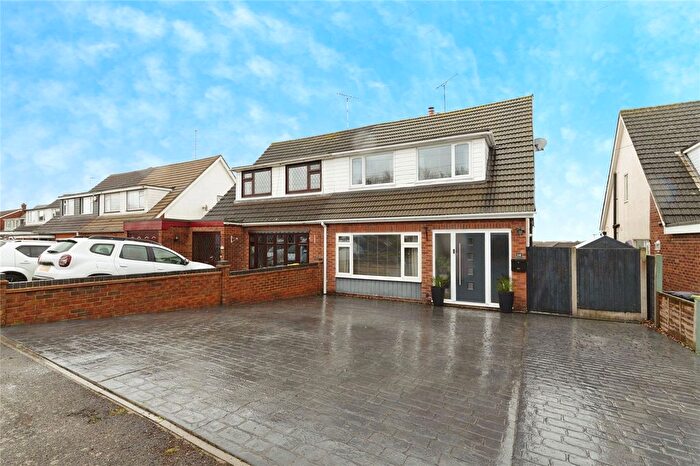
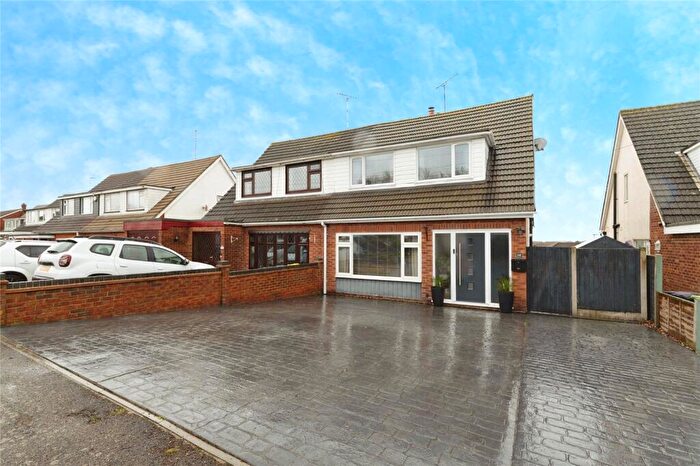
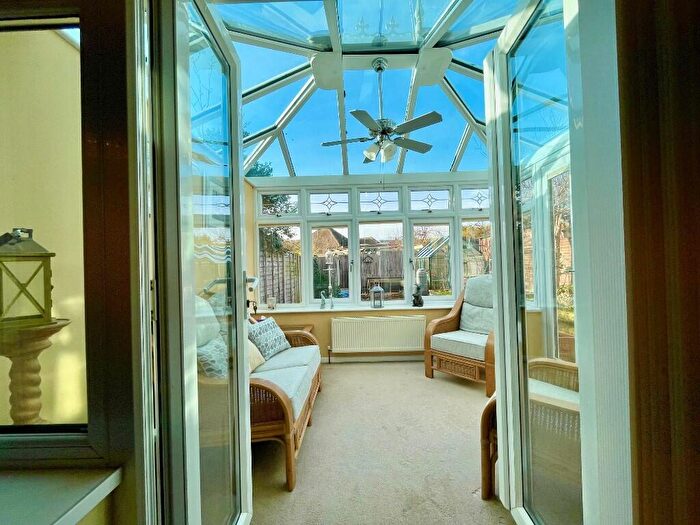
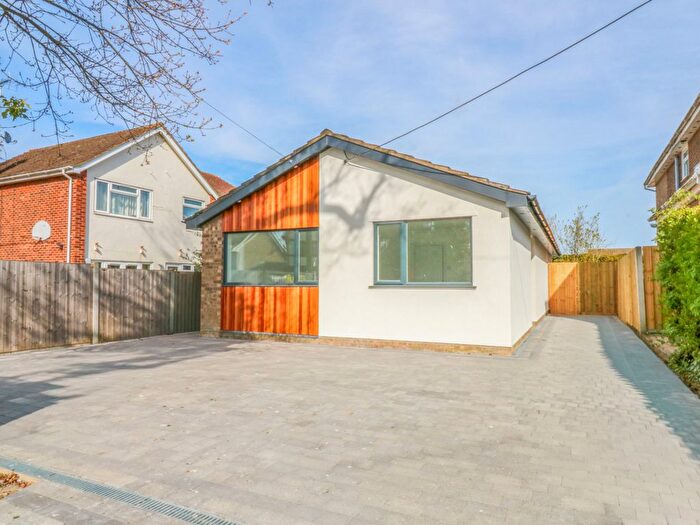
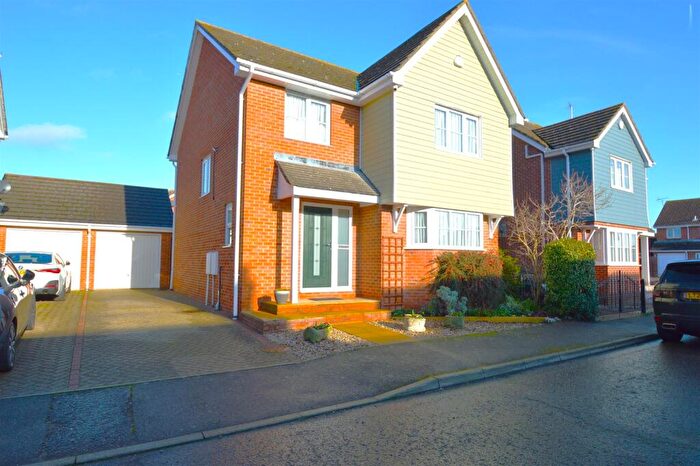
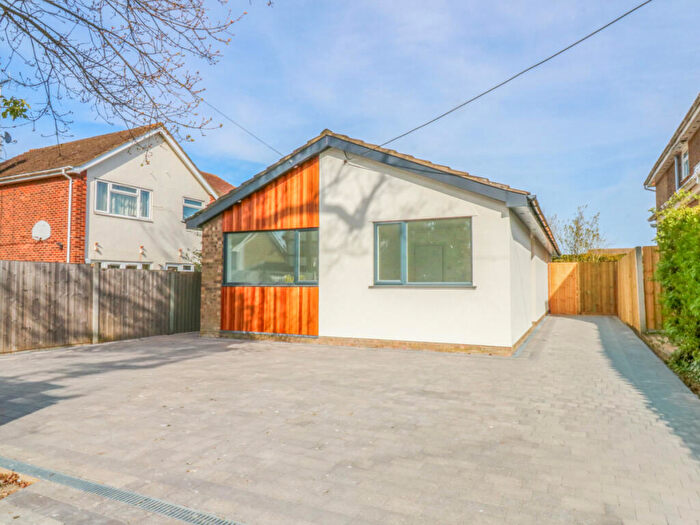
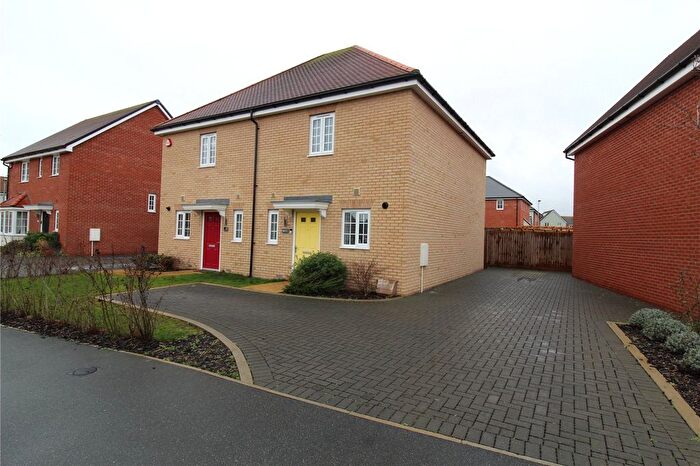
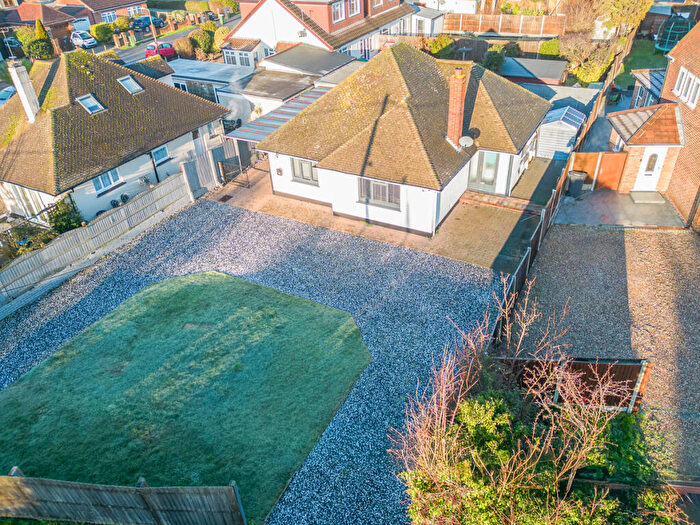
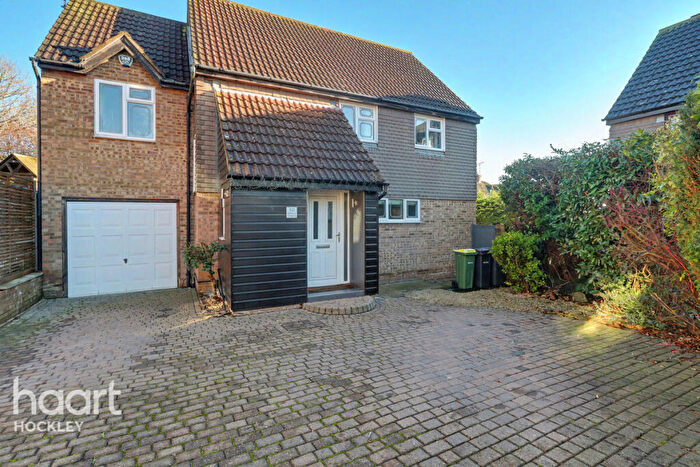
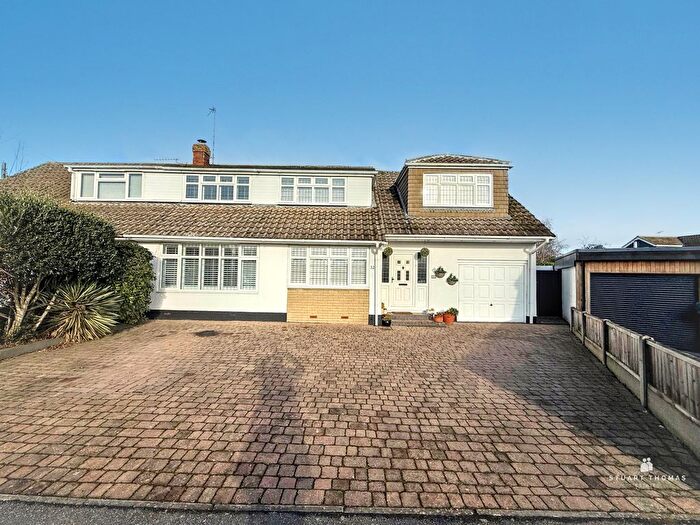
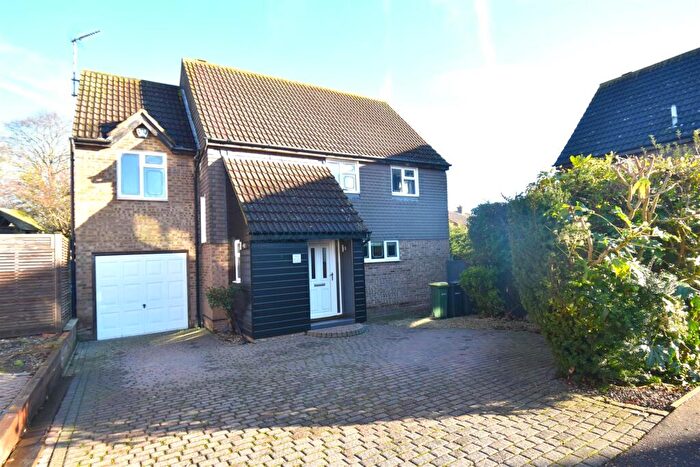
Properties for sale in Hawkwell West
Roads and Postcodes in Hawkwell West
Navigate through our locations to find the location of your next house in Hawkwell West, Hockley for sale or to rent.
| Streets | Postcodes |
|---|---|
| Aaron Lewis Close | SS5 4FE |
| Badgers Walk | SS5 4FF |
| Beehive Lane | SS5 4FG |
| Belchamps Way | SS5 4NT SS5 4NU |
| Bosworth Close | SS5 4EZ |
| Briar Close | SS5 4HD |
| Brookside | SS5 4EW |
| Christmas Tree Crescent | SS5 4FL SS5 4FN |
| Clements Gardens | SS5 4DX |
| Clements Hall Lane | SS5 4DT |
| Clements Hall Way | SS5 4FP SS5 4LN |
| Durham Road | SS4 3AE |
| Elizabeth Close | SS5 4NQ |
| Elmwood Avenue | SS5 4ND |
| Englefield Close | SS5 4LE |
| Fir Tree Drive | SS5 4FQ |
| Glencrofts | SS5 4GN |
| Glenwood Avenue | SS5 4HH |
| Gregory Close | SS5 4NF |
| Harrow Close | SS5 4HQ |
| Harrow Gardens | SS5 4HG |
| Hawkwell Chase | SS5 4NE SS5 4NG SS5 4NH |
| Hawkwell Park Drive | SS5 4HA SS5 4HB |
| Hawthorn Close | SS5 4HJ |
| Hazelwood | SS5 4HP |
| Helena Close | SS5 4DJ |
| Heycroft Road | SS5 4HN |
| High Mead | SS5 4QG |
| Highwell Gardens | SS5 4LY |
| Hill Lane | SS5 4HL SS5 4HW |
| Hillside Avenue | SS5 4NN |
| Hockley Rise | SS5 4PT SS5 4QE |
| Holyoak Lane | SS5 4JD |
| Ironwell Lane | SS5 4JY SS4 1PR |
| Jubilee Close | SS5 4PA |
| Main Road | SS5 4EG SS5 4EH SS5 4EJ SS5 4EL SS5 4EN SS5 4EQ SS5 4ES SS5 4ET SS5 4JH SS5 4JN SS5 4NP SS5 4NR SS5 4NW SS5 4JP |
| Martin Walk | SS5 4LP |
| Milestone Close | SS5 4FJ |
| Mount Bovers Lane | SS5 4JA SS5 4JB SS5 4JE SS5 4JF |
| Mount Villas | SS5 4JQ |
| Nursery Drive | SS5 4FH |
| Park Gardens | SS5 4HE SS5 4HF |
| Poplars Avenue | SS5 4NA |
| Primrose Place | SS5 4FA |
| Read Close | SS5 4LS |
| Rectory Road | SS5 4JU SS5 4JX SS5 4JZ SS5 4LA SS5 4LF SS5 4LG SS5 4LJ SS5 4LL |
| Rectory Terrace | SS5 4LD |
| Royer Close | SS5 4LR |
| Spencers | SS5 4LW |
| Spruce Drive | SS5 4FR |
| St Clements Close | SS5 4LT |
| Sudbury Close | SS5 4EX |
| Sunny Road | SS5 4NZ |
| Sweyne Avenue | SS5 4LB |
| The Westerings | SS5 4NX SS5 4NY |
| Thorpe Close | SS5 4ER |
| Thorpe Gardens | SS5 4EE |
| Thorpe Road | SS5 4EP SS5 4JT |
| Tudor Way | SS5 4EY |
| Uplands Close | SS5 4DN |
| Uplands Road | SS5 4DH SS5 4DL |
| Victor Gardens | SS5 4DR SS5 4DS SS5 4DY |
| Welbeck Close | SS5 4EU |
| White Hart Lane | SS5 4DP |
| Windsor Gardens | SS5 4LQ SS5 4LH |
| Woodside Chase | SS5 4NB |
Transport near Hawkwell West
- FAQ
- Price Paid By Year
- Property Type Price
Frequently asked questions about Hawkwell West
What is the average price for a property for sale in Hawkwell West?
The average price for a property for sale in Hawkwell West is £486,722. This amount is 6% higher than the average price in Hockley. There are 3,398 property listings for sale in Hawkwell West.
What streets have the most expensive properties for sale in Hawkwell West?
The streets with the most expensive properties for sale in Hawkwell West are Holyoak Lane at an average of £920,000, Read Close at an average of £790,000 and Glencrofts at an average of £739,000.
What streets have the most affordable properties for sale in Hawkwell West?
The streets with the most affordable properties for sale in Hawkwell West are Gregory Close at an average of £333,000, Harrow Gardens at an average of £334,286 and Harrow Close at an average of £337,750.
Which train stations are available in or near Hawkwell West?
Some of the train stations available in or near Hawkwell West are Hockley, Rochford and Southend Airport.
Property Price Paid in Hawkwell West by Year
The average sold property price by year was:
| Year | Average Sold Price | Price Change |
Sold Properties
|
|---|---|---|---|
| 2025 | £494,687 | 5% |
43 Properties |
| 2024 | £467,730 | 1% |
63 Properties |
| 2023 | £463,883 | -12% |
59 Properties |
| 2022 | £521,666 | 9% |
63 Properties |
| 2021 | £475,642 | 8% |
93 Properties |
| 2020 | £439,309 | 8% |
71 Properties |
| 2019 | £405,102 | 3% |
68 Properties |
| 2018 | £391,398 | -3% |
59 Properties |
| 2017 | £404,924 | -2% |
102 Properties |
| 2016 | £414,981 | 2% |
96 Properties |
| 2015 | £407,905 | 9% |
122 Properties |
| 2014 | £371,170 | 20% |
116 Properties |
| 2013 | £297,518 | -2% |
66 Properties |
| 2012 | £302,309 | 16% |
56 Properties |
| 2011 | £254,639 | -7% |
50 Properties |
| 2010 | £272,888 | 13% |
47 Properties |
| 2009 | £236,838 | -28% |
44 Properties |
| 2008 | £302,918 | 5% |
40 Properties |
| 2007 | £287,896 | 5% |
63 Properties |
| 2006 | £272,901 | 8% |
87 Properties |
| 2005 | £250,333 | 3% |
58 Properties |
| 2004 | £242,525 | 2% |
76 Properties |
| 2003 | £238,604 | 24% |
80 Properties |
| 2002 | £182,454 | 19% |
83 Properties |
| 2001 | £148,299 | 5% |
83 Properties |
| 2000 | £141,068 | 19% |
86 Properties |
| 1999 | £113,871 | 3% |
86 Properties |
| 1998 | £110,622 | 26% |
80 Properties |
| 1997 | £82,152 | -5% |
80 Properties |
| 1996 | £86,091 | -5% |
95 Properties |
| 1995 | £90,593 | - |
73 Properties |
Property Price per Property Type in Hawkwell West
Here you can find historic sold price data in order to help with your property search.
The average Property Paid Price for specific property types in the last three years are:
| Property Type | Average Sold Price | Sold Properties |
|---|---|---|
| Semi Detached House | £406,536.00 | 101 Semi Detached Houses |
| Detached House | £587,268.00 | 106 Detached Houses |
| Terraced House | £385,131.00 | 19 Terraced Houses |
| Flat | £172,250.00 | 2 Flats |

