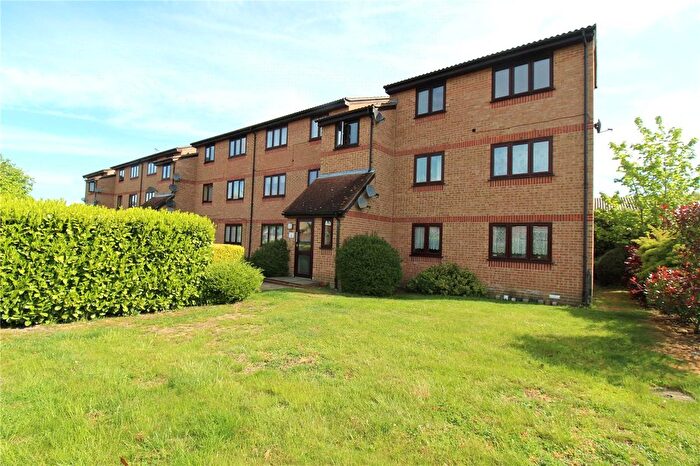
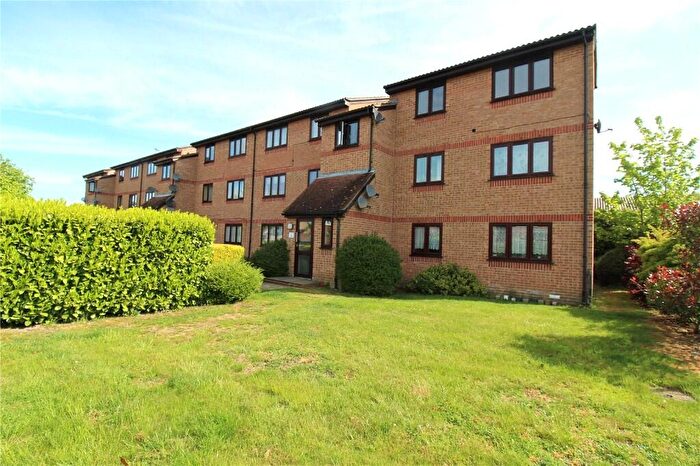
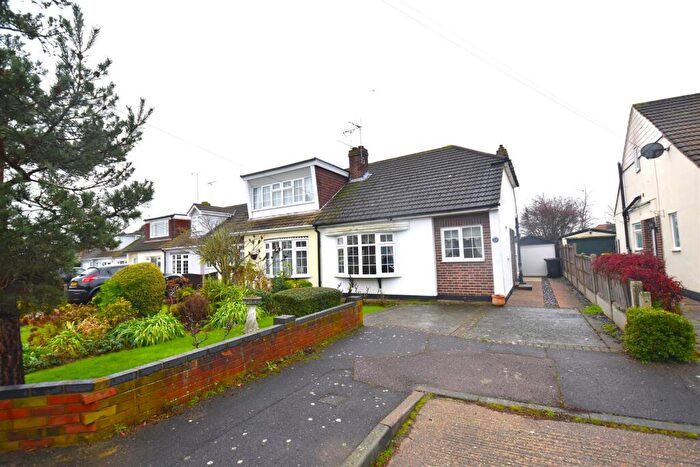
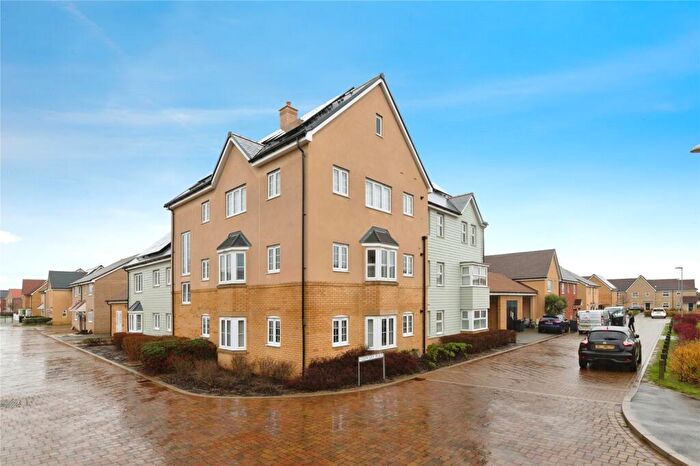
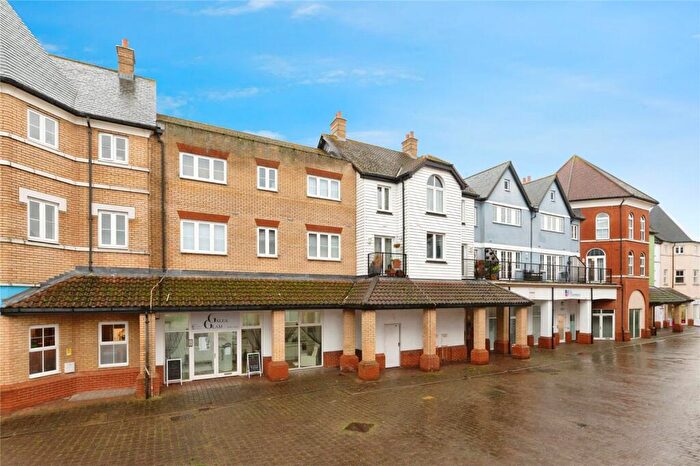
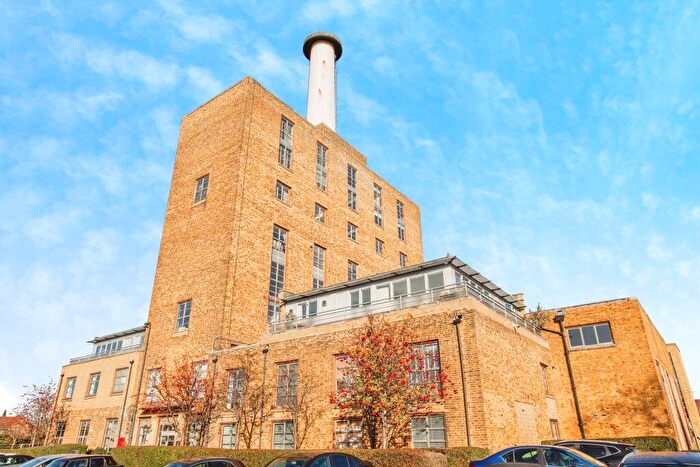
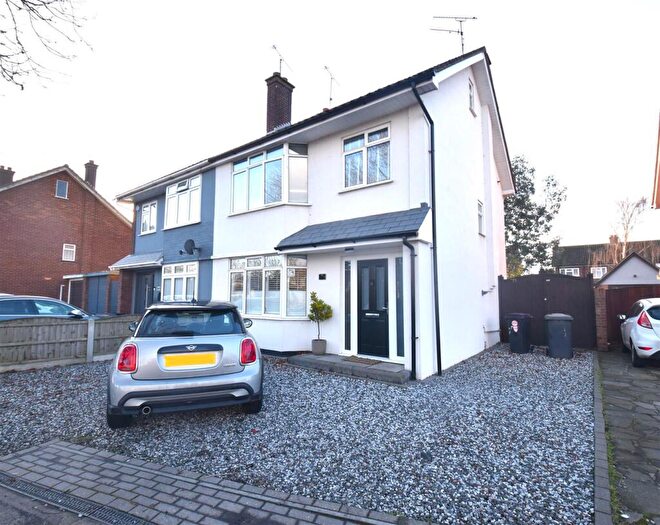
Houses for sale & to rent in Hawkwell South, Rochford
House Prices in Hawkwell South
Properties in Hawkwell South have an average house price of £326,220.00 and had 270 Property Transactions within the last 3 years¹.
Hawkwell South is an area in Rochford, Essex with 1,853 households², where the most expensive property was sold for £656,000.00.
Properties for sale in Hawkwell South
Roads and Postcodes in Hawkwell South
Navigate through our locations to find the location of your next house in Hawkwell South, Rochford for sale or to rent.
| Streets | Postcodes |
|---|---|
| Ashcombe | SS4 1SL SS4 1SW |
| Ashingdon Road | SS4 1NH SS4 1QZ SS4 1RF SS4 1RP SS4 1RS SS4 1TA SS4 1TB SS4 1TQ SS4 1TR SS4 1TS SS4 1UA SS4 3DB |
| Banyard Way | SS4 1UJ SS4 1UQ |
| Barbara Close | SS4 1NQ |
| Boswell Avenue | SS4 1TH |
| Braxted Close | SS4 1UN |
| Brays Lane | SS4 3RP |
| Craven Close | SS4 3DD |
| Doric Avenue | SS4 3DF |
| Eastbury Avenue | SS4 1SE SS4 1SF |
| Gelding Close | SS4 3FG |
| Greenlands | SS4 1ST |
| Hainault Avenue | SS4 1UH |
| Harewood Avenue | SS4 3AY |
| Hedingham Place | SS4 1UP |
| Hilary Close | SS4 1TN |
| Holt Farm Way | SS4 1SA SS4 1SB SS4 1SD SS4 1SU |
| Ironwell Close | SS4 1PY |
| Johnson Close | SS4 1TP |
| Larkfield Close | SS4 1SS |
| Laurel Court | SS4 1FL |
| Leecon Way | SS4 1TU |
| Lesney Gardens | SS4 1TY SS4 1TZ |
| Mansted Gardens | SS4 3DE |
| Marshalls | SS4 1SP |
| Meesons Mead | SS4 1RN |
| Nutcombe Crescent | SS4 1RT |
| Oaklands Mews | SS4 1GE |
| Oxford Road | SS4 1TD SS4 1TE SS4 1TF SS4 1TG |
| Parklands | SS4 1SH SS4 1SJ SS4 1SQ SS4 1SY |
| Rectory Road | SS4 1UD SS4 1UE |
| Roche Avenue | SS4 1NG |
| Royal Close | SS4 3AZ |
| Sandon Close | SS4 1TT |
| Shetland Crescent | SS4 3FJ |
| Silverthorne Close | SS4 1SG |
| Spencer Gardens | SS4 1TJ SS4 1TW |
| Steeple Close | SS4 1TX |
| The Bramleys | SS4 3BA SS4 3BD |
| The Dales | SS4 1RW |
| The Laxtons | SS4 3BE |
| The Russets | SS4 3BB |
| Vaughan Close | SS4 1TL |
| Wendon Close | SS4 1UF |
| Westbury | SS4 1UL |
| Wheatley Close | SS4 1SR |
| Woodville Close | SS4 1SN |
Transport near Hawkwell South
- FAQ
- Price Paid By Year
- Property Type Price
Frequently asked questions about Hawkwell South
What is the average price for a property for sale in Hawkwell South?
The average price for a property for sale in Hawkwell South is £326,220. This amount is 13% lower than the average price in Rochford. There are 1,882 property listings for sale in Hawkwell South.
What streets have the most expensive properties for sale in Hawkwell South?
The streets with the most expensive properties for sale in Hawkwell South are Gelding Close at an average of £485,000, Shetland Crescent at an average of £481,625 and Boswell Avenue at an average of £435,000.
What streets have the most affordable properties for sale in Hawkwell South?
The streets with the most affordable properties for sale in Hawkwell South are Sandon Close at an average of £146,666, Steeple Close at an average of £148,400 and Leecon Way at an average of £155,833.
Which train stations are available in or near Hawkwell South?
Some of the train stations available in or near Hawkwell South are Rochford, Hockley and Southend Airport.
Property Price Paid in Hawkwell South by Year
The average sold property price by year was:
| Year | Average Sold Price | Price Change |
Sold Properties
|
|---|---|---|---|
| 2025 | £331,991 | 1% |
39 Properties |
| 2024 | £329,064 | 1% |
78 Properties |
| 2023 | £326,856 | 2% |
83 Properties |
| 2022 | £319,084 | 7% |
70 Properties |
| 2021 | £297,328 | 7% |
105 Properties |
| 2020 | £276,474 | -2% |
79 Properties |
| 2019 | £280,635 | 1% |
94 Properties |
| 2018 | £277,522 | 1% |
87 Properties |
| 2017 | £274,926 | 10% |
96 Properties |
| 2016 | £248,727 | 4% |
87 Properties |
| 2015 | £239,246 | -1% |
114 Properties |
| 2014 | £240,786 | 18% |
137 Properties |
| 2013 | £198,266 | 11% |
101 Properties |
| 2012 | £175,801 | -2% |
67 Properties |
| 2011 | £178,622 | -1% |
61 Properties |
| 2010 | £180,438 | -1% |
65 Properties |
| 2009 | £182,497 | -6% |
53 Properties |
| 2008 | £192,699 | 2% |
55 Properties |
| 2007 | £188,334 | 15% |
125 Properties |
| 2006 | £160,535 | -1% |
134 Properties |
| 2005 | £162,935 | 8% |
83 Properties |
| 2004 | £150,255 | 10% |
135 Properties |
| 2003 | £134,608 | 21% |
116 Properties |
| 2002 | £106,661 | 26% |
126 Properties |
| 2001 | £78,942 | 13% |
135 Properties |
| 2000 | £68,287 | 7% |
115 Properties |
| 1999 | £63,174 | 3% |
143 Properties |
| 1998 | £61,515 | 9% |
107 Properties |
| 1997 | £55,842 | 9% |
93 Properties |
| 1996 | £50,871 | 2% |
104 Properties |
| 1995 | £49,932 | - |
65 Properties |
Property Price per Property Type in Hawkwell South
Here you can find historic sold price data in order to help with your property search.
The average Property Paid Price for specific property types in the last three years are:
| Property Type | Average Sold Price | Sold Properties |
|---|---|---|
| Semi Detached House | £352,886.00 | 163 Semi Detached Houses |
| Detached House | £455,647.00 | 35 Detached Houses |
| Terraced House | £318,142.00 | 21 Terraced Houses |
| Flat | £155,500.00 | 51 Flats |

