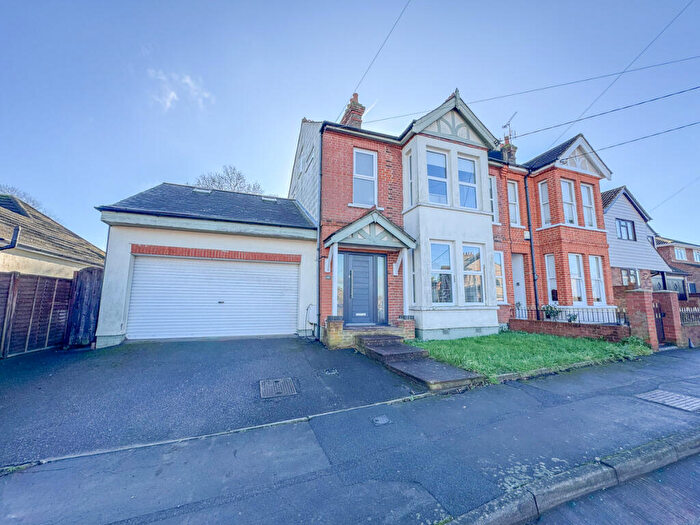
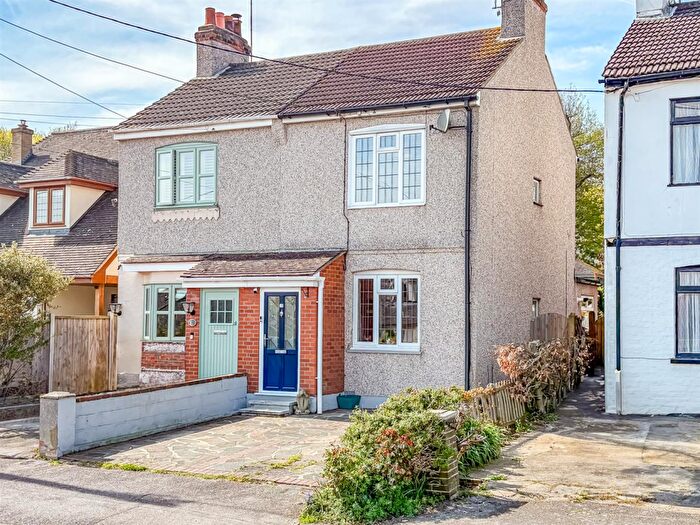
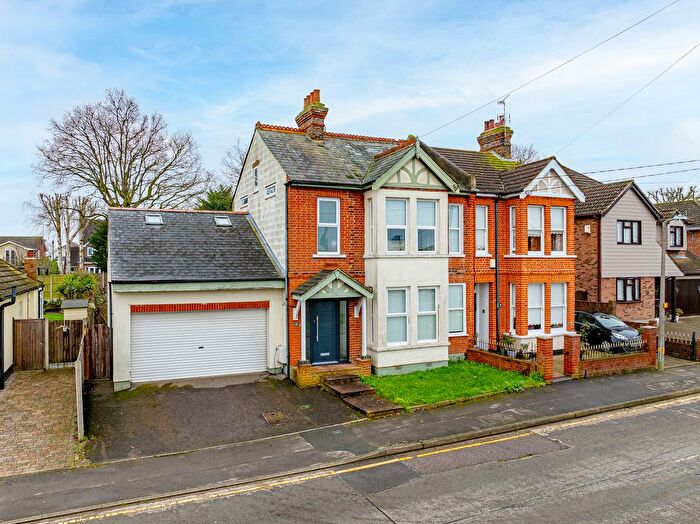
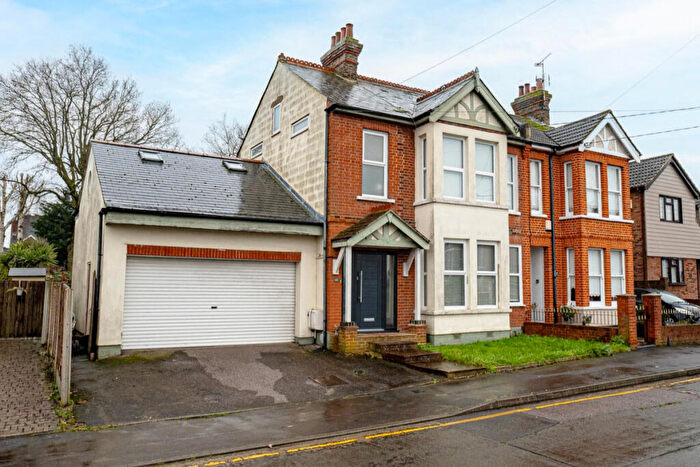
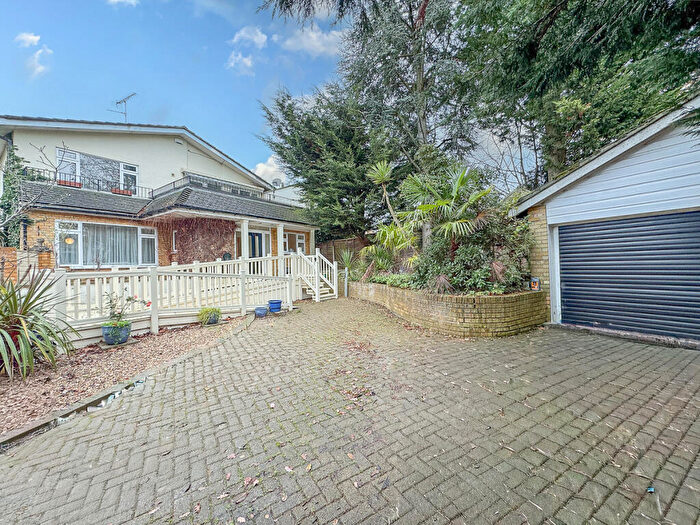
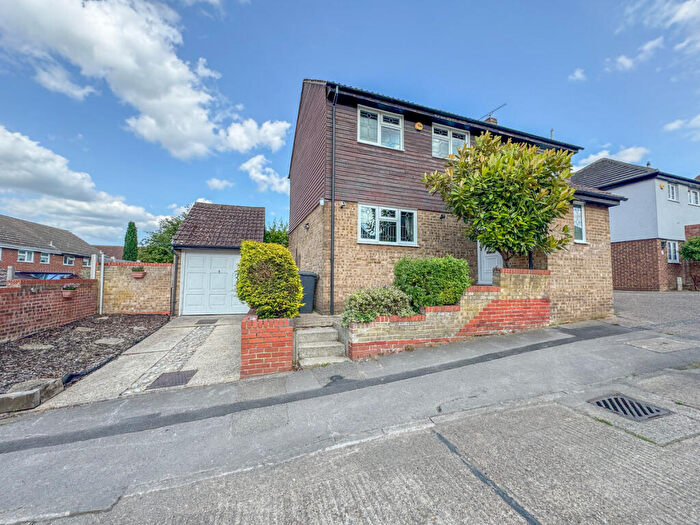
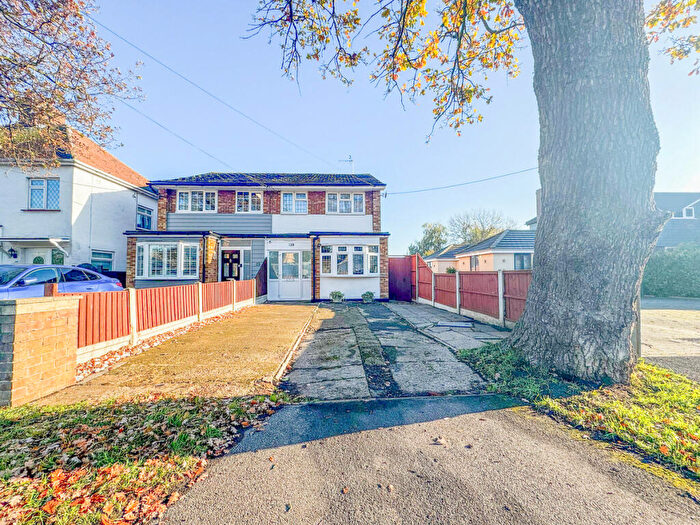
Houses for sale & to rent in Hockley, Hockley
House Prices in Hockley
Properties in Hockley have an average house price of £399,428.00 and had 7 Property Transactions within the last 3 years¹.
Hockley is an area in Hockley, Essex with 74 households², where the most expensive property was sold for £570,000.00.
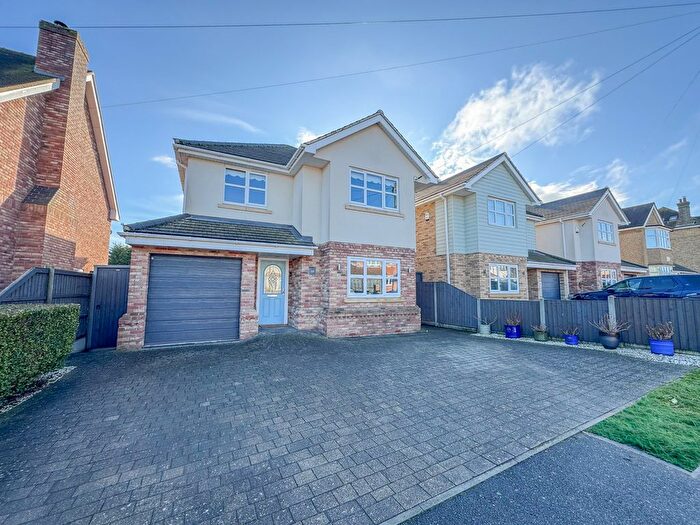
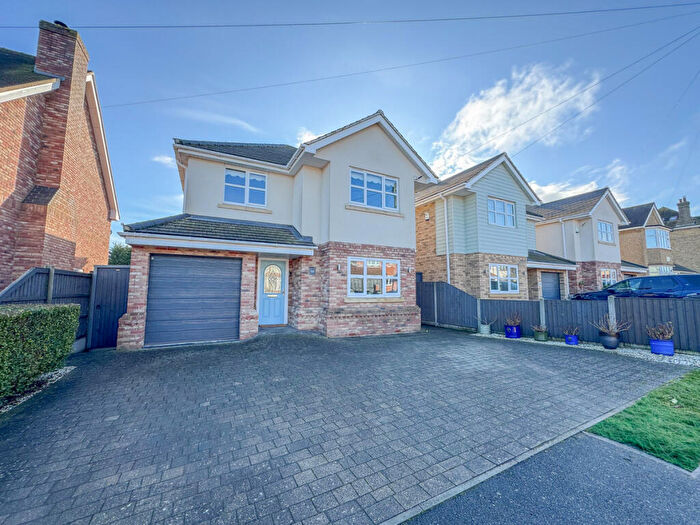
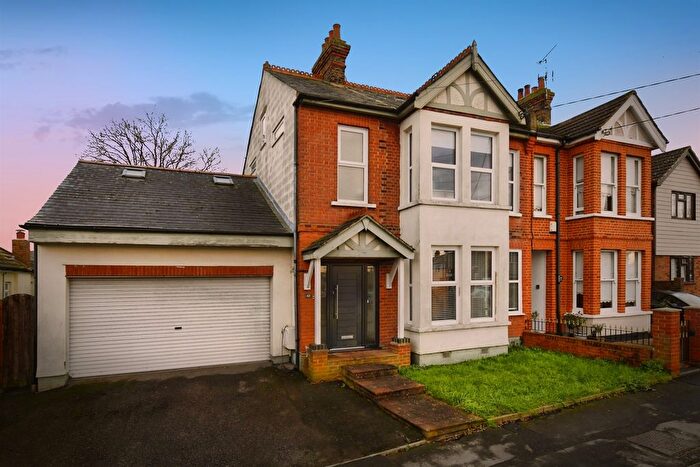
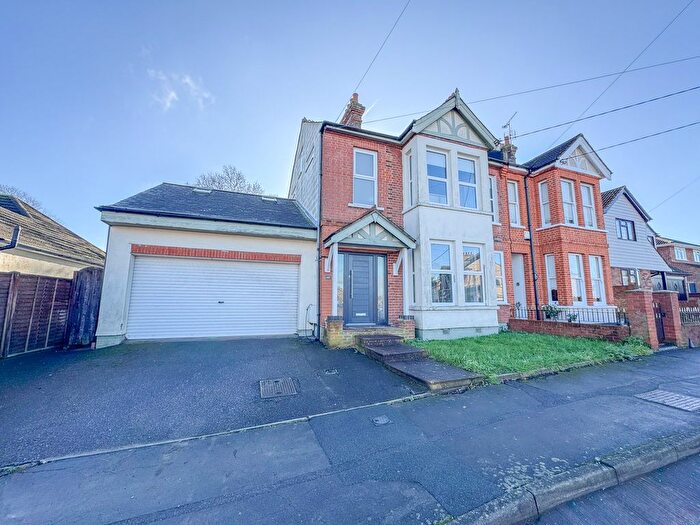
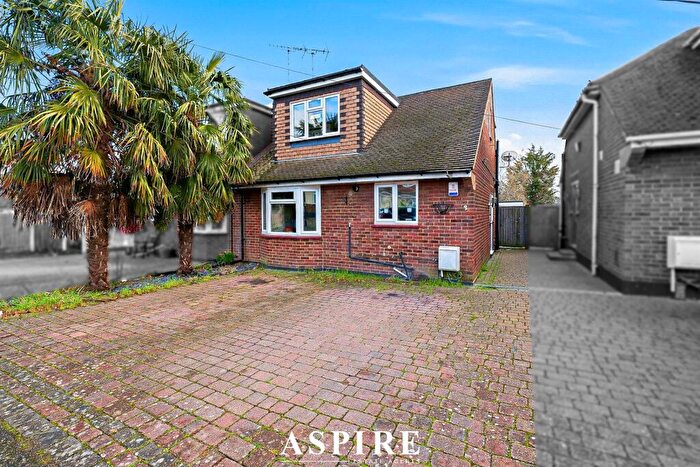
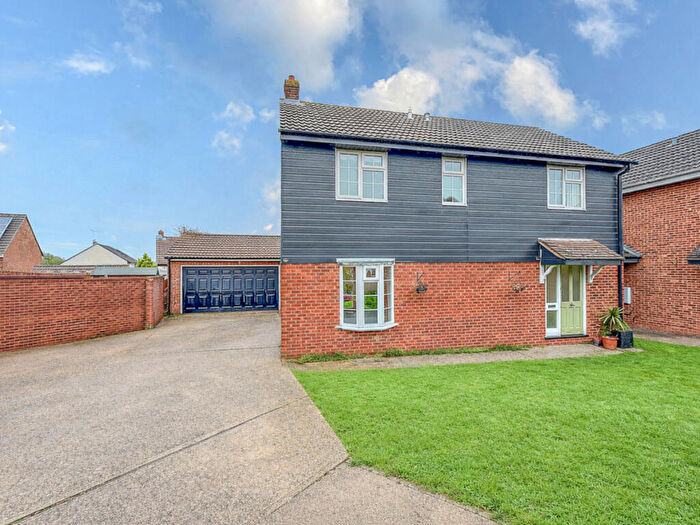
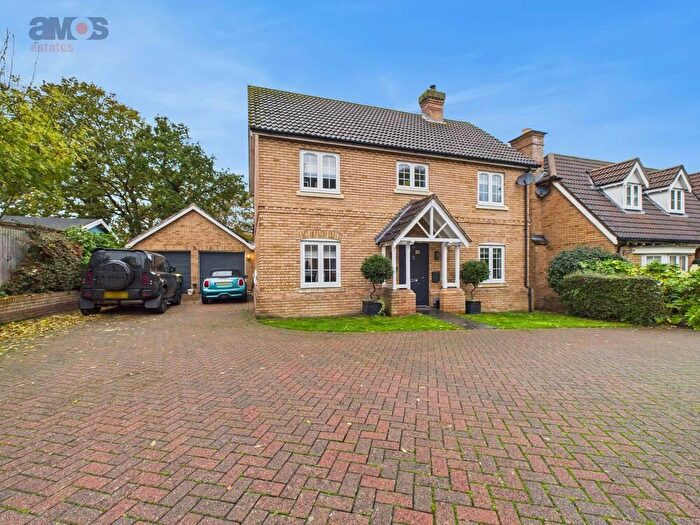
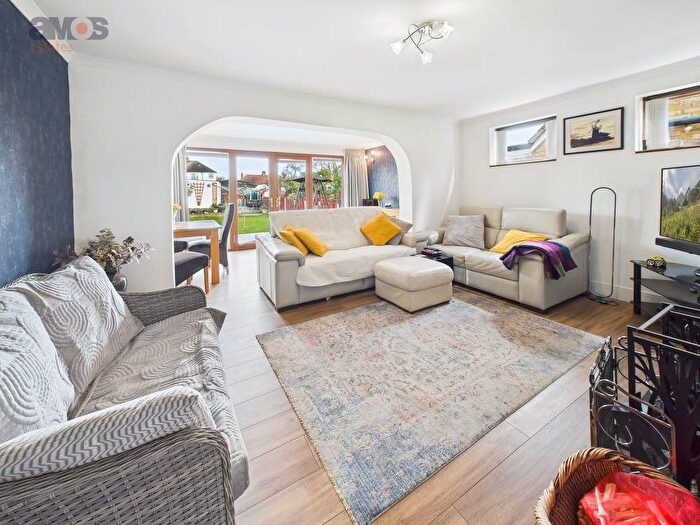
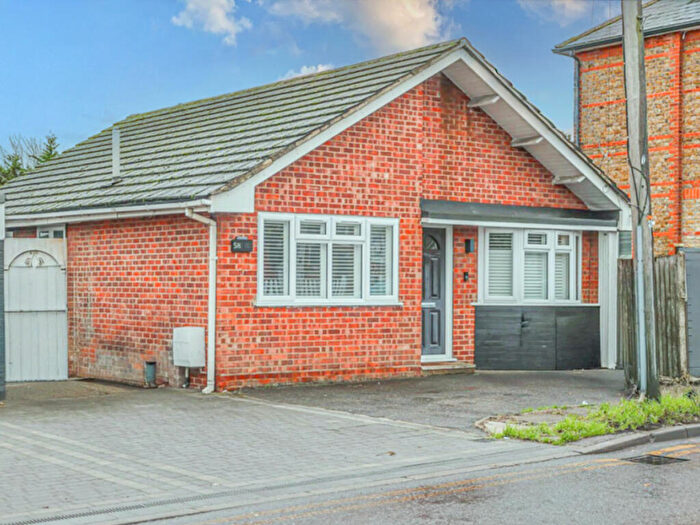
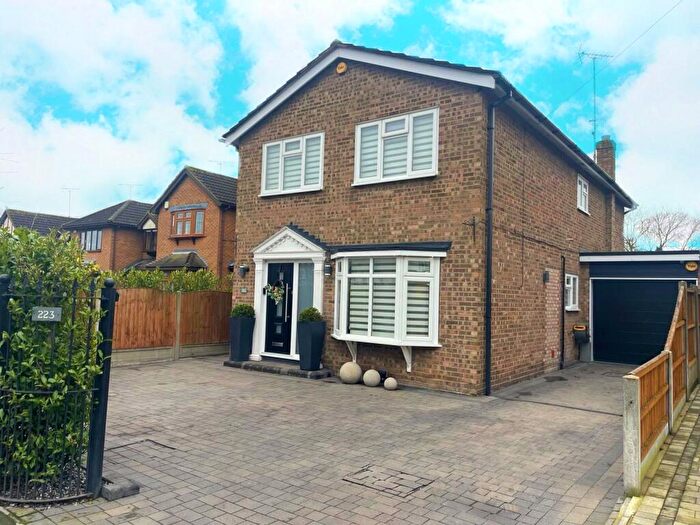
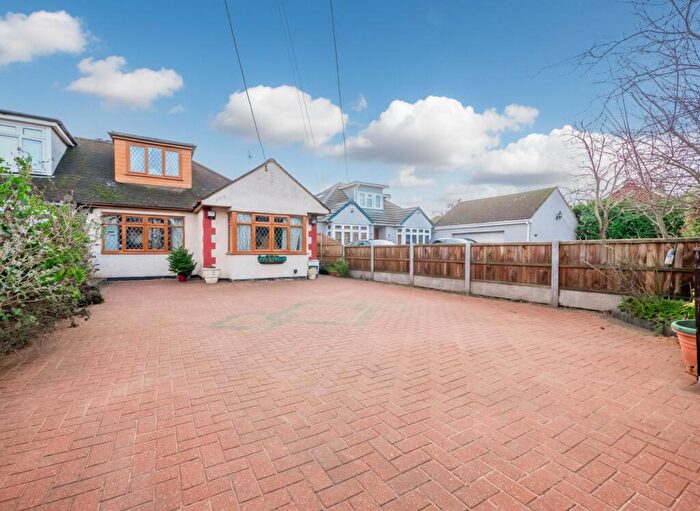
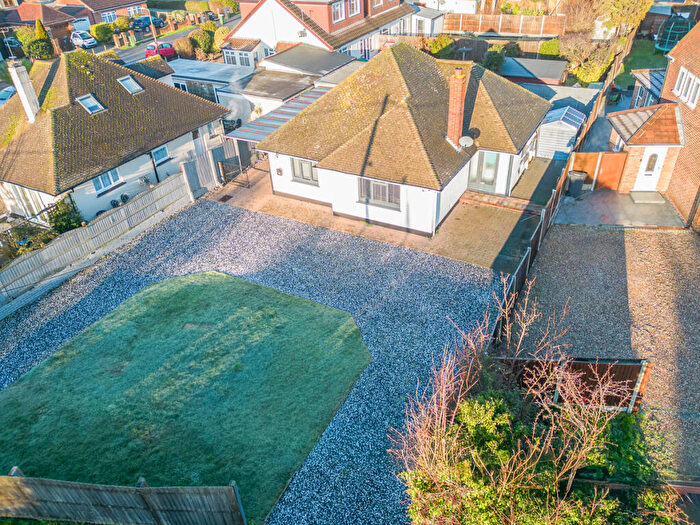
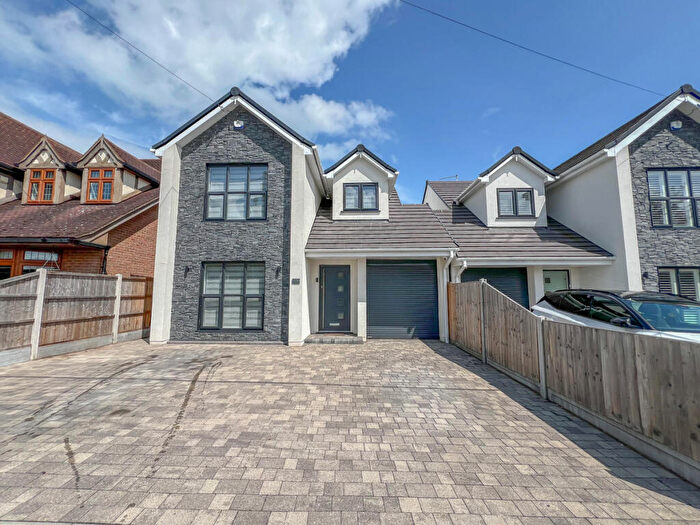
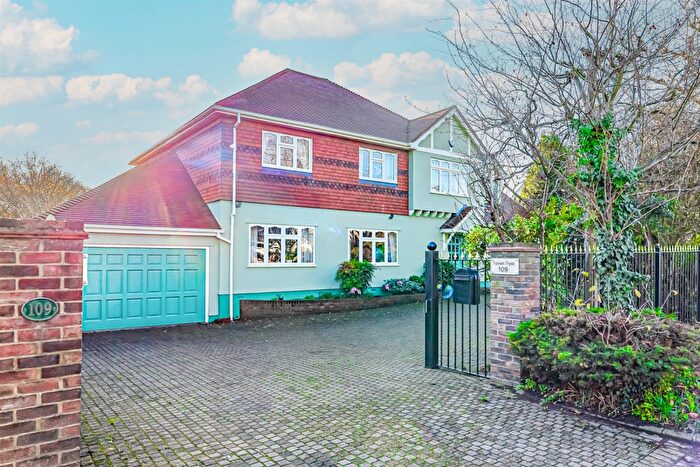
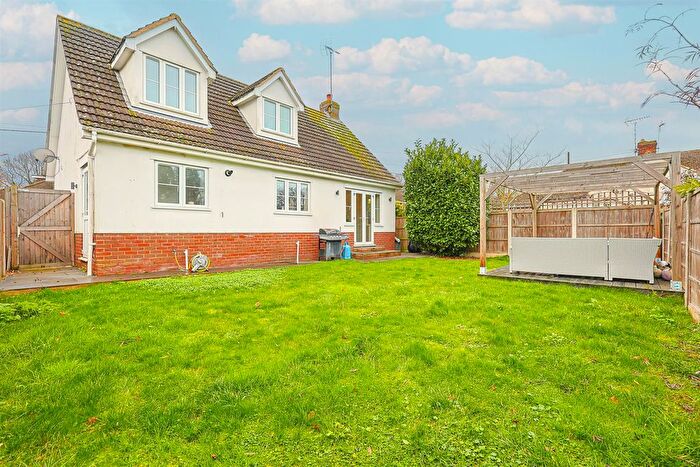
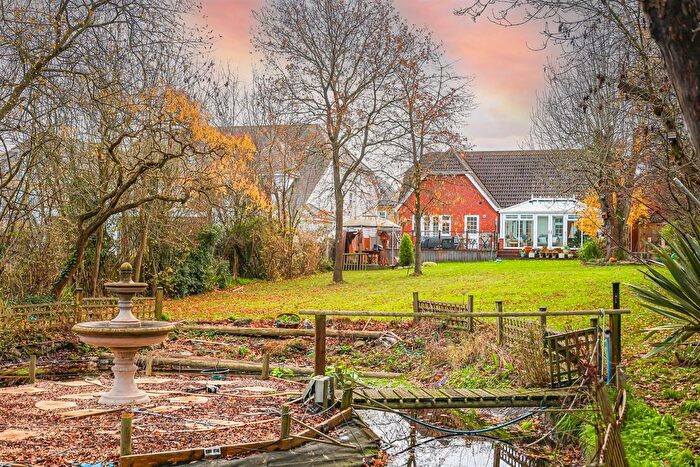
Properties for sale in Hockley
Roads and Postcodes in Hockley
Navigate through our locations to find the location of your next house in Hockley, Hockley for sale or to rent.
| Streets | Postcodes |
|---|---|
| Bartlett View | SS5 4FX |
| Blountswood Road | SS5 6BU |
| Buckingham Road | SS5 4XN |
| Cedar Mews | SS5 4RZ |
| Church Road | SS5 6AF |
| Eldon Way | SS5 4AA |
| Folly Lane | SS5 4FW |
| Foundary Business Park | SS5 4HS |
| Greensward Lane | SS5 5JB |
| Main Road | SS5 4RN SS5 4RQ SS5 4GE |
| Plumberow Avenue | SS5 5BJ |
| Pond Chase | SS5 4FS SS5 4FU |
| Southend Road | SS5 4QN |
| Spa Road | SS5 4BE |
| Station Approach | SS5 4BG |
| SS5 4BA SS5 4BF SS5 4BJ SS5 4QW SS5 4TN SS5 4WL SS5 4YG SS5 4YL SS5 5YW SS5 5YY SS5 9AE SS5 9AH SS5 9AN SS5 9BA SS5 9BL SS5 9BR SS5 9BT SS5 9BW SS5 9BX SS5 9DB SS5 9DD SS5 9DF SS5 9DJ SS5 9DR |
Transport near Hockley
- FAQ
- Price Paid By Year
- Property Type Price
Frequently asked questions about Hockley
What is the average price for a property for sale in Hockley?
The average price for a property for sale in Hockley is £399,428. This amount is 11% lower than the average price in Hockley. There are 1,418 property listings for sale in Hockley.
What streets have the most expensive properties for sale in Hockley?
The street with the most expensive properties for sale in Hockley is Pond Chase at an average of £444,200.
What streets have the most affordable properties for sale in Hockley?
The street with the most affordable properties for sale in Hockley is Folly Lane at an average of £287,500.
Which train stations are available in or near Hockley?
Some of the train stations available in or near Hockley are Hockley, Rayleigh and Rochford.
Property Price Paid in Hockley by Year
The average sold property price by year was:
| Year | Average Sold Price | Price Change |
Sold Properties
|
|---|---|---|---|
| 2025 | £570,000 | 35% |
1 Property |
| 2024 | £371,000 | -17% |
6 Properties |
| 2022 | £432,500 | -5% |
4 Properties |
| 2021 | £452,916 | -10% |
6 Properties |
| 2020 | £498,400 | 17% |
5 Properties |
| 2019 | £415,611 | -13% |
9 Properties |
| 2018 | £468,653 | 29% |
26 Properties |
| 2017 | £330,967 | 20% |
16 Properties |
| 2016 | £264,165 | -190% |
3 Properties |
| 2010 | £765,000 | - |
1 Property |
Property Price per Property Type in Hockley
Here you can find historic sold price data in order to help with your property search.
The average Property Paid Price for specific property types in the last three years are:
| Property Type | Average Sold Price | Sold Properties |
|---|---|---|
| Detached House | £570,000.00 | 1 Detached House |
| Terraced House | £455,000.00 | 1 Terraced House |
| Semi Detached House | £398,666.00 | 3 Semi Detached Houses |
| Flat | £287,500.00 | 2 Flats |

