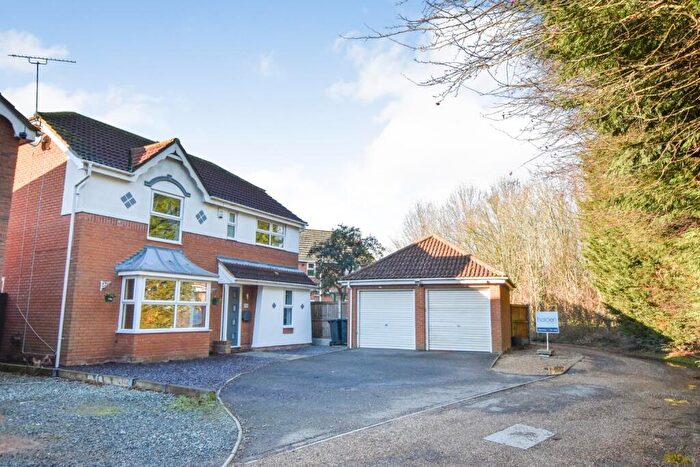
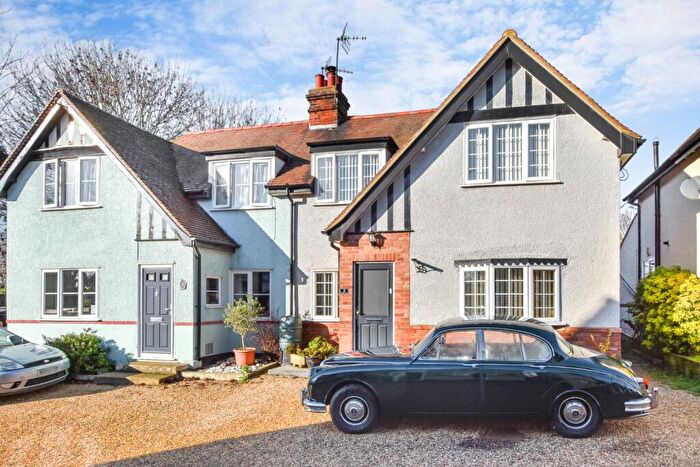
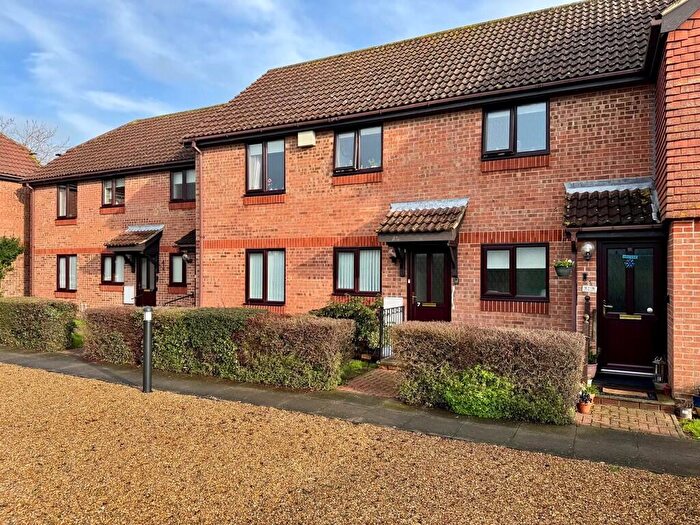
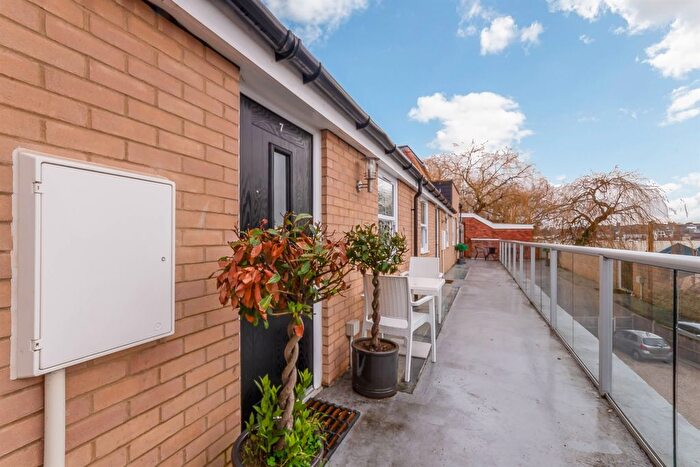
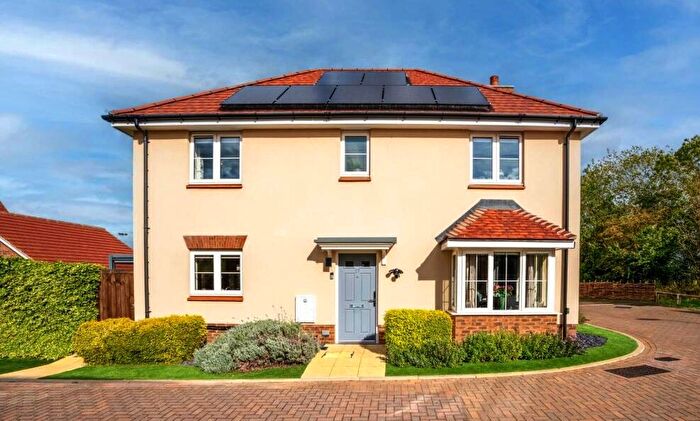
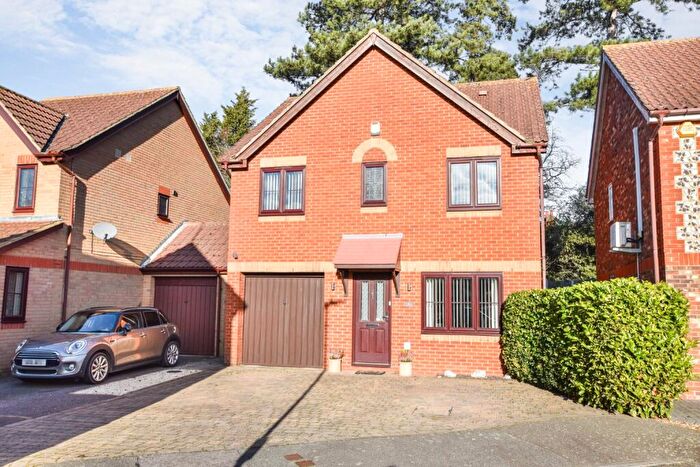
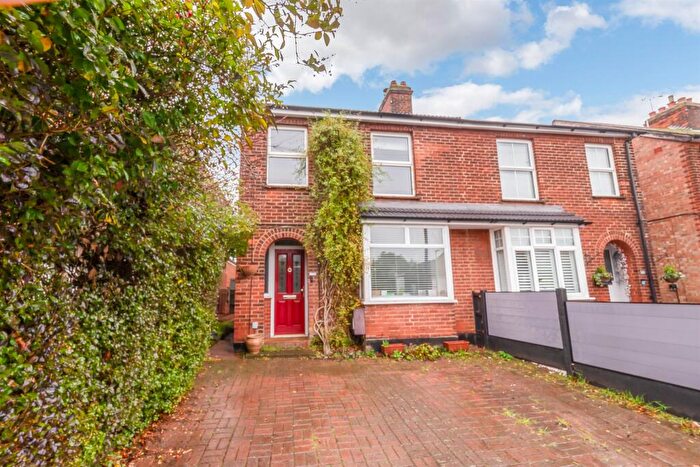
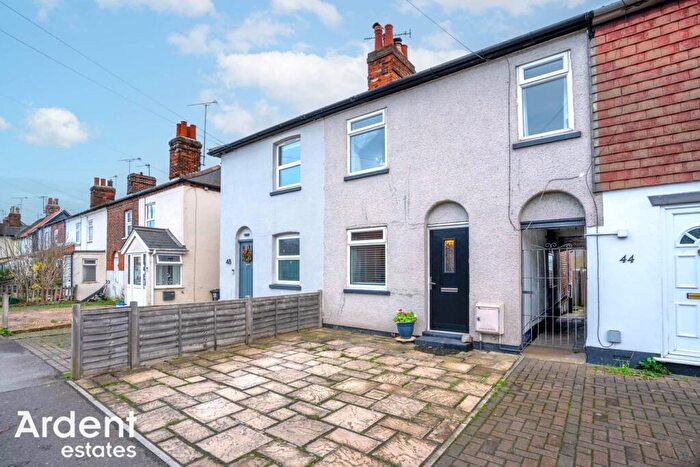
Houses for sale & to rent in Heybridge East, Maldon
House Prices in Heybridge East
Properties in Heybridge East have an average house price of £361,192.00 and had 221 Property Transactions within the last 3 years¹.
Heybridge East is an area in Maldon, Essex with 1,684 households², where the most expensive property was sold for £760,000.00.
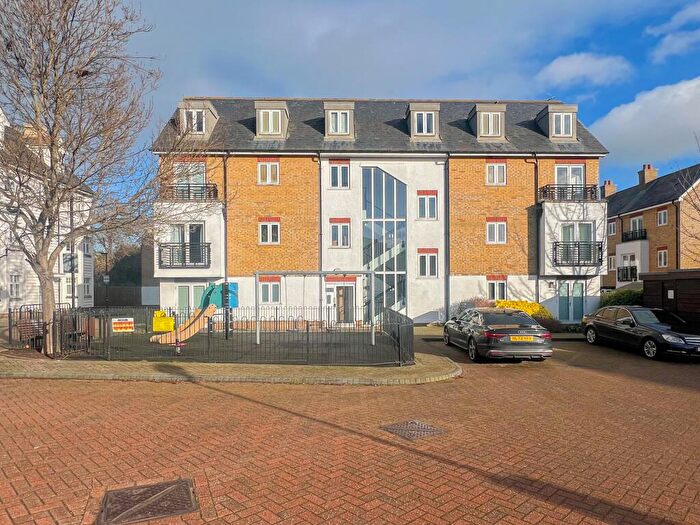
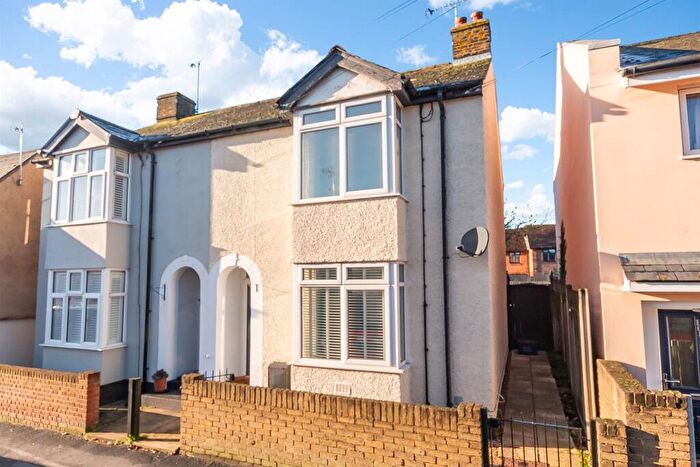
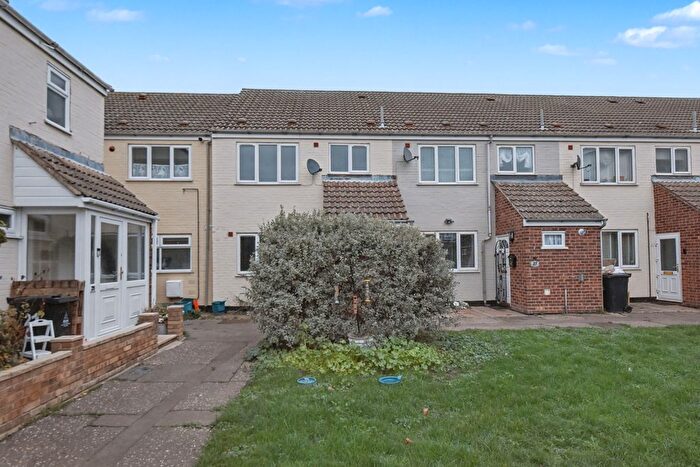
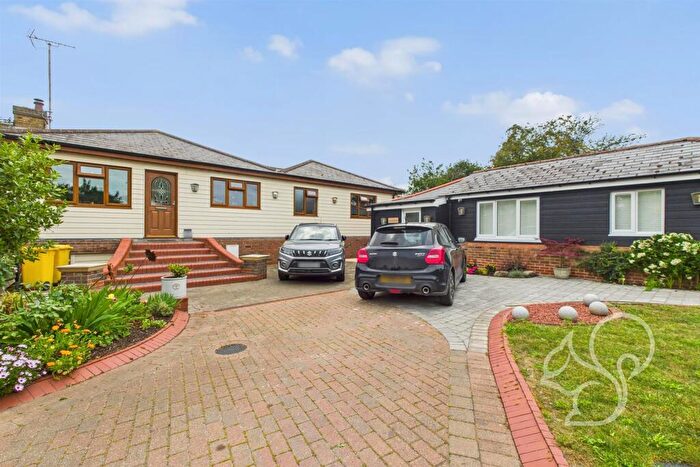
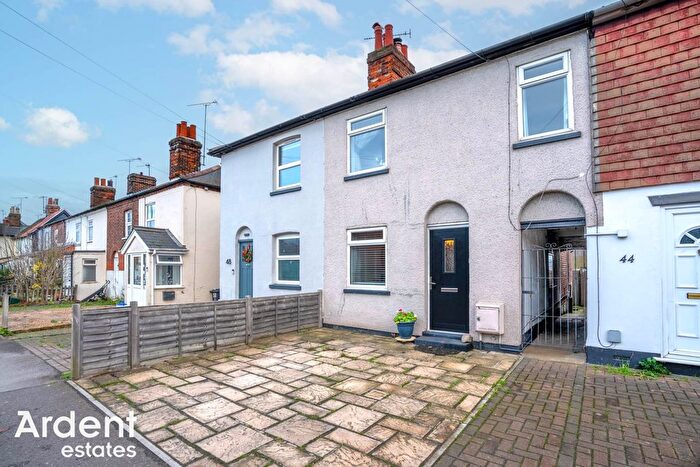
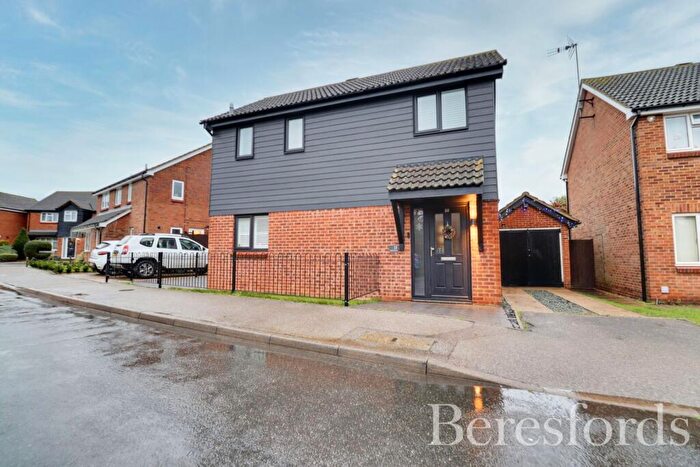
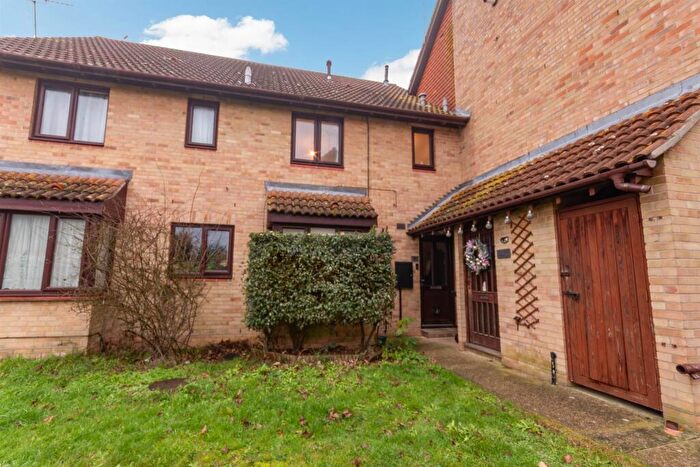
Properties for sale in Heybridge East
Roads and Postcodes in Heybridge East
Navigate through our locations to find the location of your next house in Heybridge East, Maldon for sale or to rent.
| Streets | Postcodes |
|---|---|
| Avocet Way | CM9 4TW |
| Basin Road | CM9 4RG CM9 4RJ CM9 4RN CM9 4RP CM9 4RQ CM9 4RS CM9 4RW CM9 4RY |
| Battle Rise | CM9 4PF |
| Blackwater Close | CM9 4SB |
| Broad Street Green Road | CM9 4BE CM9 8PD |
| Burrswood Place | CM9 4UQ |
| Cedar Chase | CM9 4NR |
| Chapel Lane | CM9 4RR |
| Coates Close | CM9 4PB |
| Colchester Road | CM9 4AN CM9 4UY |
| Coopers Avenue | CM9 4YX CM9 4YY |
| Curlew Close | CM9 4YB |
| Drapers Chase | CM9 4QT |
| Dunlin Close | CM9 4AG |
| Elm Avenue | CM9 4NT |
| Fir Tree Walk | CM9 4NS |
| Freshwater Crescent | CM9 4PA |
| Glebe Road | CM9 4AR |
| Goldhanger Road | CM9 4QR CM9 4QS CM9 4QU CM9 4QX CM9 4RA CM9 4RF CM9 4SA |
| Hall Bridge Rise | CM9 4PD |
| Hall Road | CM9 4NG CM9 4NH CM9 4NJ CM9 4QF CM9 4LA CM9 4NF |
| Harfred Avenue | CM9 4RH |
| Hering Drive | CM9 4PP |
| Heron Way | CM9 4YA |
| Heybridge | CM9 4SD |
| Heybridge Hall Gardens | CM9 4BU |
| Kingfisher Close | CM9 4UF |
| Kittiwake Drive | CM9 4TN |
| Lake Mead | CM9 4UJ |
| Lapwing Drive | CM9 4TJ |
| Larch Walk | CM9 4TS |
| Lawling Avenue | CM9 4YD CM9 4YT |
| Limbourne Drive | CM9 4YU |
| Lockhill | CM9 4RX |
| Maple Avenue | CM9 4BP |
| Maritime Avenue | CM9 4RT |
| Mayland Close | CM9 4YR |
| Myrtle Villas | CM9 4NE |
| Navigation Place | CM9 4NP |
| Northey View | CM9 4PH |
| Oliver Close | CM9 4PJ |
| Ramsey Close | CM9 4YZ |
| Redshank Drive | CM9 4UE |
| Rennie Walk | CM9 4QH |
| Rowan Drive | CM9 4BW CM9 4TU |
| Saltcote Maltings | CM9 4QP |
| Sanderling Gardens | CM9 4TP |
| Sandpiper Close | CM9 4TH |
| Scraley Road | CM9 4BL CM9 8FJ |
| Southey Close | CM9 4YW |
| Spinnaker Drive | CM9 4UG |
| St Georges Close | CM9 4RZ |
| St Pauls Mews | CM9 4QZ |
| Stebbens Way | CM9 4PU |
| Steeple Close | CM9 4YL |
| Swan Court | CM9 4PE |
| The Chase | CM9 8UH |
| The Colliers | CM9 4SE |
| The Stiles | CM9 4SF |
| The Street | CM9 4NB |
| Thirslet Drive | CM9 4YN |
| Towers Road | CM9 4AP CM9 4AW |
| Triangle Place | CM9 4BT |
| Virley Close | CM9 4YS |
| Wagtail Drive | CM9 4UD CM9 4YP |
| Well Terrace | CM9 4NN |
| Wharf Road | CM9 4QY |
| Willow Walk | CM9 4TT |
Transport near Heybridge East
-
Witham Station
-
Hatfield Peverel Station
-
North Fambridge Station
-
Althorne Station
-
Kelvedon Station
-
South Woodham Ferrers Station
-
Southminster Station
-
White Notley Station
-
Burnham-On-Crouch Station
-
Hockley Station
- FAQ
- Price Paid By Year
- Property Type Price
Frequently asked questions about Heybridge East
What is the average price for a property for sale in Heybridge East?
The average price for a property for sale in Heybridge East is £361,192. This amount is 7% lower than the average price in Maldon. There are 2,179 property listings for sale in Heybridge East.
What streets have the most expensive properties for sale in Heybridge East?
The streets with the most expensive properties for sale in Heybridge East are Hering Drive at an average of £725,000, The Colliers at an average of £592,500 and St Georges Close at an average of £563,333.
What streets have the most affordable properties for sale in Heybridge East?
The streets with the most affordable properties for sale in Heybridge East are Colchester Road at an average of £190,625, Wagtail Drive at an average of £227,684 and Triangle Place at an average of £231,666.
Which train stations are available in or near Heybridge East?
Some of the train stations available in or near Heybridge East are Witham, Hatfield Peverel and North Fambridge.
Property Price Paid in Heybridge East by Year
The average sold property price by year was:
| Year | Average Sold Price | Price Change |
Sold Properties
|
|---|---|---|---|
| 2025 | £377,273 | 8% |
42 Properties |
| 2024 | £347,388 | -8% |
63 Properties |
| 2023 | £374,852 | 6% |
51 Properties |
| 2022 | £353,461 | -2% |
65 Properties |
| 2021 | £359,279 | 11% |
91 Properties |
| 2020 | £318,701 | 6% |
77 Properties |
| 2019 | £301,055 | -0,1% |
63 Properties |
| 2018 | £301,499 | -4% |
58 Properties |
| 2017 | £313,660 | 5% |
68 Properties |
| 2016 | £296,964 | 11% |
88 Properties |
| 2015 | £263,049 | 16% |
81 Properties |
| 2014 | £220,219 | 7% |
96 Properties |
| 2013 | £205,184 | -31% |
72 Properties |
| 2012 | £269,640 | 5% |
70 Properties |
| 2011 | £255,023 | 10% |
90 Properties |
| 2010 | £228,486 | 10% |
66 Properties |
| 2009 | £206,304 | -11% |
58 Properties |
| 2008 | £229,780 | 7% |
63 Properties |
| 2007 | £213,300 | 19% |
119 Properties |
| 2006 | £172,012 | 0,3% |
104 Properties |
| 2005 | £171,519 | 3% |
79 Properties |
| 2004 | £166,464 | 14% |
109 Properties |
| 2003 | £142,710 | -7% |
101 Properties |
| 2002 | £152,630 | 33% |
118 Properties |
| 2001 | £102,775 | 5% |
118 Properties |
| 2000 | £97,480 | 12% |
136 Properties |
| 1999 | £85,429 | 12% |
172 Properties |
| 1998 | £75,140 | 7% |
116 Properties |
| 1997 | £69,915 | 22% |
130 Properties |
| 1996 | £54,409 | -1% |
102 Properties |
| 1995 | £55,060 | - |
90 Properties |
Property Price per Property Type in Heybridge East
Here you can find historic sold price data in order to help with your property search.
The average Property Paid Price for specific property types in the last three years are:
| Property Type | Average Sold Price | Sold Properties |
|---|---|---|
| Semi Detached House | £335,851.00 | 64 Semi Detached Houses |
| Detached House | £457,045.00 | 87 Detached Houses |
| Terraced House | £305,644.00 | 45 Terraced Houses |
| Flat | £192,480.00 | 25 Flats |

