Houses for sale & to rent in Heybridge West, Maldon
House Prices in Heybridge West
Properties in Heybridge West have an average house price of £381,926.00 and had 170 Property Transactions within the last 3 years¹.
Heybridge West is an area in Maldon, Essex with 1,683 households², where the most expensive property was sold for £1,165,000.00.
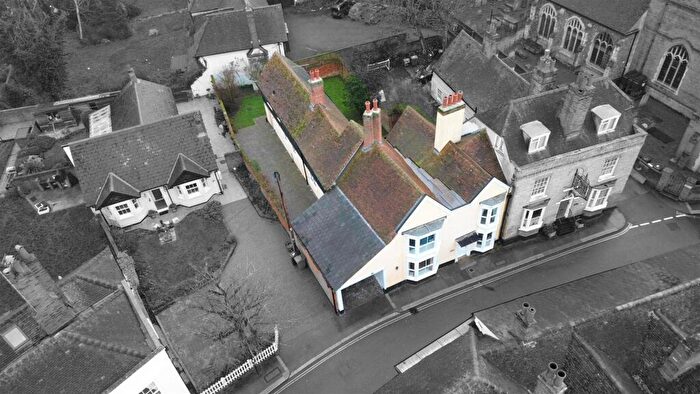
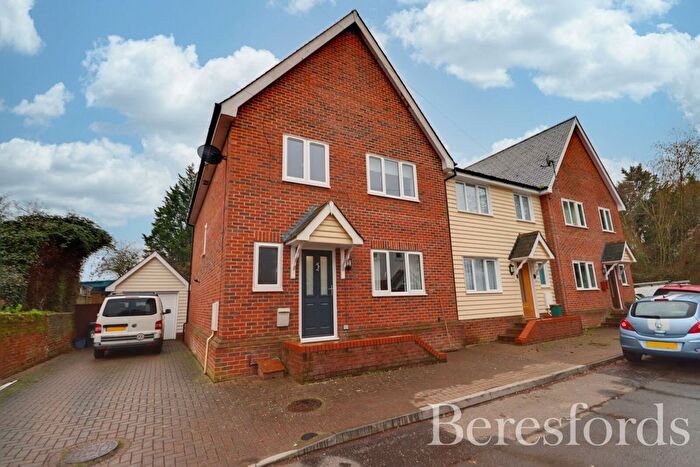
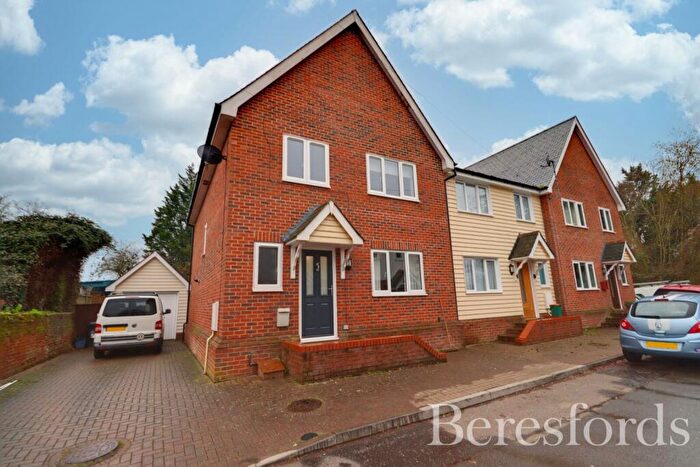
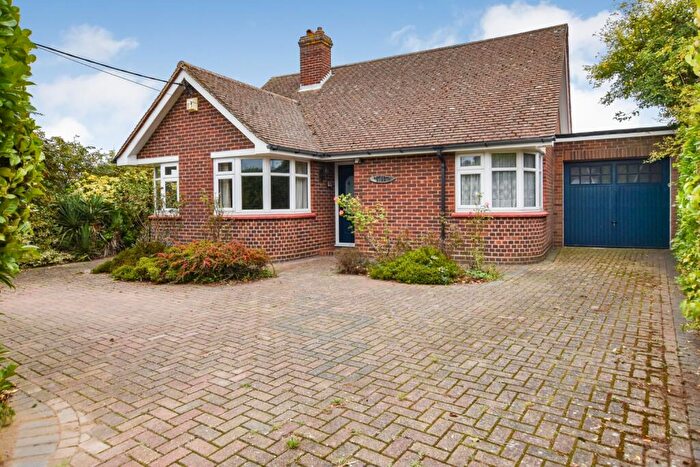
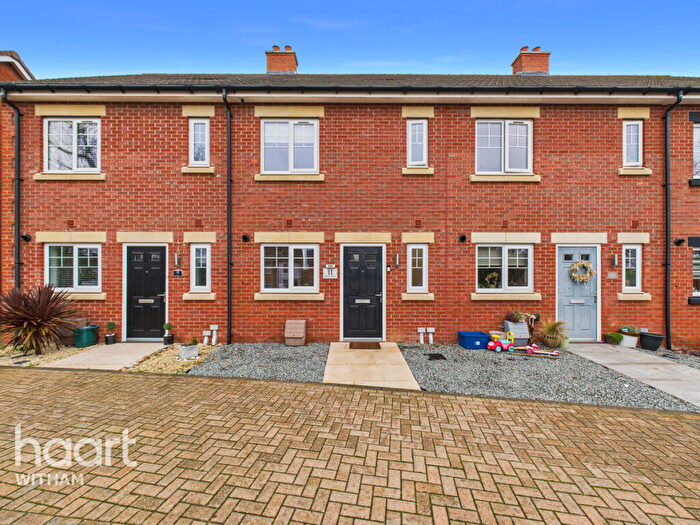
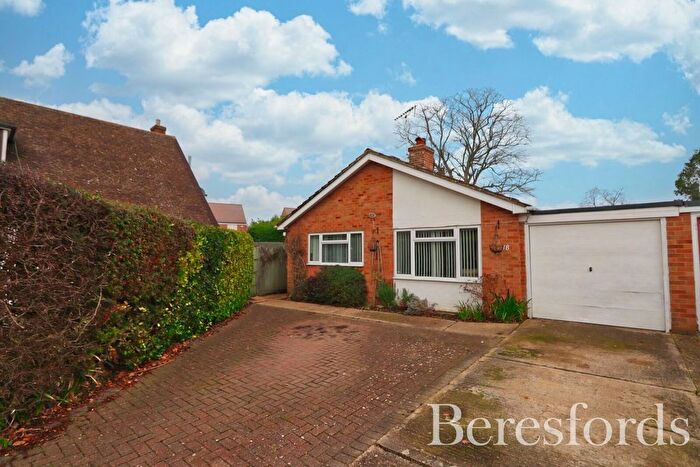
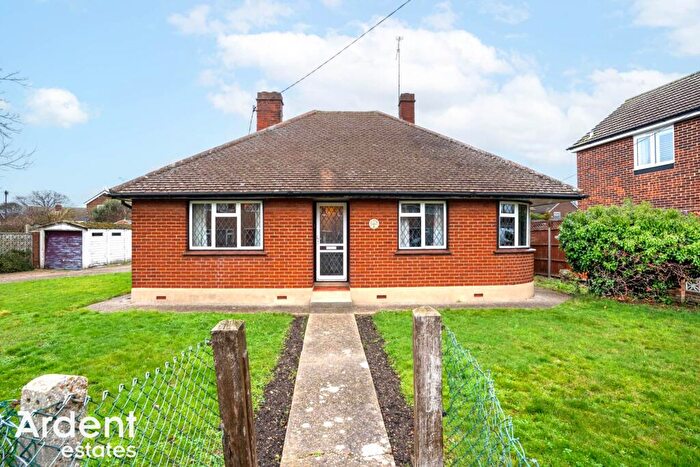
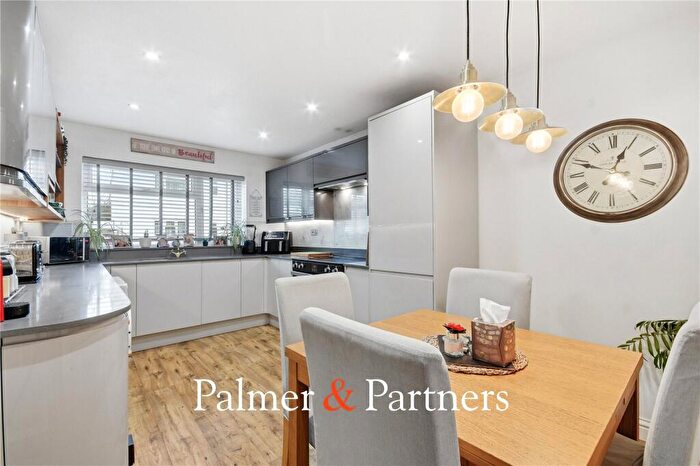
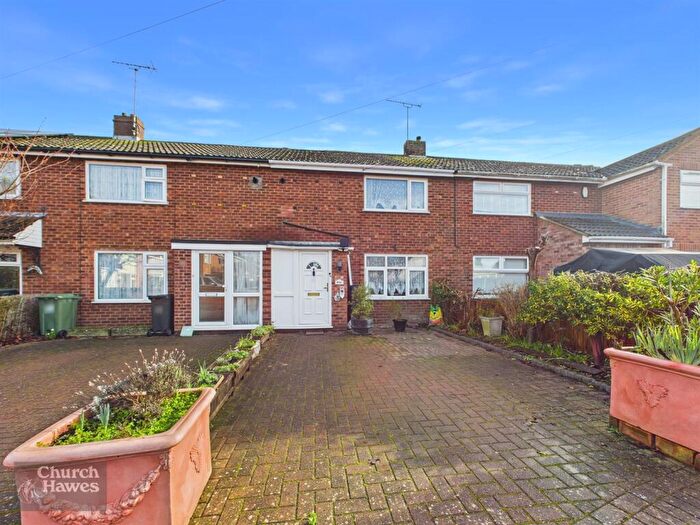
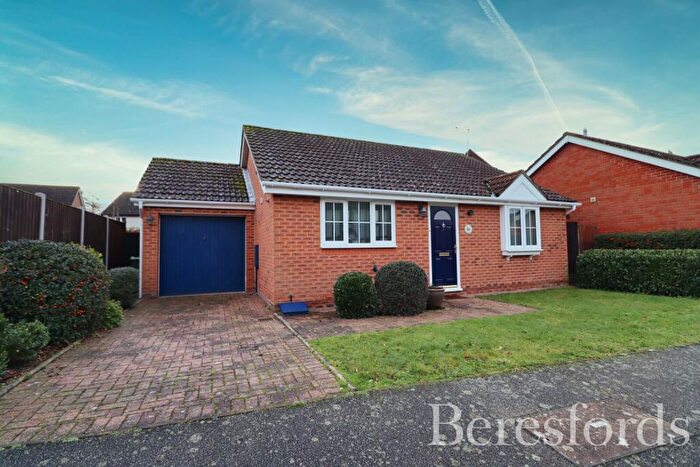
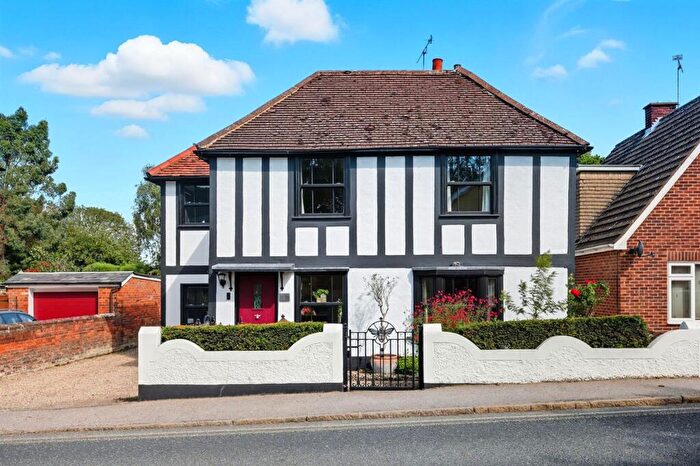
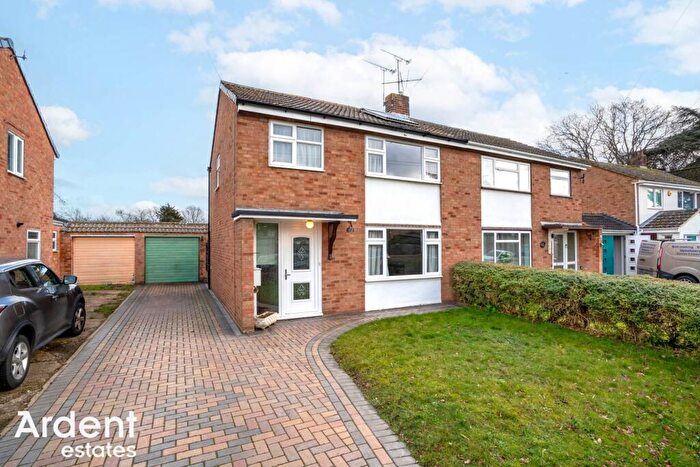
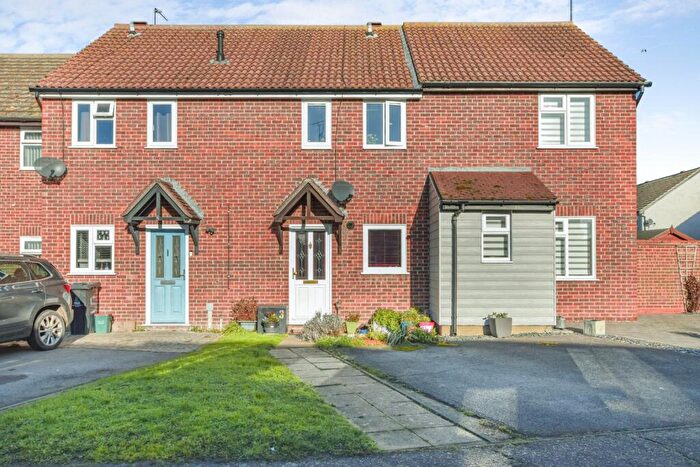
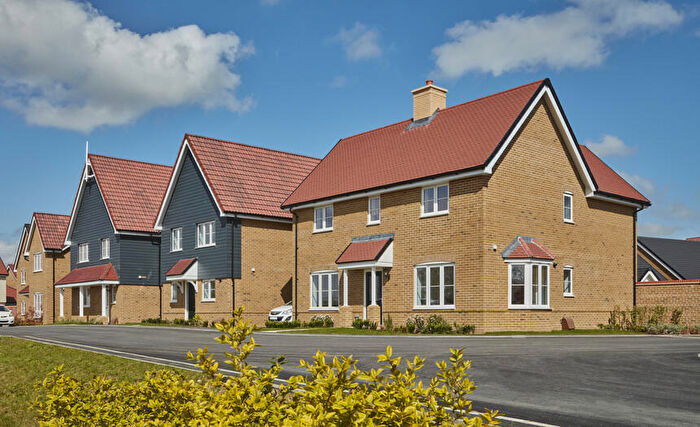
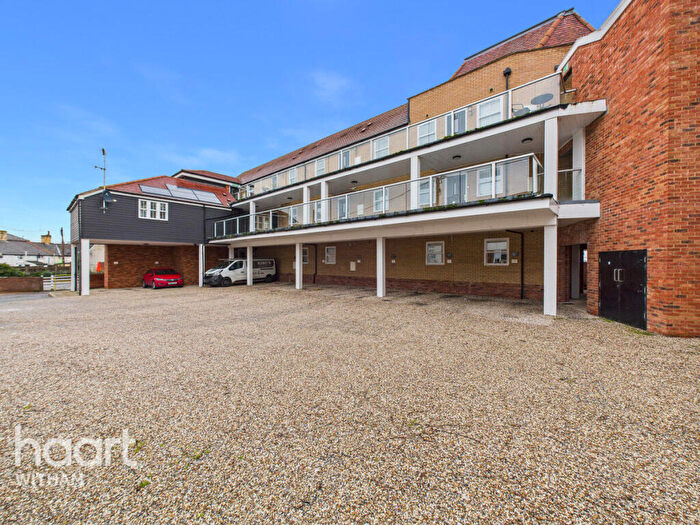
Properties for sale in Heybridge West
Roads and Postcodes in Heybridge West
Navigate through our locations to find the location of your next house in Heybridge West, Maldon for sale or to rent.
| Streets | Postcodes |
|---|---|
| Abbotsmead | CM9 4PT |
| Acorn Close | CM9 4PG |
| Anchor Lane | CM9 4LS CM9 4LP |
| Ash Grove | CM9 4BB |
| Barbrook Avenue | CM9 4DR |
| Beeches Road | CM9 4SL |
| Benbridge Close | CM9 4LN |
| Benbridge Industrial Estate | CM9 4ER CM9 4XP |
| Bentalls Shopping Centre | CM9 4GD |
| Bridge Terrace | CM9 4LU |
| Broad Street Green Road | CM9 4BN |
| Chelmer Lane | CM9 4TD |
| Chestnut Avenue | CM9 4BA |
| Colchester Road | CM9 4AL CM9 4DD CM9 4HH |
| Creasen Butt Close | CM9 4QG |
| Crescent Court | CM9 4UL |
| Crescent Road | CM9 4SJ CM9 4SN |
| Doubleday Drive | CM9 4TL |
| Elizabeth Way | CM9 4TG |
| Emperor Close | CM9 4PL |
| Everest Way | CM9 4TX |
| Gill Close | CM9 4TF |
| Hadrians Way | CM9 4QN |
| Harold Rise | CM9 4QW |
| Harvest Way | CM9 4PS |
| Hazelwood Court | CM9 4FB |
| Heybridge Woods View | CM9 4DN |
| Heywood Way | CM9 4AH CM9 4BH CM9 4BJ |
| Hillary Close | CM9 4UA CM9 4UB CM9 4PR |
| Hinton Close | CM9 4DW |
| Holloway Road | CM9 4SG CM9 4SQ CM9 4SW CM9 4TE CM9 4LY |
| Hunt Avenue | CM9 4TY CM9 4TZ CM9 4RU CM9 4TR |
| Kingston Chase | CM9 4TB |
| Langford Meads | CM9 4WF |
| Langford Road | CM9 4SP CM9 4SR |
| Lewis Way | CM9 4DT |
| Long Common | CM9 4US CM9 4UU |
| Mercury Place | CM9 4PN |
| Miller Grove | CM9 4DX |
| Myall Close | CM9 4DU |
| Navigation Cottages | CM9 4NL |
| Oak Road | CM9 4AX |
| Oyster Mews | CM9 4DA |
| Rainbow Mews | CM9 4UP |
| Regency Court | CM9 4EJ |
| River Ebro Road | CM9 4DF |
| Roman Close | CM9 4PW |
| Romanhurst | CM9 4NU CM9 4NY |
| Samian Close | CM9 4PQ |
| Scylla Close | CM9 4BD |
| Spickets Drive | CM9 4DH |
| Springfield Cottages | CM9 4LZ |
| St Andrews Way | CM9 4DJ |
| Stock Chase | CM9 4AA CM9 4AB CM9 4AD CM9 4AJ CM9 4ED |
| Swifts Boulevard | CM9 4DE |
| Sycamore Road | CM9 4AZ |
| Temple Way | CM9 4PX |
| Ten Acre Approach | CM9 4UR |
| The Orchard | CM9 4UN |
| The Roothings | CM9 4NA |
| The Square | CM9 4LT |
| The Street Industrial Estate | CM9 4XB |
| Waring Avenue | CM9 4DG |
| Wood Lane | CM9 4SH |
| Wood Road | CM9 4AS CM9 4AT CM9 4AU |
| Woodfield Cottages | CM9 4BQ |
| CM9 4NW |
Transport near Heybridge West
-
Hatfield Peverel Station
-
Witham Station
-
North Fambridge Station
-
Kelvedon Station
-
Althorne Station
-
South Woodham Ferrers Station
-
White Notley Station
-
Southminster Station
-
Cressing Station
-
Chelmsford Station
- FAQ
- Price Paid By Year
- Property Type Price
Frequently asked questions about Heybridge West
What is the average price for a property for sale in Heybridge West?
The average price for a property for sale in Heybridge West is £381,926. This amount is 3% lower than the average price in Maldon. There are 875 property listings for sale in Heybridge West.
What streets have the most expensive properties for sale in Heybridge West?
The streets with the most expensive properties for sale in Heybridge West are Regency Court at an average of £780,000, The Orchard at an average of £591,500 and Samian Close at an average of £535,000.
What streets have the most affordable properties for sale in Heybridge West?
The streets with the most affordable properties for sale in Heybridge West are Romanhurst at an average of £173,000, The Roothings at an average of £201,000 and Crescent Court at an average of £215,000.
Which train stations are available in or near Heybridge West?
Some of the train stations available in or near Heybridge West are Hatfield Peverel, Witham and North Fambridge.
Property Price Paid in Heybridge West by Year
The average sold property price by year was:
| Year | Average Sold Price | Price Change |
Sold Properties
|
|---|---|---|---|
| 2025 | £385,571 | 1% |
70 Properties |
| 2024 | £383,089 | 2% |
53 Properties |
| 2023 | £375,186 | 2% |
47 Properties |
| 2022 | £367,070 | 8% |
60 Properties |
| 2021 | £337,732 | -0,2% |
88 Properties |
| 2020 | £338,310 | 2% |
102 Properties |
| 2019 | £332,865 | 4% |
130 Properties |
| 2018 | £320,701 | 2% |
79 Properties |
| 2017 | £312,824 | 8% |
66 Properties |
| 2016 | £287,609 | 10% |
73 Properties |
| 2015 | £258,484 | 12% |
78 Properties |
| 2014 | £227,214 | 2% |
53 Properties |
| 2013 | £223,588 | 3% |
64 Properties |
| 2012 | £217,695 | -3% |
41 Properties |
| 2011 | £225,106 | 5% |
46 Properties |
| 2010 | £213,170 | 11% |
49 Properties |
| 2009 | £189,201 | -9% |
48 Properties |
| 2008 | £206,514 | -22% |
32 Properties |
| 2007 | £251,061 | 17% |
134 Properties |
| 2006 | £207,970 | 4% |
136 Properties |
| 2005 | £199,815 | 10% |
92 Properties |
| 2004 | £179,915 | 4% |
108 Properties |
| 2003 | £172,799 | 20% |
100 Properties |
| 2002 | £137,792 | 4% |
121 Properties |
| 2001 | £132,331 | 18% |
143 Properties |
| 2000 | £108,507 | 13% |
167 Properties |
| 1999 | £94,498 | 11% |
132 Properties |
| 1998 | £84,532 | 5% |
115 Properties |
| 1997 | £80,360 | -1% |
139 Properties |
| 1996 | £81,272 | 19% |
114 Properties |
| 1995 | £65,952 | - |
52 Properties |
Property Price per Property Type in Heybridge West
Here you can find historic sold price data in order to help with your property search.
The average Property Paid Price for specific property types in the last three years are:
| Property Type | Average Sold Price | Sold Properties |
|---|---|---|
| Semi Detached House | £349,968.00 | 55 Semi Detached Houses |
| Detached House | £495,338.00 | 59 Detached Houses |
| Terraced House | £300,429.00 | 53 Terraced Houses |
| Flat | £177,166.00 | 3 Flats |

