Houses for sale & to rent in Maldon South, Maldon
House Prices in Maldon South
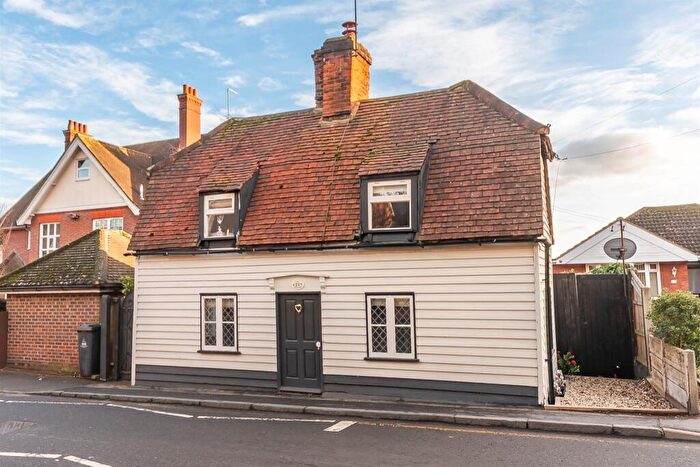
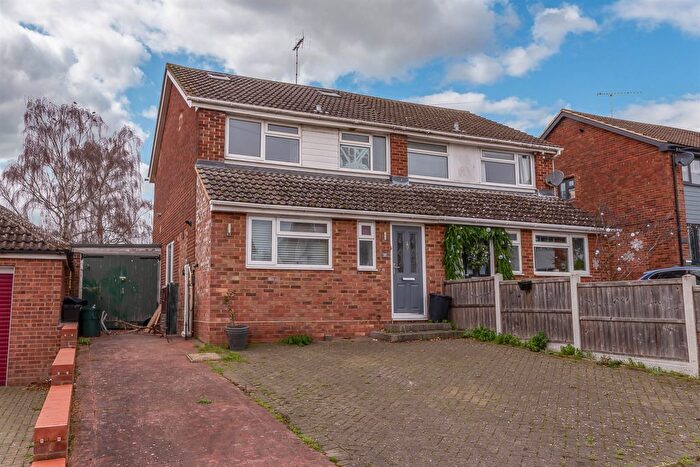
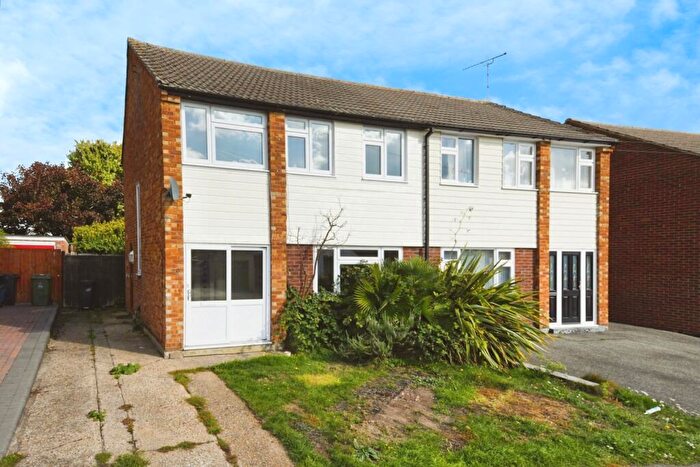
Properties in Maldon South have an average house price of £386,055.00 and had 150 Property Transactions within the last 3 years¹.
Maldon South is an area in Maldon, Essex with 1,572 households², where the most expensive property was sold for £690,000.00.
Properties for sale in Maldon South
Roads and Postcodes in Maldon South
Navigate through our locations to find the location of your next house in Maldon South, Maldon for sale or to rent.
| Streets | Postcodes |
|---|---|
| Blythe Way | CM9 6UE |
| Braeburn Drive | CM9 5EJ |
| Brooke Square | CM9 6DS |
| Browning Road | CM9 6BU |
| Burns Close | CM9 6DN |
| Centaur Way | CM9 6XU |
| Chaucer Close | CM9 6DA |
| Chichester Way | CM9 6YY |
| Clayton Way | CM9 6WB |
| Coleridge Road | CM9 6DH |
| Cross Road | CM9 5ED CM9 5EE |
| Drayton Close | CM9 6XA |
| Dryden Close | CM9 6DG |
| Eliot Way | CM9 6DQ |
| Falcon Fields | CM9 6YP |
| Fambridge Close | CM9 6DJ |
| Fambridge Road | CM9 6BG CM9 6BH CM9 6BJ CM9 6BQ |
| Francis Mews | CM9 6YZ |
| Frobisher Close | CM9 6WF |
| Johnston Way | CM9 6XZ |
| Keats Close | CM9 6DB |
| King Street | CM9 5DX CM9 5DY |
| Knox Close | CM9 6XY |
| Leslie Newnham Court | CM9 6XG |
| Longfellow Road | CM9 6BD |
| Manse Chase | CM9 5EA |
| Mariners Way | CM9 6YW CM9 6YX |
| Marlowe Close | CM9 6DE |
| Masefield Road | CM9 6DF |
| Mayflower Drive | CM9 6XX |
| Memory Close | CM9 6XT |
| Milton Road | CM9 6BT |
| Mirosa Reach | CM9 6XS |
| Nelson Crescent | CM9 6WE |
| Nightingale Corner | CM9 6XF |
| Poulton Close | CM9 6GA CM9 6GB CM9 6NG |
| Queen Street | CM9 5DP |
| Queens Avenue | CM9 5DZ |
| Ridgeway | CM9 6UF |
| Sassoon Way | CM9 6DW |
| Shakespeare Drive | CM9 6DP CM9 6DR |
| Shelley Close | CM9 6DD |
| Spencer Close | CM9 6BX |
| Tennyson Road | CM9 6BE |
| Volwycke Avenue | CM9 6DL |
| Wallace Binder Close | CM9 6LG |
| Warwick Close | CM9 6BS |
| Warwick Crescent | CM9 6BW |
| Warwick Drive | CM9 6BP |
| Wordsworth Avenue | CM9 6BY CM9 6BZ |
Transport near Maldon South
-
North Fambridge Station
-
Hatfield Peverel Station
-
South Woodham Ferrers Station
-
Althorne Station
-
Witham Station
-
Southminster Station
-
Hockley Station
-
Kelvedon Station
-
Battlesbridge Station
-
Burnham-On-Crouch Station
- FAQ
- Price Paid By Year
- Property Type Price
Frequently asked questions about Maldon South
What is the average price for a property for sale in Maldon South?
The average price for a property for sale in Maldon South is £386,055. This amount is 1% lower than the average price in Maldon. There are 1,004 property listings for sale in Maldon South.
What streets have the most expensive properties for sale in Maldon South?
The streets with the most expensive properties for sale in Maldon South are Memory Close at an average of £574,000, Chichester Way at an average of £515,000 and Clayton Way at an average of £514,400.
What streets have the most affordable properties for sale in Maldon South?
The streets with the most affordable properties for sale in Maldon South are Warwick Drive at an average of £240,500, Dryden Close at an average of £280,000 and Poulton Close at an average of £282,500.
Which train stations are available in or near Maldon South?
Some of the train stations available in or near Maldon South are North Fambridge, Hatfield Peverel and South Woodham Ferrers.
Property Price Paid in Maldon South by Year
The average sold property price by year was:
| Year | Average Sold Price | Price Change |
Sold Properties
|
|---|---|---|---|
| 2025 | £387,460 | 4% |
32 Properties |
| 2024 | £371,248 | -4% |
34 Properties |
| 2023 | £386,404 | -3% |
42 Properties |
| 2022 | £396,622 | 10% |
42 Properties |
| 2021 | £355,657 | 5% |
76 Properties |
| 2020 | £336,161 | 5% |
48 Properties |
| 2019 | £320,022 | -3% |
45 Properties |
| 2018 | £329,833 | 1% |
48 Properties |
| 2017 | £326,478 | 5% |
51 Properties |
| 2016 | £309,499 | 13% |
62 Properties |
| 2015 | £268,287 | 9% |
54 Properties |
| 2014 | £244,209 | 10% |
42 Properties |
| 2013 | £220,780 | -0,5% |
67 Properties |
| 2012 | £221,804 | 1% |
45 Properties |
| 2011 | £219,603 | -1% |
52 Properties |
| 2010 | £222,067 | 9% |
57 Properties |
| 2009 | £202,085 | -11% |
49 Properties |
| 2008 | £224,229 | 3% |
47 Properties |
| 2007 | £216,519 | 2% |
82 Properties |
| 2006 | £212,745 | 3% |
89 Properties |
| 2005 | £206,095 | -1% |
53 Properties |
| 2004 | £207,590 | 14% |
88 Properties |
| 2003 | £178,866 | 10% |
102 Properties |
| 2002 | £160,620 | 17% |
107 Properties |
| 2001 | £132,531 | 17% |
128 Properties |
| 2000 | £110,624 | 11% |
99 Properties |
| 1999 | £98,933 | 1% |
145 Properties |
| 1998 | £98,296 | 9% |
147 Properties |
| 1997 | £89,720 | 12% |
192 Properties |
| 1996 | £78,705 | -2% |
145 Properties |
| 1995 | £80,593 | - |
179 Properties |
Property Price per Property Type in Maldon South
Here you can find historic sold price data in order to help with your property search.
The average Property Paid Price for specific property types in the last three years are:
| Property Type | Average Sold Price | Sold Properties |
|---|---|---|
| Semi Detached House | £352,054.00 | 55 Semi Detached Houses |
| Detached House | £482,775.00 | 53 Detached Houses |
| Terraced House | £310,189.00 | 41 Terraced Houses |
| Flat | £240,500.00 | 1 Flat |

