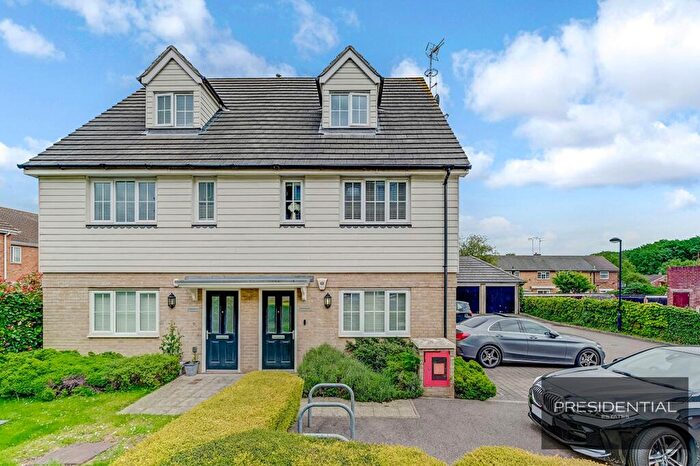
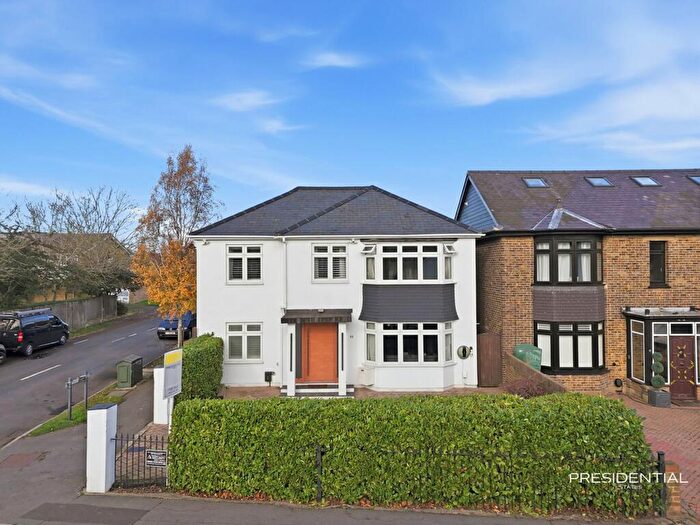
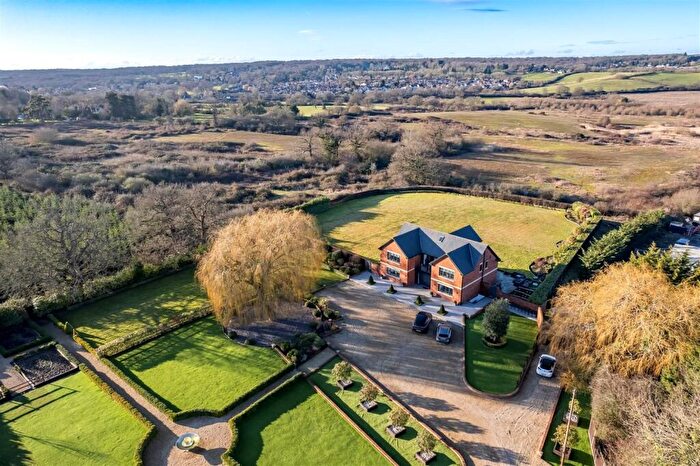
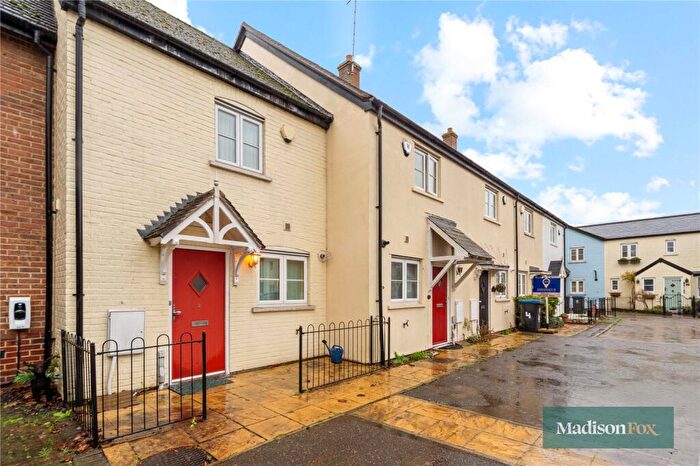
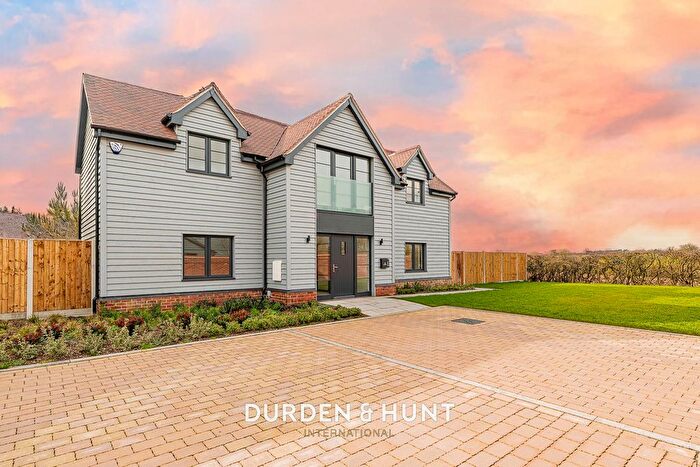
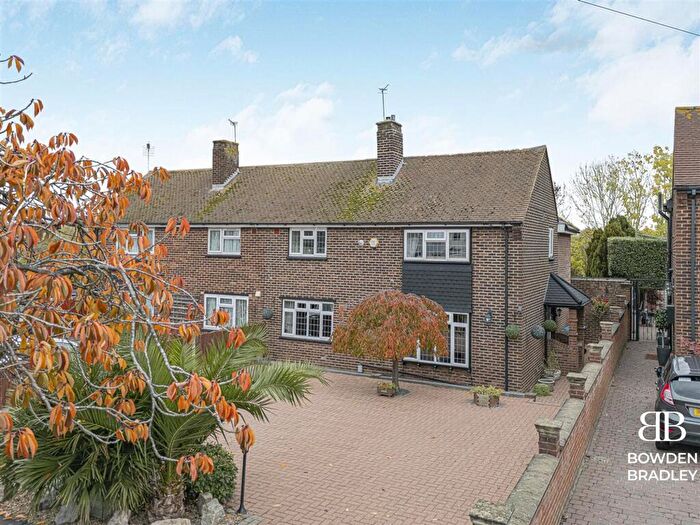
Houses for sale & to rent in Lambourne, Romford
House Prices in Lambourne
Properties in Lambourne have an average house price of £563,586.00 and had 79 Property Transactions within the last 3 years¹.
Lambourne is an area in Romford, Essex with 904 households², where the most expensive property was sold for £2,350,000.00.
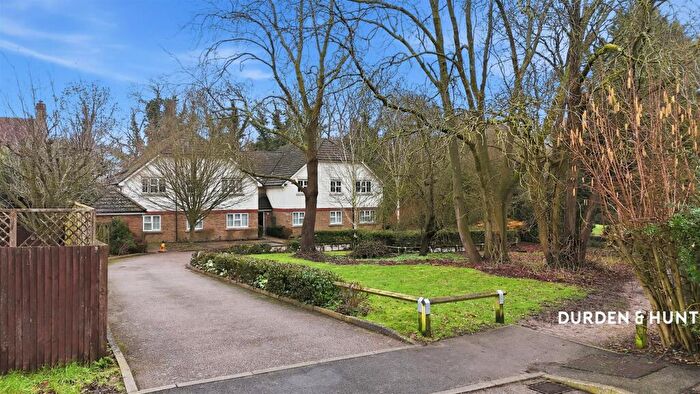
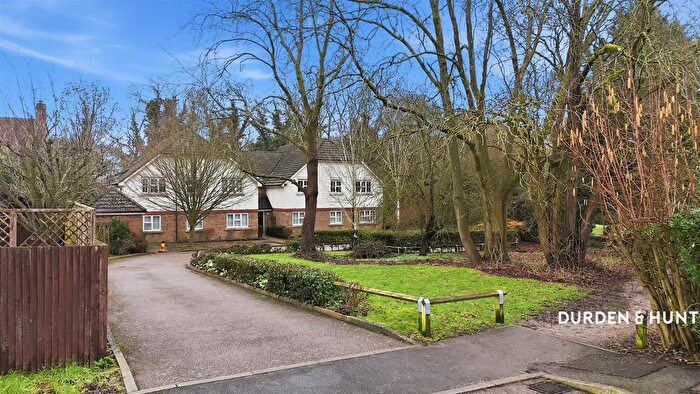
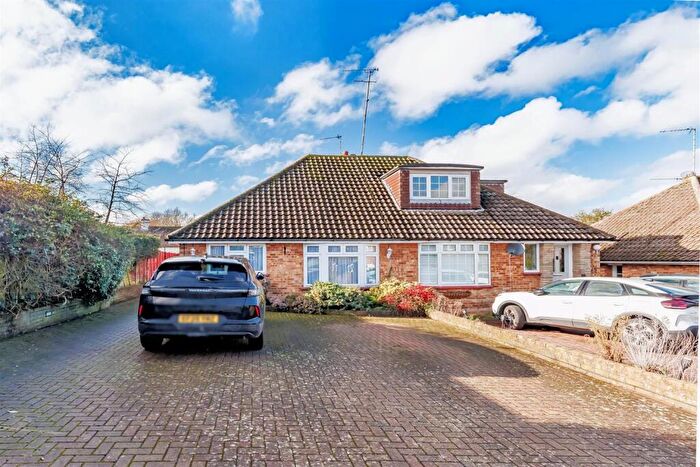
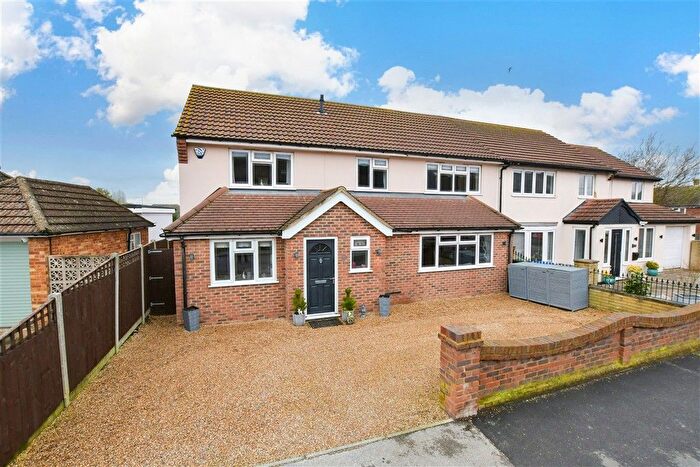
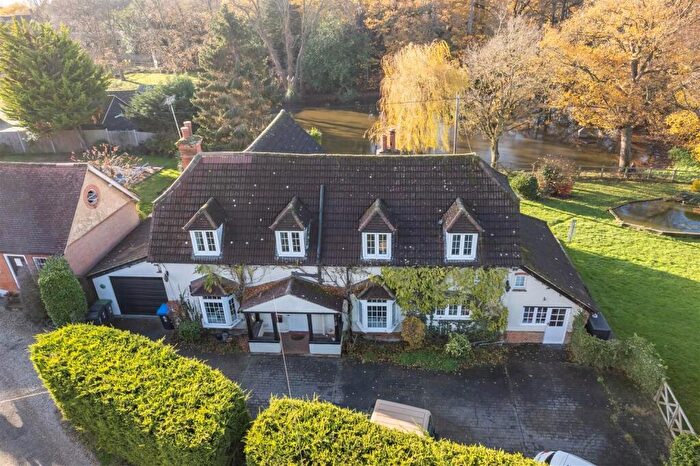
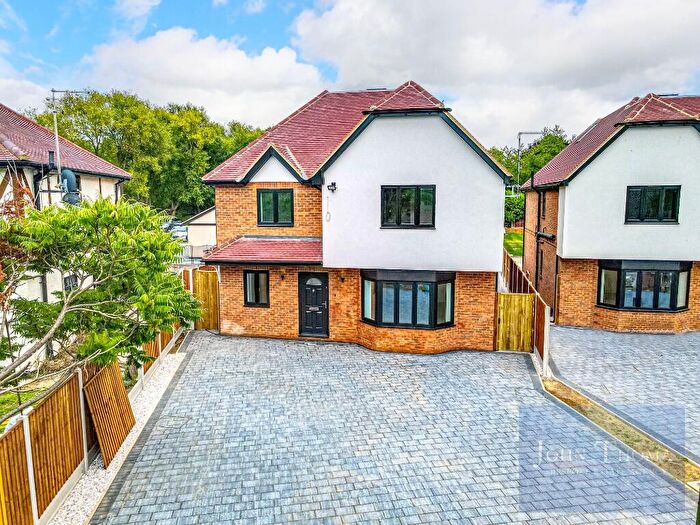
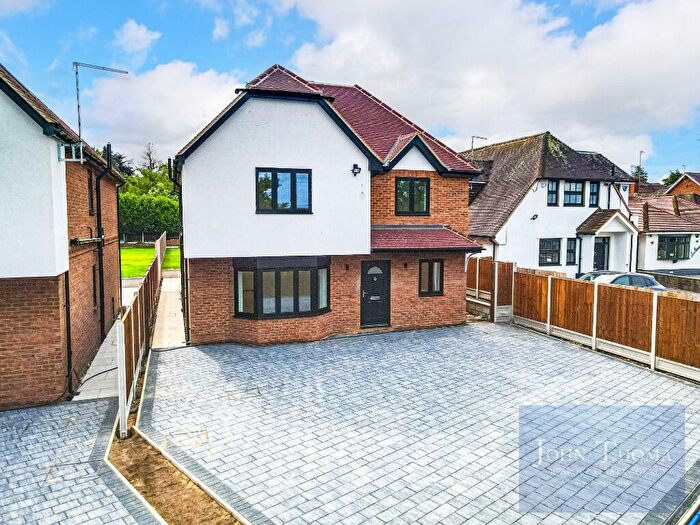
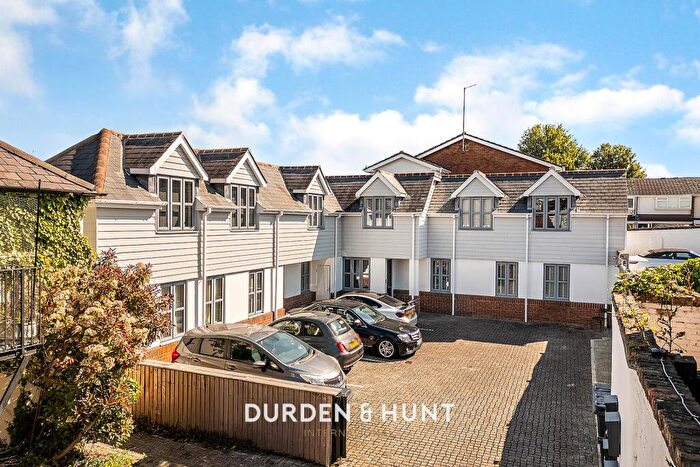
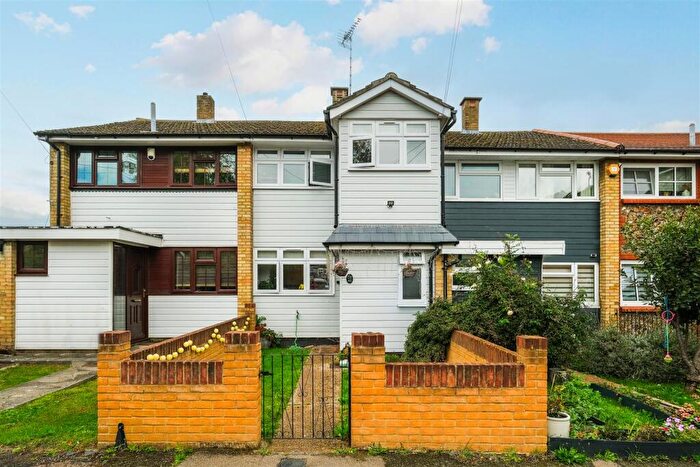
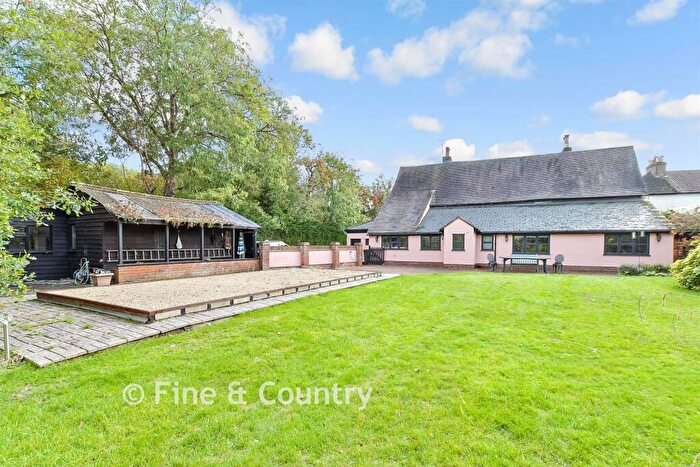
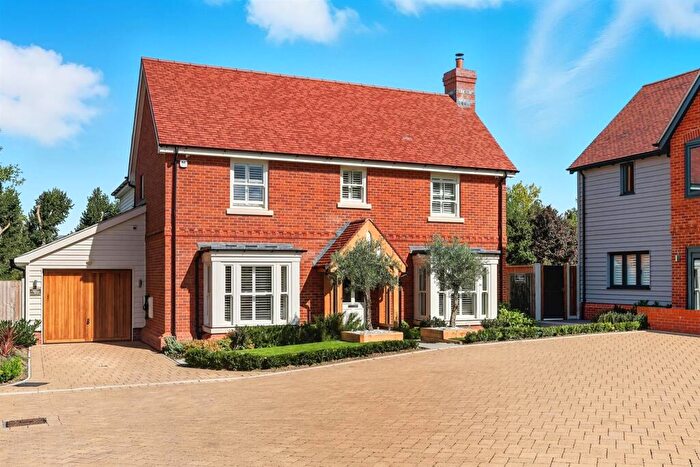
Properties for sale in Lambourne
Roads and Postcodes in Lambourne
Navigate through our locations to find the location of your next house in Lambourne, Romford for sale or to rent.
| Streets | Postcodes |
|---|---|
| Abridge Mews | RM4 1BA |
| Abridge Park | RM4 1XS RM4 1XT |
| Alderwood Close | RM4 1DH |
| Alderwood Drive | RM4 1DD RM4 1DJ RM4 1DP |
| Church Lane | RM4 1AD RM4 1AH RM4 1AB |
| Crabtree Hill | RM4 1ND |
| Field Close | RM4 1DL |
| Fir Trees | RM4 1DG |
| Hoe Lane | RM4 1AU RM4 1AX RM4 1NL RM4 1NP |
| Knights Walk | RM4 1DR |
| Lambourne Square | RM4 1NJ |
| London Road | RM4 1UU RM4 1UX RM4 1XA RM4 1XB RM4 1XH RM4 1XJ RM4 1XP RM4 1XU RM4 1XX RM4 1UT RM4 1XD RM4 1XL |
| Manor Road | RM4 1LX RM4 1NA RM4 1NB RM4 1NH |
| Market Place | RM4 1UA |
| Middle Boy | RM4 1DT |
| New Farm Drive | RM4 1BD RM4 1BS RM4 1BT RM4 1BU |
| New Road | RM4 1AJ RM4 1AP RM4 1AS RM4 1AT RM4 1DY RM4 1AL |
| Ongar Road | RM4 1BN RM4 1UB RM4 1UH RM4 1UJ RM4 1UL RM4 1UP RM4 1AA RM4 1RH RM4 1UD |
| Orchid Close | RM4 1DF |
| Pancroft | RM4 1BX RM4 1DA |
| Park Square | RM4 1AR |
| Sawyers Chase | RM4 1BY |
| Silver Street | RM4 1YA |
| Spur Close | RM4 1DS |
| Stapleford Aerodrome | RM4 1SJ |
| The Chestnuts | RM4 1UE |
| The Poplars | RM4 1BB |
| Turners Court | RM4 1UQ |
| Willow Tree Close | RM4 1BL |
Transport near Lambourne
- FAQ
- Price Paid By Year
- Property Type Price
Frequently asked questions about Lambourne
What is the average price for a property for sale in Lambourne?
The average price for a property for sale in Lambourne is £563,586. This amount is 16% lower than the average price in Romford. There are 459 property listings for sale in Lambourne.
What streets have the most expensive properties for sale in Lambourne?
The streets with the most expensive properties for sale in Lambourne are Hoe Lane at an average of £2,325,000, Church Lane at an average of £890,000 and London Road at an average of £758,454.
What streets have the most affordable properties for sale in Lambourne?
The streets with the most affordable properties for sale in Lambourne are New Farm Drive at an average of £216,000, Orchid Close at an average of £294,312 and Market Place at an average of £300,000.
Which tube stations are available in or near Lambourne?
Some of the tube stations available in or near Lambourne are Debden, Theydon Bois and Grange Hill.
Property Price Paid in Lambourne by Year
The average sold property price by year was:
| Year | Average Sold Price | Price Change |
Sold Properties
|
|---|---|---|---|
| 2025 | £500,431 | -26% |
22 Properties |
| 2024 | £631,011 | 13% |
27 Properties |
| 2023 | £549,216 | 1% |
30 Properties |
| 2022 | £542,026 | -11% |
38 Properties |
| 2021 | £600,281 | 12% |
48 Properties |
| 2020 | £528,673 | -13% |
26 Properties |
| 2019 | £597,152 | 22% |
23 Properties |
| 2018 | £467,829 | -2% |
31 Properties |
| 2017 | £476,404 | -10% |
25 Properties |
| 2016 | £522,558 | 15% |
43 Properties |
| 2015 | £444,846 | -8% |
49 Properties |
| 2014 | £479,164 | 16% |
31 Properties |
| 2013 | £401,752 | -5% |
34 Properties |
| 2012 | £422,020 | 25% |
24 Properties |
| 2011 | £317,343 | -4% |
28 Properties |
| 2010 | £330,845 | 16% |
26 Properties |
| 2009 | £279,429 | -45% |
12 Properties |
| 2008 | £405,162 | 19% |
20 Properties |
| 2007 | £328,243 | -24% |
51 Properties |
| 2006 | £405,979 | -9% |
48 Properties |
| 2005 | £444,456 | 31% |
43 Properties |
| 2004 | £307,936 | 16% |
41 Properties |
| 2003 | £259,005 | 3% |
47 Properties |
| 2002 | £250,916 | 22% |
61 Properties |
| 2001 | £196,417 | 18% |
72 Properties |
| 2000 | £161,110 | -8% |
42 Properties |
| 1999 | £173,554 | 19% |
39 Properties |
| 1998 | £139,786 | 15% |
31 Properties |
| 1997 | £118,642 | 9% |
34 Properties |
| 1996 | £107,768 | 24% |
29 Properties |
| 1995 | £82,038 | - |
42 Properties |
Property Price per Property Type in Lambourne
Here you can find historic sold price data in order to help with your property search.
The average Property Paid Price for specific property types in the last three years are:
| Property Type | Average Sold Price | Sold Properties |
|---|---|---|
| Semi Detached House | £586,823.00 | 38 Semi Detached Houses |
| Detached House | £1,178,055.00 | 9 Detached Houses |
| Terraced House | £427,437.00 | 16 Terraced Houses |
| Flat | £298,906.00 | 16 Flats |

