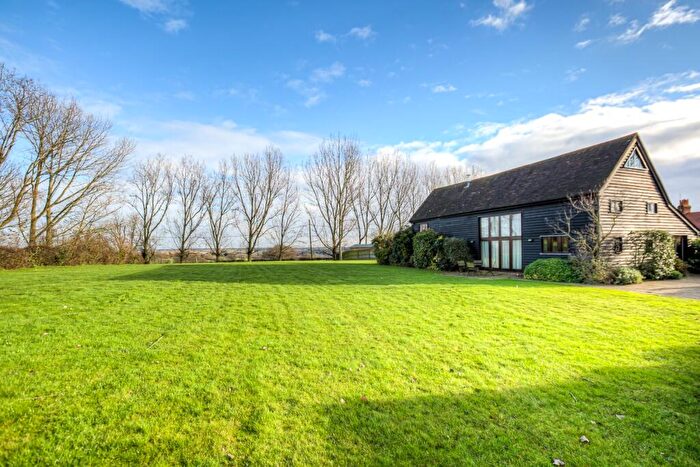
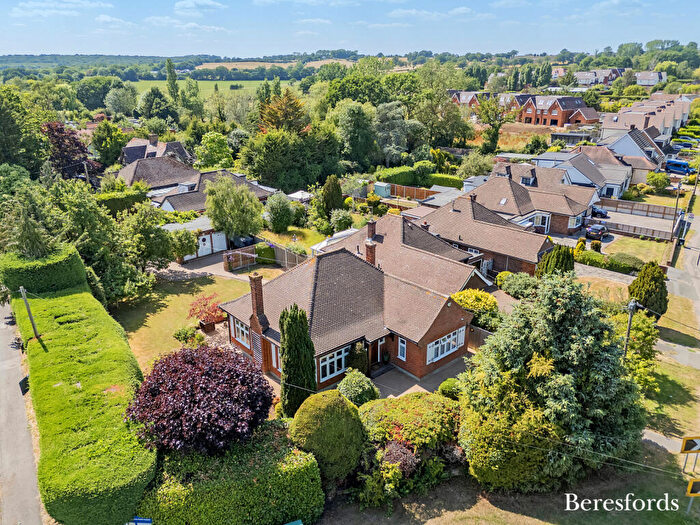
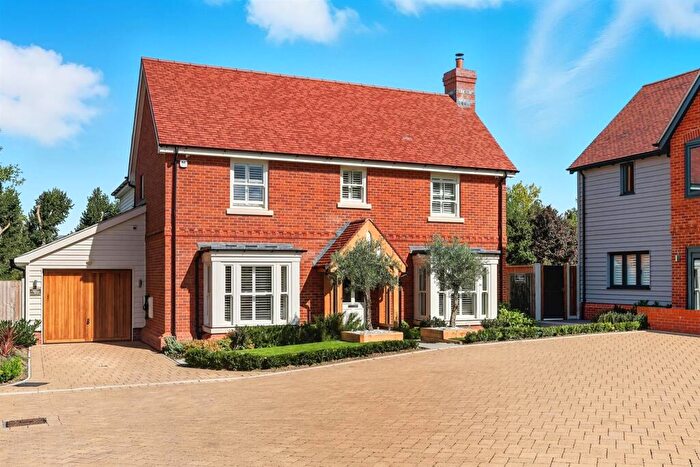
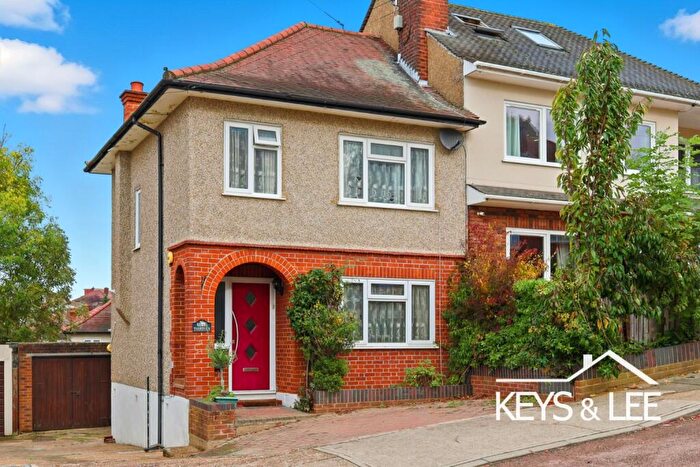
Houses for sale & to rent in Passingford, Romford
House Prices in Passingford
Properties in Passingford have an average house price of £869,342.00 and had 41 Property Transactions within the last 3 years¹.
Passingford is an area in Romford, Essex with 457 households², where the most expensive property was sold for £2,100,000.00.
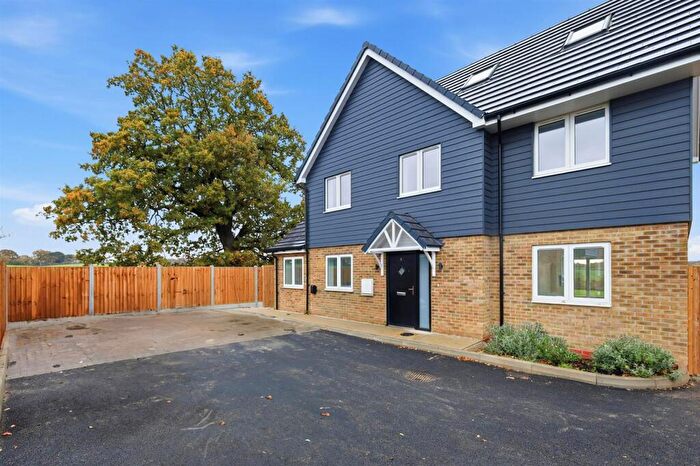
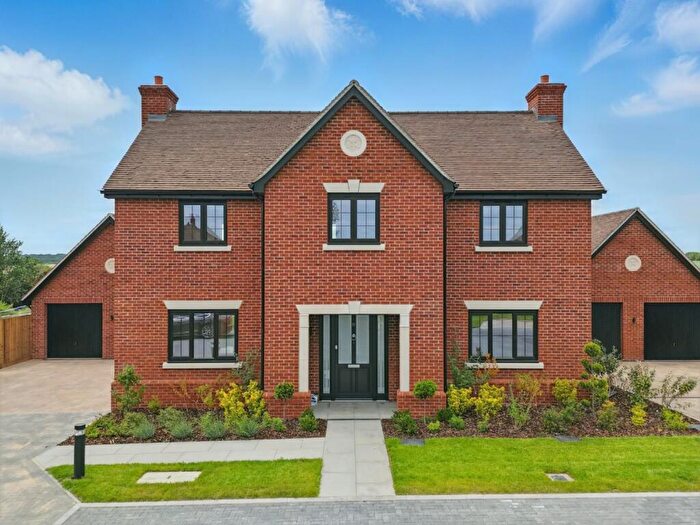
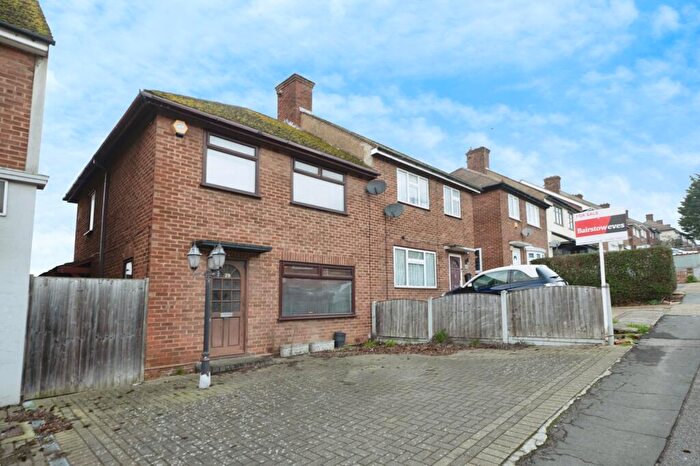
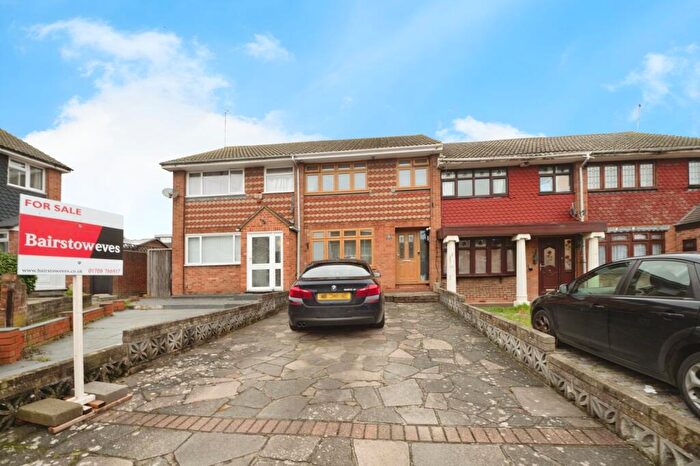
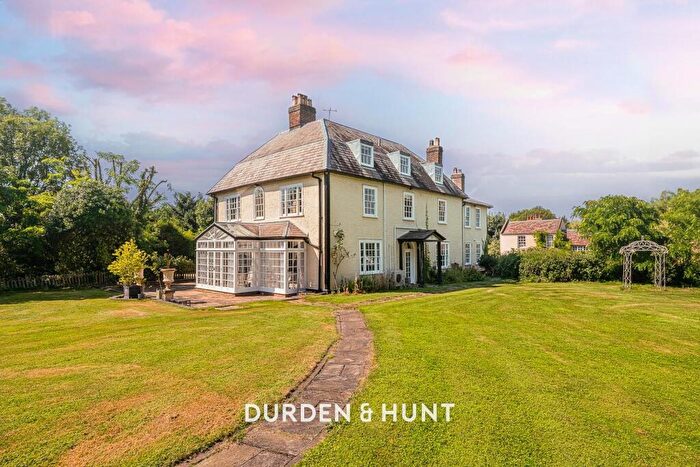
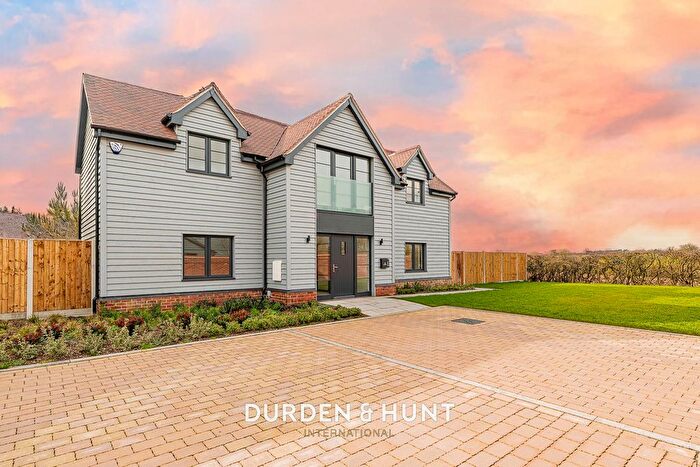
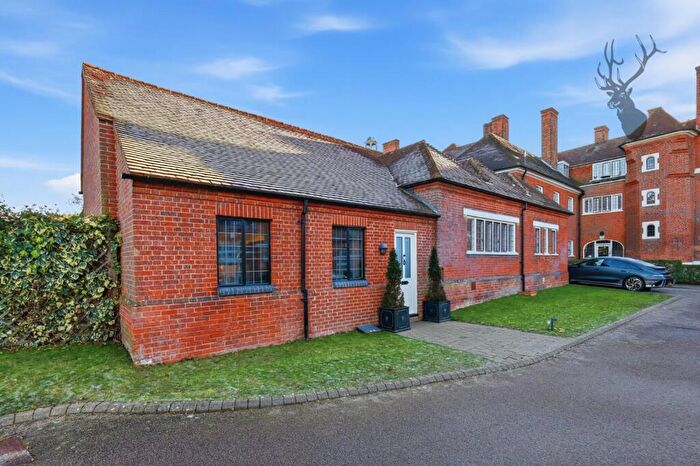
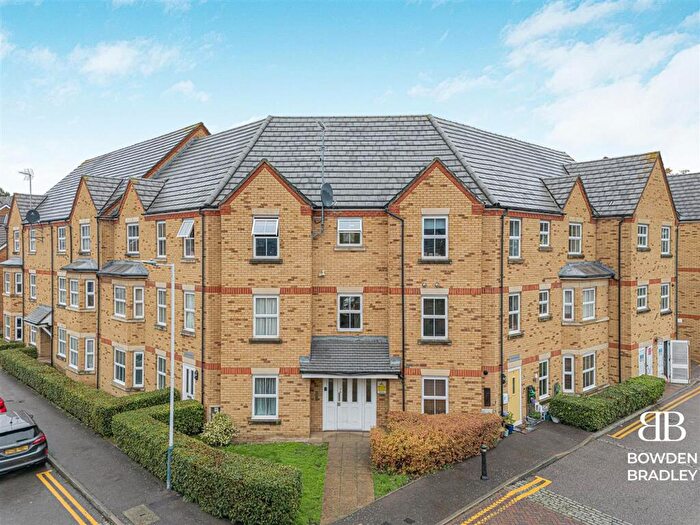
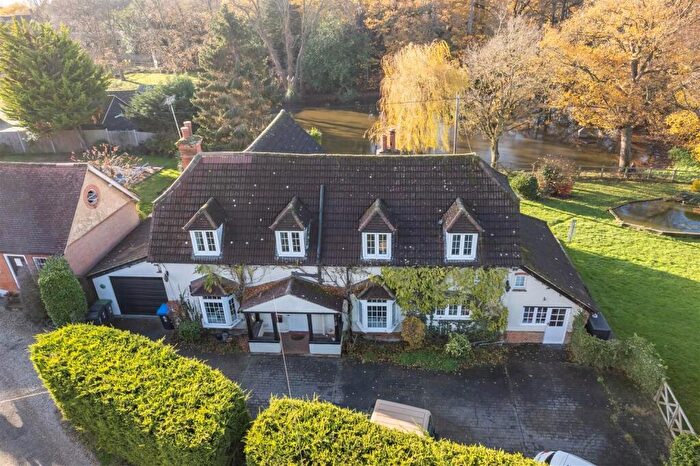
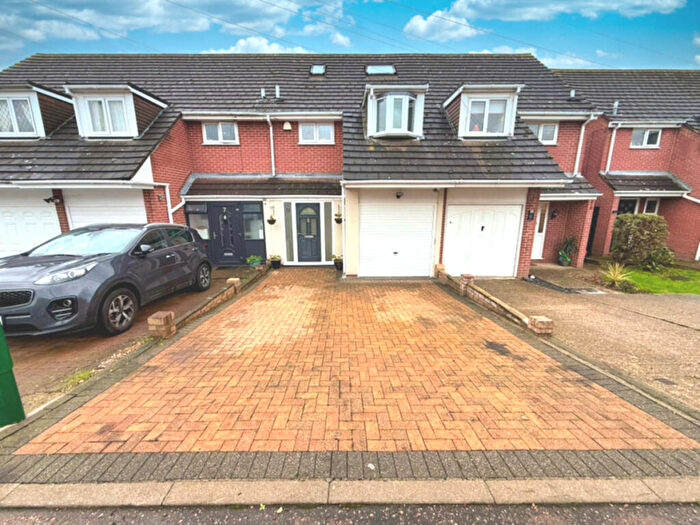
Properties for sale in Passingford
Roads and Postcodes in Passingford
Navigate through our locations to find the location of your next house in Passingford, Romford for sale or to rent.
| Streets | Postcodes |
|---|---|
| Abridge | RM4 1TU |
| Albyns Lane | RM4 1RS |
| Bournebridge Lane | RM4 1LT RM4 1LU |
| Church Terrace | RM4 1ES |
| Curtis Mill Lane | RM4 1HS |
| Epping Lane | RM4 1ST |
| Gutteridge Lane | RM4 1EG |
| Hook Lane | RM4 1EL RM4 1EP RM4 1NR |
| Kensington Park | RM4 1AF |
| London Road | RM4 1BF RM4 1SL RM4 1SP |
| Murthering Lane | RM4 1HT RM4 1JT |
| Nupers Hatch | RM4 1JR |
| Oak Hill Road | RM4 1EH RM4 1JH RM4 1JJ RM4 1JL RM4 1EB |
| Ongar Road | RM4 1RD |
| Stable Close | RM4 1DW |
| Stapleford Road | RM4 1EJ RM4 1ER RM4 1RP RM4 1EF RM4 1EW RM4 1RR |
| Tawney Lane | RM4 1DE RM4 1DQ RM4 1DU RM4 1EE RM4 1TA RM4 1TD |
| The Paddocks | RM4 1HG |
| Theydon Meadows | RM4 1EY |
| Tysea Hill | RM4 1JP RM4 1JS RM4 1JU |
| RM4 1TJ |
Transport near Passingford
-
Theydon Bois Station
-
Debden Station
-
Grange Hill Station
-
Epping Station
-
Harold Wood Station
-
Hainault Station
-
Gidea Park Station
-
Chigwell Station
-
Romford Station
-
Fairlop Station
- FAQ
- Price Paid By Year
- Property Type Price
Frequently asked questions about Passingford
What is the average price for a property for sale in Passingford?
The average price for a property for sale in Passingford is £869,342. This amount is 29% higher than the average price in Romford. There are 1,062 property listings for sale in Passingford.
What streets have the most expensive properties for sale in Passingford?
The streets with the most expensive properties for sale in Passingford are Epping Lane at an average of £1,615,000, Murthering Lane at an average of £1,200,000 and The Paddocks at an average of £960,000.
What streets have the most affordable properties for sale in Passingford?
The streets with the most affordable properties for sale in Passingford are Tysea Hill at an average of £614,728, Curtis Mill Lane at an average of £727,500 and Oak Hill Road at an average of £795,615.
Which train stations are available in or near Passingford?
Some of the train stations available in or near Passingford are Harold Wood, Gidea Park and Romford.
Which tube stations are available in or near Passingford?
Some of the tube stations available in or near Passingford are Theydon Bois, Debden and Grange Hill.
Property Price Paid in Passingford by Year
The average sold property price by year was:
| Year | Average Sold Price | Price Change |
Sold Properties
|
|---|---|---|---|
| 2025 | £884,128 | -3% |
15 Properties |
| 2024 | £909,375 | 14% |
16 Properties |
| 2023 | £783,110 | -7% |
10 Properties |
| 2022 | £836,815 | -10% |
19 Properties |
| 2021 | £921,258 | 27% |
28 Properties |
| 2020 | £668,142 | -17% |
14 Properties |
| 2019 | £784,333 | 4% |
15 Properties |
| 2018 | £755,500 | 24% |
10 Properties |
| 2017 | £571,446 | -9% |
17 Properties |
| 2016 | £622,150 | 5% |
20 Properties |
| 2015 | £588,131 | 14% |
19 Properties |
| 2014 | £505,566 | -20% |
15 Properties |
| 2013 | £605,416 | 24% |
18 Properties |
| 2012 | £459,777 | -5% |
9 Properties |
| 2011 | £483,541 | 6% |
12 Properties |
| 2010 | £452,318 | -9% |
11 Properties |
| 2009 | £491,800 | -30% |
13 Properties |
| 2008 | £641,090 | 26% |
11 Properties |
| 2007 | £475,312 | -18% |
16 Properties |
| 2006 | £560,781 | 11% |
16 Properties |
| 2005 | £499,915 | 15% |
12 Properties |
| 2004 | £426,322 | -6% |
31 Properties |
| 2003 | £450,250 | 26% |
16 Properties |
| 2002 | £331,979 | 9% |
24 Properties |
| 2001 | £303,672 | 15% |
11 Properties |
| 2000 | £258,153 | -5% |
17 Properties |
| 1999 | £271,175 | 29% |
22 Properties |
| 1998 | £191,916 | -12% |
18 Properties |
| 1997 | £215,329 | -5% |
22 Properties |
| 1996 | £226,377 | 14% |
24 Properties |
| 1995 | £194,809 | - |
11 Properties |
Property Price per Property Type in Passingford
Here you can find historic sold price data in order to help with your property search.
The average Property Paid Price for specific property types in the last three years are:
| Property Type | Average Sold Price | Sold Properties |
|---|---|---|
| Semi Detached House | £682,000.00 | 10 Semi Detached Houses |
| Detached House | £975,711.00 | 28 Detached Houses |
| Terraced House | £501,033.00 | 3 Terraced Houses |

