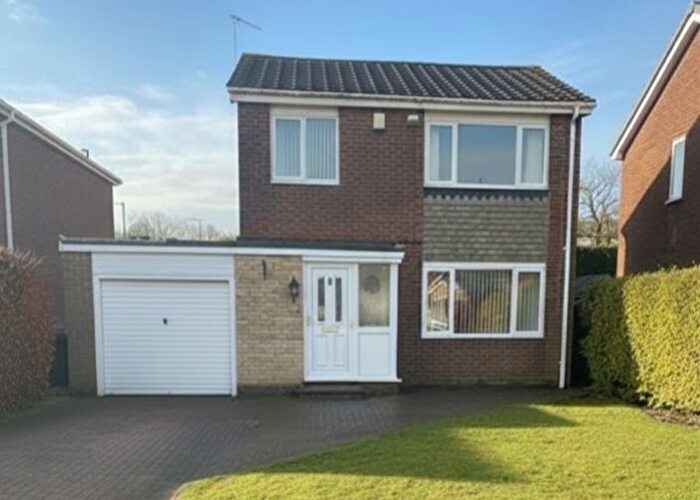
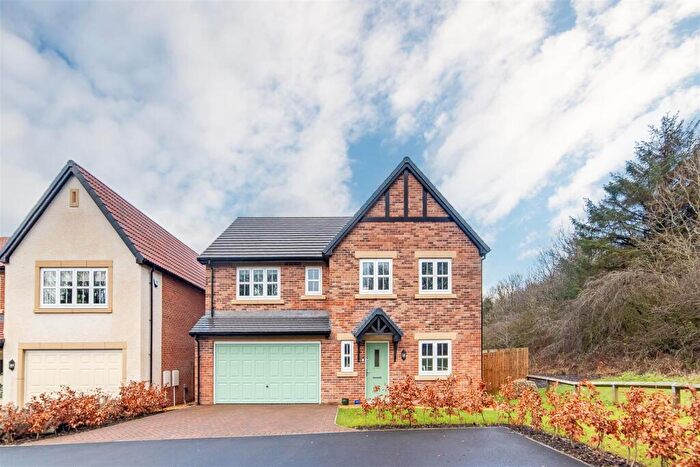
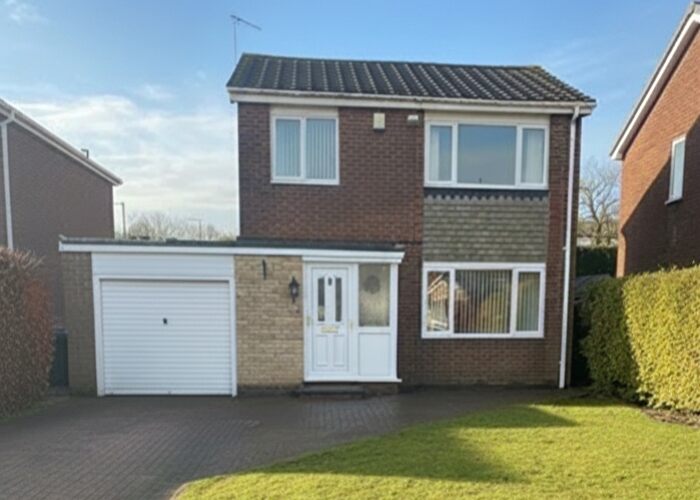
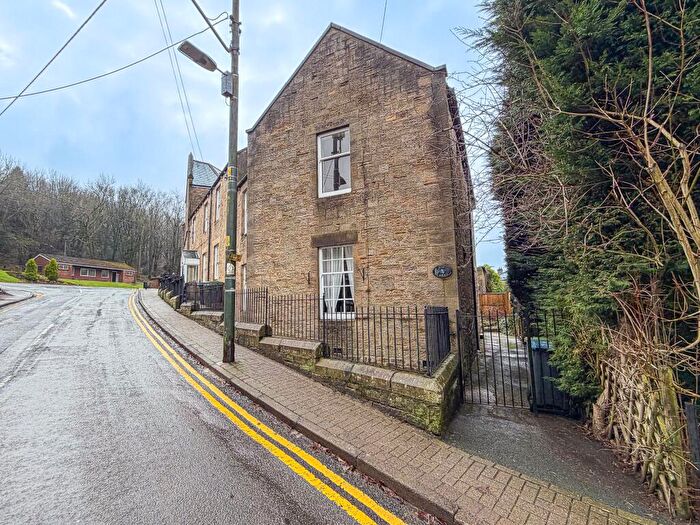
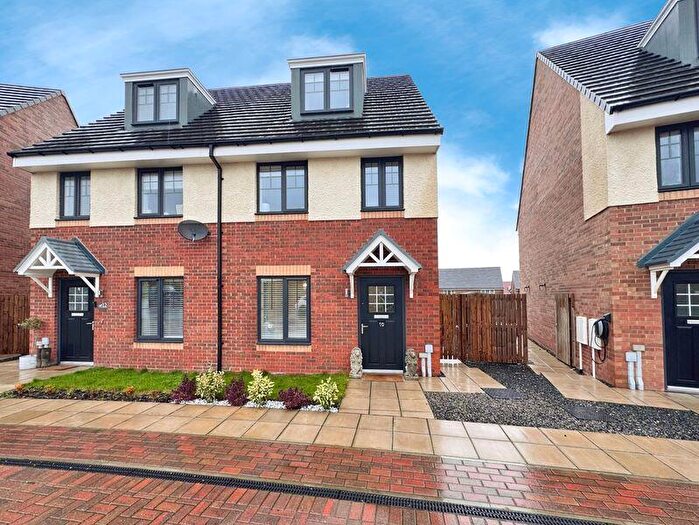
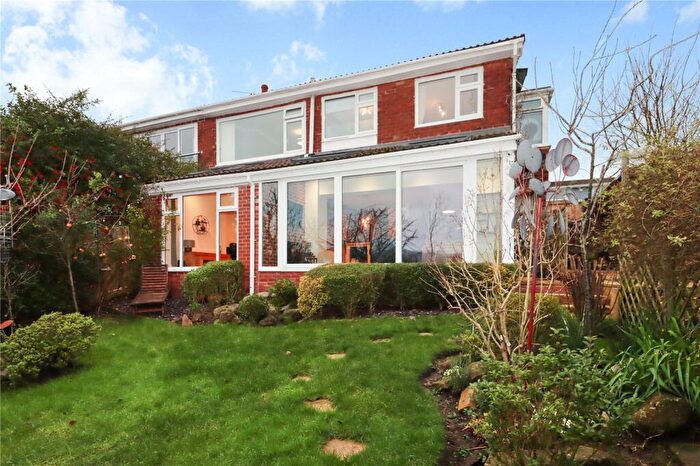
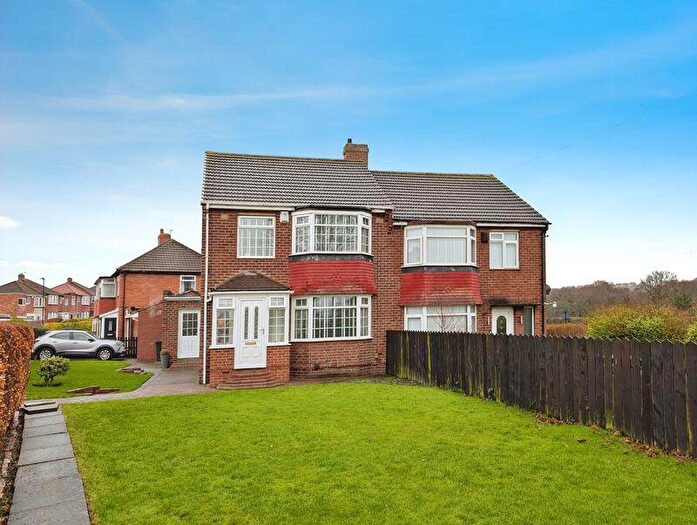
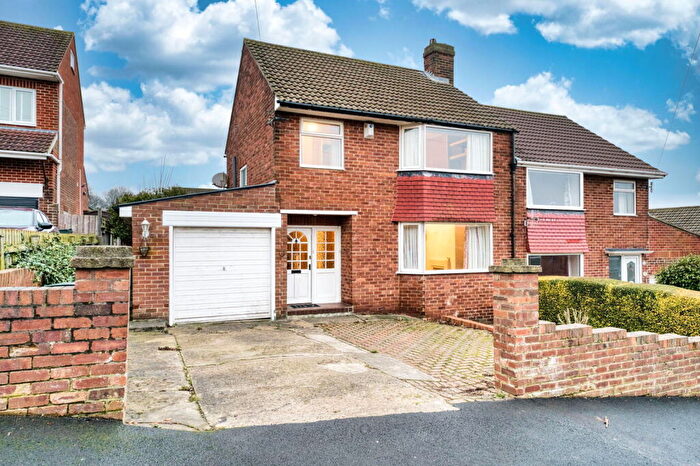
Houses for sale & to rent in Blaydon-on-tyne, Gateshead
House Prices in Blaydon-on-tyne
Properties in Blaydon-on-tyne have an average house price of £166,195.00 and had 751 Property Transactions within the last 3 years.¹
Blaydon-on-tyne is an area in Gateshead with 7,467 households², where the most expensive property was sold for £910,000.00.
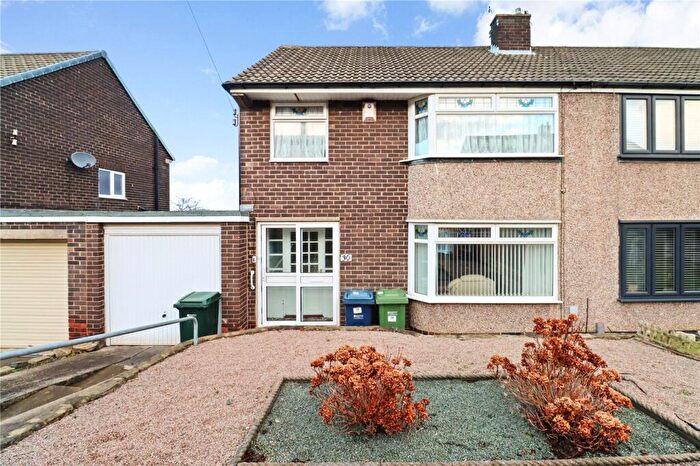
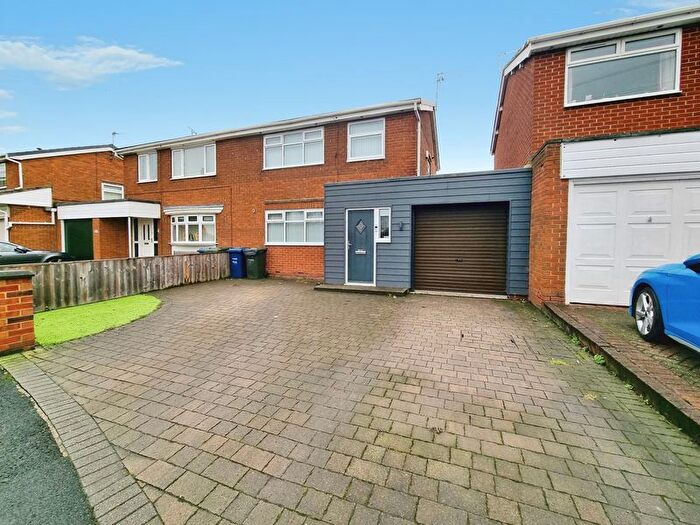
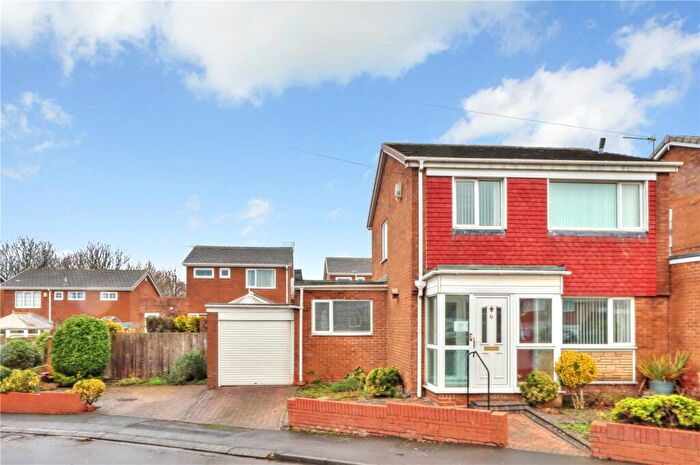
Properties for sale in Blaydon-on-tyne
Neighbourhoods in Blaydon-on-tyne
Navigate through our locations to find the location of your next house in Blaydon-on-tyne, Gateshead for sale or to rent.
Transport in Blaydon-on-tyne
Please see below transportation links in this area:
- FAQ
- Price Paid By Year
- Property Type Price
Frequently asked questions about Blaydon-on-tyne
What is the average price for a property for sale in Blaydon-on-tyne?
The average price for a property for sale in Blaydon-on-tyne is £166,195. This amount is 1% lower than the average price in Gateshead. There are 8,014 property listings for sale in Blaydon-on-tyne.
What locations have the most expensive properties for sale in Blaydon-on-tyne?
The locations with the most expensive properties for sale in Blaydon-on-tyne are Crawcrook And Greenside at an average of £680,000 and Ryton, Crookhill And Stella at an average of £196,106.
What locations have the most affordable properties for sale in Blaydon-on-tyne?
The locations with the most affordable properties for sale in Blaydon-on-tyne are Blaydon at an average of £155,668 and Winlaton And High Spen at an average of £170,061.
Which train stations are available in or near Blaydon-on-tyne?
Some of the train stations available in or near Blaydon-on-tyne are Blaydon, MetroCentre and Dunston.
Property Price Paid in Blaydon-on-tyne by Year
The average sold property price by year was:
| Year | Average Sold Price | Price Change |
Sold Properties
|
|---|---|---|---|
| 2025 | £168,939 | 1% |
214 Properties |
| 2024 | £167,614 | 3% |
282 Properties |
| 2023 | £162,321 | -2% |
255 Properties |
| 2022 | £166,260 | -1% |
306 Properties |
| 2021 | £168,112 | 12% |
348 Properties |
| 2020 | £147,385 | 4% |
278 Properties |
| 2019 | £141,966 | -11% |
288 Properties |
| 2018 | £158,239 | 5% |
349 Properties |
| 2017 | £150,943 | 10% |
329 Properties |
| 2016 | £136,223 | -3% |
281 Properties |
| 2015 | £140,698 | 1% |
346 Properties |
| 2014 | £139,694 | 1% |
319 Properties |
| 2013 | £138,778 | -2% |
299 Properties |
| 2012 | £142,138 | -2% |
232 Properties |
| 2011 | £144,988 | -7% |
255 Properties |
| 2010 | £154,652 | 9% |
259 Properties |
| 2009 | £140,451 | 3% |
232 Properties |
| 2008 | £136,143 | 3% |
205 Properties |
| 2007 | £132,694 | 9% |
469 Properties |
| 2006 | £120,210 | 6% |
310 Properties |
| 2005 | £112,517 | 2% |
263 Properties |
| 2004 | £110,341 | 22% |
260 Properties |
| 2003 | £86,231 | 19% |
319 Properties |
| 2002 | £69,597 | 14% |
394 Properties |
| 2001 | £60,174 | 14% |
328 Properties |
| 2000 | £51,792 | 4% |
252 Properties |
| 1999 | £49,745 | 5% |
225 Properties |
| 1998 | £47,454 | 3% |
240 Properties |
| 1997 | £46,081 | 5% |
244 Properties |
| 1996 | £43,824 | 5% |
275 Properties |
| 1995 | £41,603 | - |
216 Properties |
Property Price per Property Type in Blaydon-on-tyne
Here you can find historic sold price data in order to help with your property search.
The average Property Paid Price for specific property types in the last three years are:
| Property Type | Average Sold Price | Sold Properties |
|---|---|---|
| Semi Detached House | £177,913.00 | 265 Semi Detached Houses |
| Detached House | £305,986.00 | 98 Detached Houses |
| Terraced House | £130,740.00 | 324 Terraced Houses |
| Flat | £83,106.00 | 64 Flats |

